MRD:RGF
Molecular Reaction Dynamics for Triatomic Systems
H + H2 systems
OVERALL: 4/5. A very detailed and thorough report in most places. One or two missing bits held your report back from full marks. See the comments throughout for detailed feedback.
Potential Energy Surface Plots and Transition States
A potential energy surface maps the progress of a reaction as a function of rAB and rBC. The trajectory of the reaction is the relative positions of the atoms at each instant in time, and shows how these relative positions lead to a change in potential energy of the system. The trajectory is displayed as a black line on the plots. The transition state is displayed as a saddle point on a potential energy surface, and is defined as the maximum on the minimum energy path.[1] The reactants and products form minima on the minimum energy path due to there being no unfavorable interactions between H and H2, however when the atom approaches H2 they begin to repel each other, increasing the potential energy. The maximum repulsion is reached at the transition state. The transition state is mathematically defined as:∂V(rAB)/∂rAB=∂V(rBC)/∂rBC=0. It can be distinguished from a local minimum of the potential energy surface as ∂V2(rAB)/∂rAB2 > 0, since it is a minimum point, and ∂V2(rBC)/∂rBC2 < 0, since it is a maximum point.
A sensible description, but where do these directions lie on the TS?
Estimating the Transition State Position
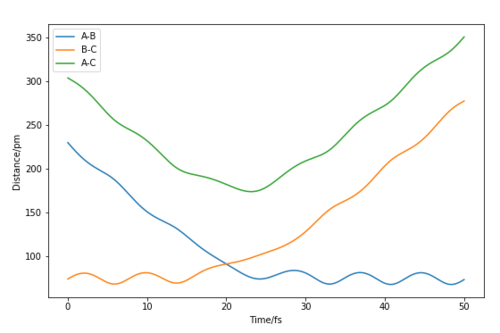
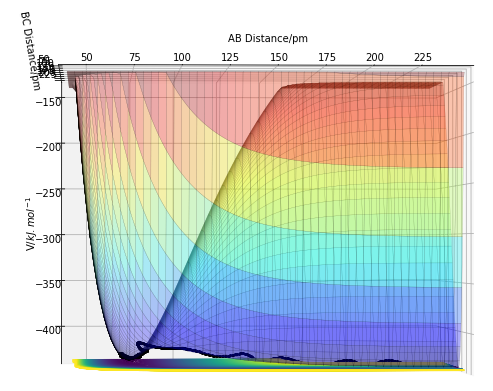
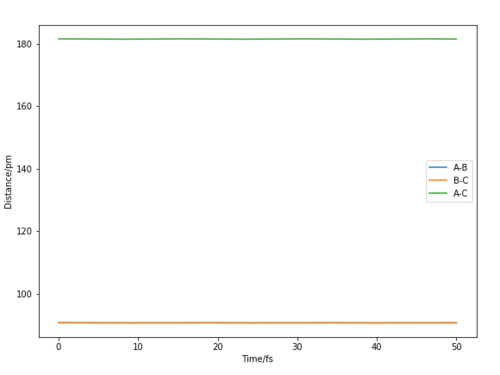
Since the potential energy surface for the H + H2 system is symmetric, the transition state is when the distances between AB and BC are equal.[2] Figure 2 allows this distance to be estimated at 85 - 95 pm. The initial conditions were set to p1 = p2 = 0.0 g.mol-1.pm.fs-1 and rAB = rBC. Different distance values were tested until the internuclear distance against time graph had a gradient of zero, and the animation showed the system undergoing a periodic symmetric vibration. This gave the estimate of the transition state position, rts, to be equal to 90.8 pm. Giving the energy at the transition state to be -415.4 kJ.mol-1.
A sensible estimate.
Reaction Path
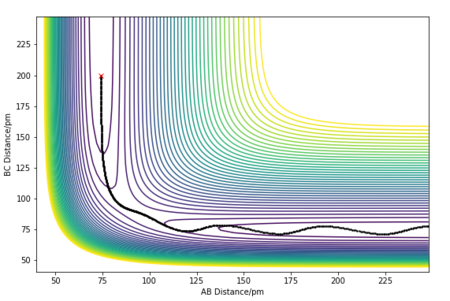
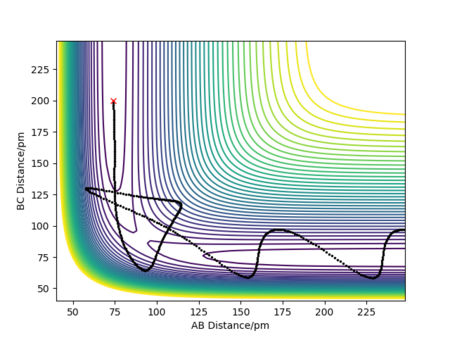
The MEP (minimum energy path) calculates the reaction path by using a trajectory that has the particles moving infinitely slowly. It does this by resetting the momenta to zero in each time step, this causes the MEP calculation to follow the valley floor throughout the whole reaction. In the dynamic calculations, the particles have a momentum that causes an oscillating nature, where the energy is continually switching from potential to kinetic energy. This can be seen in the wavy nature of the trajectory as it continually goes through peaks and troughs of potential energy. The dynamic calculation is more realistic as atoms have a mass and their motion will be inertial.
A sensible explanation, well done
The initial conditions were set to slightly displace the transition state towards the products and with an initial momenta of zero.
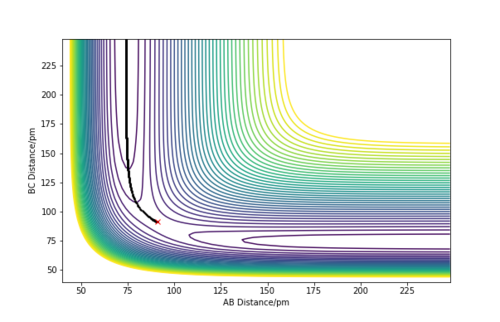
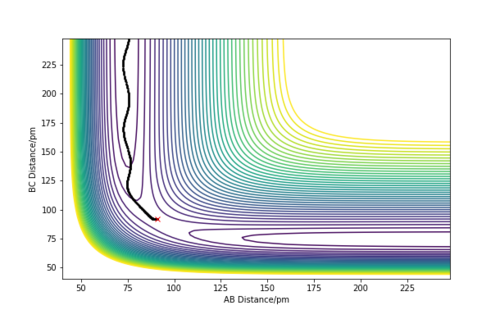
Reactive and Unreactive Trajectories
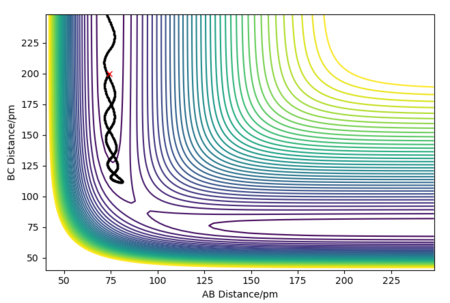
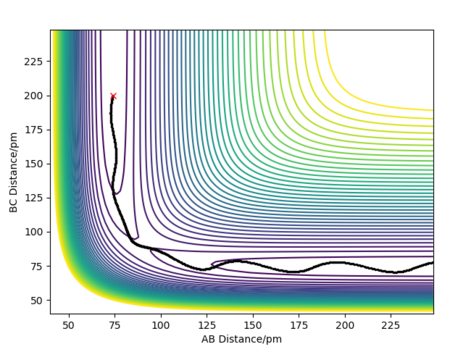
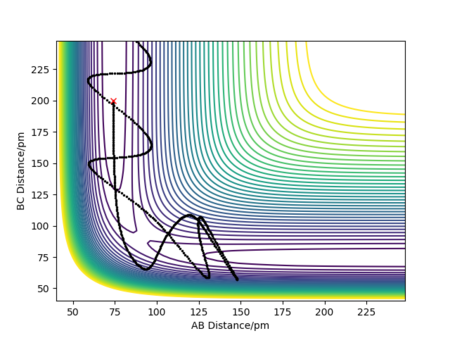
Setting the initial conditions to rAB=74 pm and rBC= 200 pm, different values for momenta were tested to see if higher energy guaranteed a reactive trajectory.
Transition State Theory
Transition state theory (TST) rationalises a reaction as the minimum energy path from the reactants to the products, passing through an energy maxima, which represents the transition state. TST makes many assumptions which affects its reaction rate when compared to experimental rates.[3]
• TST considers the system classically, it is described by a trajectory with a velocity and not a wavefunction. In our model for our potential energy surface, our trajectory is described by a momentum (velocity x mass), so is treated classically.
• Since the system is classical, quantum tunneling is ignored. This will lead to TST giving an underestimation of the rate, as a classical view won't allow molecules with insufficient energy to overcome the activation energy by tunneling through the potential barrier.
• The kinetic energy along the reaction coordinate follows the Boltzmann distribution.
• At the transition state, you can't separate the motion of the system at the lowest point of the saddle point.
• TST states that all trajectories with a kinetic energy larger than the activation energy will be reactive, and that every time the transition state is crossed products are formed. This assumption is proved wrong by Figure 5, as it shows that reactants can cross the transition state forming products, and then these products can pass back through the transition state reforming the reactants. This will lead to an overestimation in the TST reaction rate.
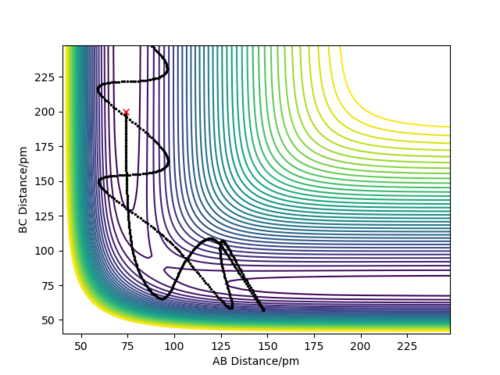
Quantum tunneling contributes a relatively low amount to the rate of reaction when compared to the fact that not all transition state crossings form products. Therefore, TST leads to an overestimation of the rate when compared to experimental rates.
A very detailed and thorough explanation, well done!
F - H - H system
Potential Energy Surface
The initial conditions were set up so atoms A=F, B=H and C=H. This produced a potential energy surface for which at a large BC distance HF + H would form, and at large AB distance F + H2 would form. From Figure 7, you can see that the potential energy at large AB distance is more positive than at large BC distance. Therefore, HF + H is at a lower energy than F + H2.
HF + H -> F + H2 Endothermic
F + H2 -> HF + H Exothermic

Transition State
This energy surface isn't symmetrical, so the two r values can't just be set to the same value to predict the transition state. The transition state must be estimated through its definition, the maxima on the minimum energy curve, via the identification of a saddle point. The Hammond postulate states that for an endothermic reaction (HF + H -> F + H2) the transition state will resemble the products, due to it being a late transition state. Therefore, the H2 distance was set to the bond distance of 74.5 pm, and different distances between F and H (the AB distance) were tested until the internuclear distance-time graph had a gradient of zero. The transition state point can be seen on Figure 7 as the black dot at rHH = 74.5 pm and rHF = 182 pm. Giving the energy at the transition state to be -434.0 kJ.mol-1.
Well done for backing up your estimate with some evidence. However, ow did you confirm that the system was at a transition state and not a potential energy minimum??
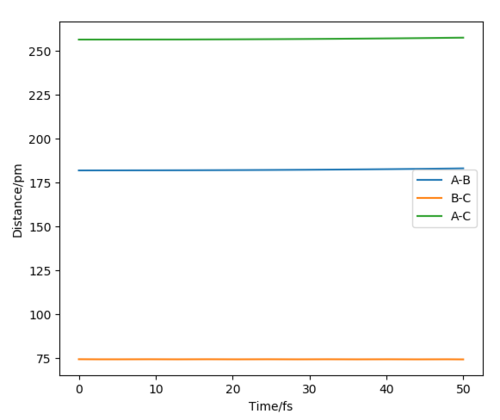
Activation Energy
Activation energy is the potential energy of the transition state minus the potential energy of the products, Ea = VTS - VR. The MEP calculation was used to find the potential energy of the reactants, VR = -558.7 kJ.mol-1. From the calculation for the transition state, the transition state potential energy was extracted, VTS = -434.0 kJ.mol-1. From this the activation energy was calculated, Ea = 124.7 kJ.mol-1.
What about in the other direction (i.e.: for the F+h2 reaction?)
Reaction Dynamics
Figure 9 shows the momentum-time graph for a reactive trajectory for the exothermic reaction (H2 + F -> HF + H). Where the initial conditions set the atoms A=H, B=H and C=F, which gave A-B to represent H-H and B-C to represent H-F. Since energy is conserved, the extra energy released from the reaction due to its exothermic nature is converted into vibrational energy, which causes the product molecule, HF, to have increased oscillation (seen in the increase in momentum).
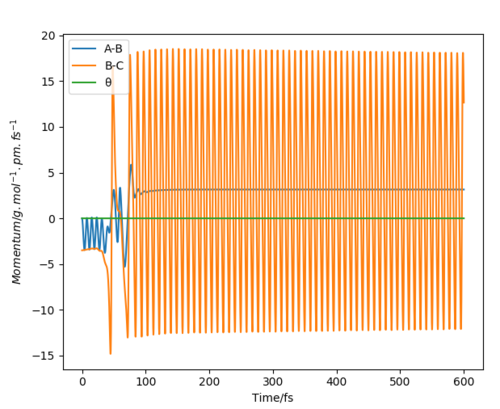
This can be measured experimentally by Raman scattering.[4] Electrons that become excited transition into higher vibrational states, this leads to overtone bands being present on the IR spectra. These overtone bands will increase in intensity as the higher vibrational states become more populated, allowing the increased vibrational energy of the system to be monitored.
Good! What other methods could be used?
How the Distribution of Energy Between Different Modes Affect the Efficiency of the Reaction
Polanyi's rules state that the position of the transition state determines what mode of energy will be more efficient for the reaction.[5] They state that for an early barrier transition state (closer to the reactants) translational energy is more efficient, and for a late barrier transition state vibrational energy is more efficient for a reactive trajectory.
The exothermic reaction (F + H2 -> HF + H) has an early barrier transition state, so translational energy, pHF, should be more efficient for a reactive trajectory than vibrational, pHH. Table 1 that when pHF is constant at -1 and pHH is increased, the trajectory stayed unreactive. However, when pHH is constant at -1 and pHF is increased, the trajectory became reactive. This proves that translational energy is more efficient than vibrational for the exothermic reaction.
| pHH / g.mol-1.pm.fm-1 | pHF / g.mol-1.pm.fm-1 | Reactive? |
|---|---|---|
| -1 | -1 | No |
| -2 | -1 | No |
| -3 | -1 | No |
| -1 | -2 | Yes |
| -1 | -3 | Yes |
The endothermic reaction (HF + H -> F + H2) has a late barrier transition state, so vibrational energy, pHF, should be more efficient for a reactive trajectory than translational, pHH. Table 2 shows that when pHF was increased and pHH was decreased the trajectory stayed reactive. This proves that vibrational energy is more efficient than translational for the endothermic reaction.
| pHH / g.mol-1.pm.fm-1 | pHF / g.mol-1.pm.fm-1 | Reactive? |
|---|---|---|
| -18 | 0 | Yes |
| -10 | 11 | Yes |
| 0 | 21 | Yes |
A very thorough and systematic analysis, well done. However, we need to see the trajectories as well.
References
- ↑ J. S. Francisco and W. L. Hase, Chemical kinetics and dynamics, Prentice-Hall, Upper Saddle River, 1989.
- ↑ N. E. Henriksen and F. Y. Hansen, Theories of molecular reaction dynamics : the microscopic foundation of chemical kinetics, Oxford University Press, Oxford, 2018.
- ↑ K. J. Laidler, Chemical kinetics, Harper & Row, New York, 1987.
- ↑ J. A. Koningstein, Introduction to the theory of the Raman effect, Reidel, Dordrecht, 1972.
- ↑ J. C. Polanyi, Acc. Chem. Res. 1972, 5, 161-168.

