MRD:RCR16
EXERCISE 1: H + H2 system
Dynamics from the transition state region
What value do the different components of the gradient of the potential energy surface have at a minimum and at a transition structure? Briefly explain how minima and transition structures can be distinguished using the curvature of the potential energy surface.
The partial derivative of V with respect to r1 and r2 must be 0 at local extremum point. To determine whether this point is a minimum, maximum or a saddle point(transition state), the second partial derivatives test can be used. The second derivative test discriminant D is calculated from the second order derivatives of the potential energy surface with respect to r1, r2 and both r1 and r2. If D is higher than 0 and the second order derivative with respect to r1 is higher than 0, the point is a minimum. If D is smaller than 0, then it is a saddle point.
(Good. But what is D? Use of some equations/inequalities would've been better here. Fjs113 (talk) 14:40, 28 May 2018 (BST))
Trajectories from r1 = r2: locating the transition state
Report your best estimate of the transition state position (rts) and explain your reasoning illustrating it with a “Internuclear Distances vs Time” plot for a relevant trajectory.
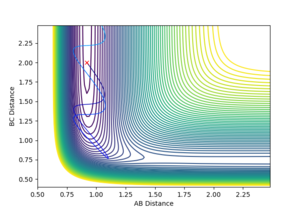
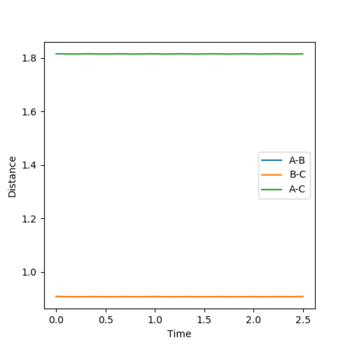
The transition state distance has been estimated to be around 0.908 Å for both A-B and B-C distances by testing of range of equal distances between the H atoms with 0 momentum and checking if the reaction trajectory still goes to the bottom of the well or stays still. This is easily seen in the internuclear distance vs time plot for the transition state, where the A-B and B-C distance lines overlap completely and show very little oscillation, as can be seen in Figure 1.
Trajectories from r1 = rts+δ, r2 = rts
Comment on how the mep and the trajectory you just calculated differ.
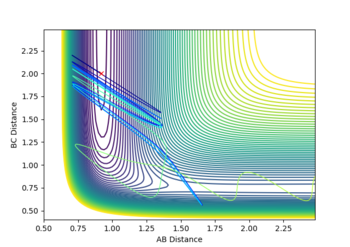
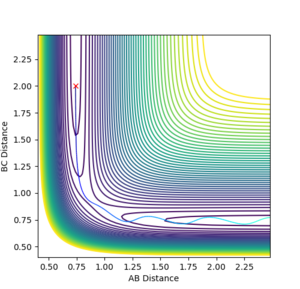
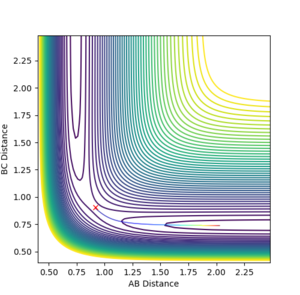
The mep line towards the products is quite straight, whereas the dynamic trajectory has a sinusoidal aspect. The mep line, in other words, shows the potential energy with the oscillation term completely removed (This is not the whole story. In the MEP, kinetic energy is reset to 0 at every time step. Fjs113 (talk) 14:40, 28 May 2018 (BST))
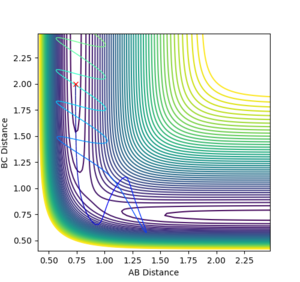
while the dynamic trajectory accounts for bond oscillation. This can be seen in Figure 2 and 3.

What would change if we used the initial conditions were reversed?
The reaction would take place in the opposite direction.
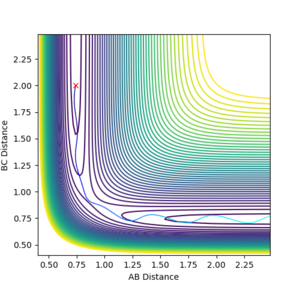
Setup a calculation where the initial positions correspond to the final positions of the trajectory you calculated above, the same final momenta values but with their signs reversed. What do you observe?
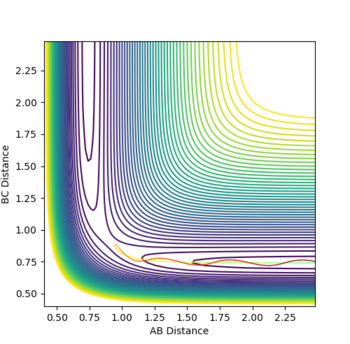
The reaction system reaches very close to the transition state but doesn't have enough energy to cross barrier, so it returns back to products, as seen in Figure 4.
Reactive and unreactive trajectories
Complete the table by adding a column with the total energy, and another column reporting if the trajectory is reactive or unreactive. For each set of initial conditions, provide a plot of the trajectory and a small description for what happens along the trajectory.
State what are the main assumptions of Transition State Theory. Given the results you have obtained, how will Transition State Theory predictions for reaction rate values compare with experimental values?
Transition state theory has 3 main assumptions stated slightly differently in different sources[1]: 1. The transition state is in quasi-equilibrium with the reactants but not the products. 2. The particles involved follow Boltzmann's distribution and obey classical mechanics. 3. Once the reactants reach the minimum energy saddle point, the transition state does not collapse back to reactants. The simulations that have been made prove that barrier recrossing is possible: the activated complex would have enough energy to turn into products, but not all collisions with good energy will result in a successful reaction since the transition state is not in equilibrium with the reactants. Tunneling in low activation barrier systems is not accounted for either in the transition state theory, but it is difficult to predict its influence on the simulations made. Considering these factors, experimental rates should be usually slower than the ones predicted by theory. (Very good. Fjs113 (talk) 14:40, 28 May 2018 (BST))
EXERCISE 2: F - H - H system
PES inspection
Classify the F + H2 and H + HF reactions according to their energetics (endothermic or exothermic). How does this relate to the bond strength of the chemical species involved?
The F + H2 reaction is exothermic while the H + HF reaction is endothermic, since the H-F bond dissociation energy(565 kJ/mol) is higher compared to the H-H one(432 kJ/mol), meaning that HF has a stronger bond and is more stable.
(You should've used the program here, not just bond dissociation energies. Fjs113 (talk) 14:40, 28 May 2018 (BST))
Locate the approximate position of the transition state.
Following Hammond's postulate, the transition state will be closer in structure to the F+ H-H system rather than F-H + H system since it is higher in energy. Thus, by testing different F-H distances while the H-H distance is kept approximately at equilibrium, a stable transition state has been found at r(H-H) of 0.745 Å and r(F-H) of 1.8115 Å, and its total energy is -103.752 kcal/mol. Figure 5 indicates the stability of these coordinates.

Report the activation energy for both reactions.
For the F + H-H reaction, a MEP calculation has been made from r(F-H)=1.9 Å and r(H-H)=0.75 Å, and the final energy after 2500 has been determined to be -104.008 kcal/mol, which would lead to an activation energy in this direction of 0.256 kcal/mol.
In an analogue manner, a calculation was run from r(F-H)=1.8 Å and r(H-H)=0.8 Å, and the final energy after 25 seconds was -133.727 kcal/mol. The activation energy in this direction is then 29.975 kcal/mol.
In light of the fact that energy is conserved, discuss the mechanism of release of the reaction energy. How could this be confirmed experimentally?
The reaction is exothermic, so an excess of energy is produced. From the Animation result, it is quite obvious that the system contains more energy (No, the system contains the same amount of energy, since energy is conserved. Whilst I know what you mean, this can be misunderstood badly. Fjs113 (talk) 14:40, 28 May 2018 (BST))
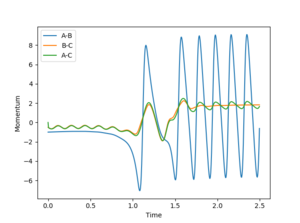
after the H-F molecule is formed, since it oscillates much quicker than the H-H molecule. Since this is quite a simple system and energy must be conserved, it is then obvious that the excess reaction energy is present in the system as vibrational energy. The momentum vs time plot in Figure 6 shows the H-H (B-C) and H-F (A-B) being quickly deformed at the transition state, after which the oscillating H-F momentum is large and constant while the H-H momentum is lost.
This gain of vibrational energy is also evident in the energy vs time plot in Figure 7, where this excess energy is interplayed between the kinetic and the potential terms periodically. Experimentally, this could be determined using calorimetry to determined the amount of heat energy lost to the environment due to vibrations or through IR spectroscopy, following the intensity of the H-F band over time.
(Good suggestion. Would've loved to see some more details. Fjs113 (talk) 14:40, 28 May 2018 (BST))

Reaction dynamics
Discuss how the distribution of energy between different modes (translation and vibration) affect the efficiency of the reaction, and how this is influenced by the position of the transition state.
Polanyi's empirical rules state that reaching a late transition state can be reached more efficiently by increasing the vibrational energy of the system rather than its translational energy, while the opposite applies for early transition state[2].
Since the F+ H-H is exothermic, it has an early transition state. Setting r(F-H)=2 Å and r(H-H)=0.74 Å, p(F-H)=-0.5 and p(H-H)=0.1, the reaction goes smoothly to products. This is the case for high translational energy and low vibrational energy and can be seen in Figure 8. When we alter p(H-H) to 2.4 or more, the system gains so much vibrational energy that the reaction goes back to reagents even though the translational energy was enough to cross the energy barrier. Figure 9 shows this case, and it proves the Polanyi assumptions about an early transition state correct.


For the H-F + H reaction, the situation should be reversed, since it has a late transition state. Setting r(F-H)=0.92 Å and r(H-H)=2.0 Å, a low p(H-F)=-0.1, no matter how high the absolute value of p(H-H) is chosen, the reaction won't take place. Figure 10 shows the case for p(H-H)=-5, a very high translational energy leading to no reaction. Now setting a very low p(H-H)=-0.1 and increasing the vibrational energy by setting p(H-F) up to -10, successful reaction trajectories can be obtained, one of them being shown in Figure 11. Thus, the Polanyi predictions for a late transition state have been confirmed as well.
