MRD:PhyPro
Molecular Reaction Dynamicsː Computational Lab
EXERCISE 1ː H + H2 system
On a potential energy surface diagram, how is the transition state mathematically defined? How can the transition state be identified, and how can it be distinguished from a local minimum of the potential energy surfaceʔ
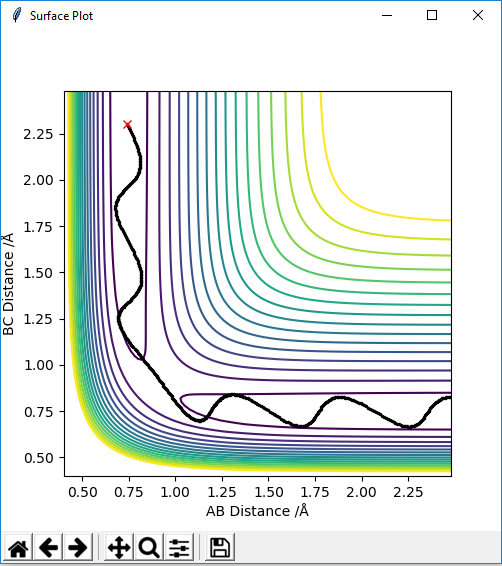
An analysis of the reaction of H with H2 is explored here. For this particular reaction to occur, H must approach the H2 molecule with sufficient momenta and energy for a new H-H bond to form following the breakage of the old H-H bond in the reactants. The contour diagram is shown below, from which the transition state of the reaction can be understood. The H-H bond length in the H2 molecule is 0.74Å, but the H---H---H bond lengths in the transition state was found to be ≈0.90Å at the position where the trajectory of the reaction becomes linear as it moves between the energy minima of the energy levels of the reactants and products. This is an indication that the reaction is concerted as the H-H bonds are longer at the transition state than the H2 internuclear equilibrium distance.
The plot below in the energy surface of the reaction scheme being studied. The transition state can be mathematically defined as the point where the following mathematical statement is trueː ∂V(r1)/∂r1 and ∂V(r2)/∂r2 is equal to zero.
It has been proven that the transition state is defined at the point where the partial second derivative of ∂V(q1)/∂q1 is greater than zero and is a minimum. This is seen in the contour diagram shown below; q1 is the coordinate moving through a high energy point to a low energy point to a high energy point, as shown below.
It has also been proven that the transition state is defined at the point where the partial second derivative of ∂V(q2)/∂q2 is less than zero and is a maximum. This is also seen in the contour diagram shown below; q2 is the coordinate moving through a low energy point to a high energy point to a high energy point, as shown below.
The contour diagram shown below essentially shows the reactant and product coordinates along with the saddle point.
Ng611 (talk) 16:39, 7 June 2019 (BST) Good.
Report your best estimate of the transition state position (rts) and explain your reasoning illustrating it with a “Internuclear Distances vs Time” plot for a relevant trajectory.
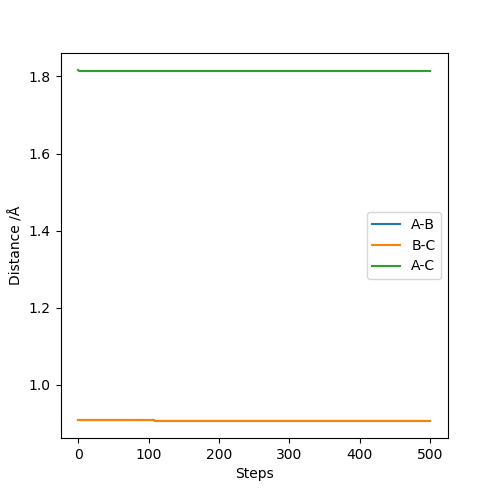
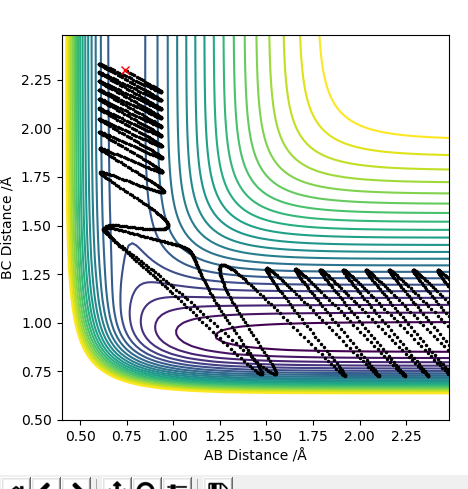
Following on from the points stated above, a better estimate of the transition state position has been determined by further exploring the contour plot, as shown below. The point X represents the position where the forces acting along the AB and BC coordinates are zero. This is the transition point and has the value of 0.907743Å.
A plot of the internuclear distance against time is shown below, and was used to prove the transition state position stated above. The graph shows the internuclear distances, and is a straight line to show the fact that zero oscillations are seen. Momenta is set to zero, so the molecule will oscillate only at the maximum point and not move down in energy.
Ng611 (talk) 16:39, 7 June 2019 (BST) Good.
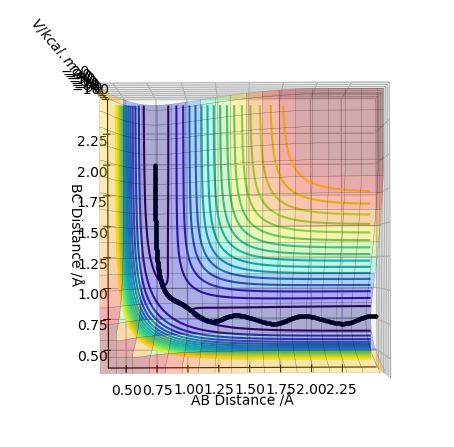
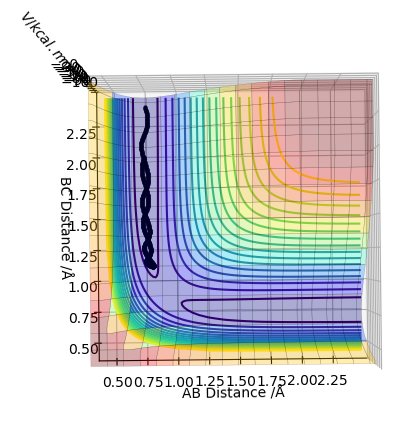
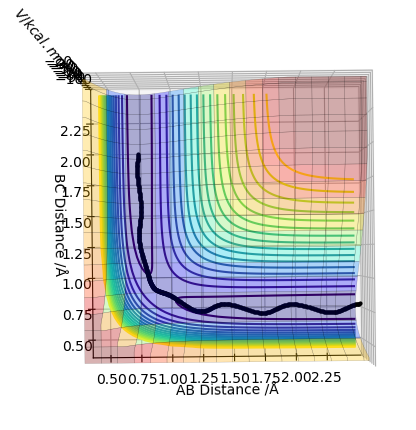
Comment on how the mep and the trajectory you just calculated differ.
This is the plot obtained by setting the calculation type to mep.
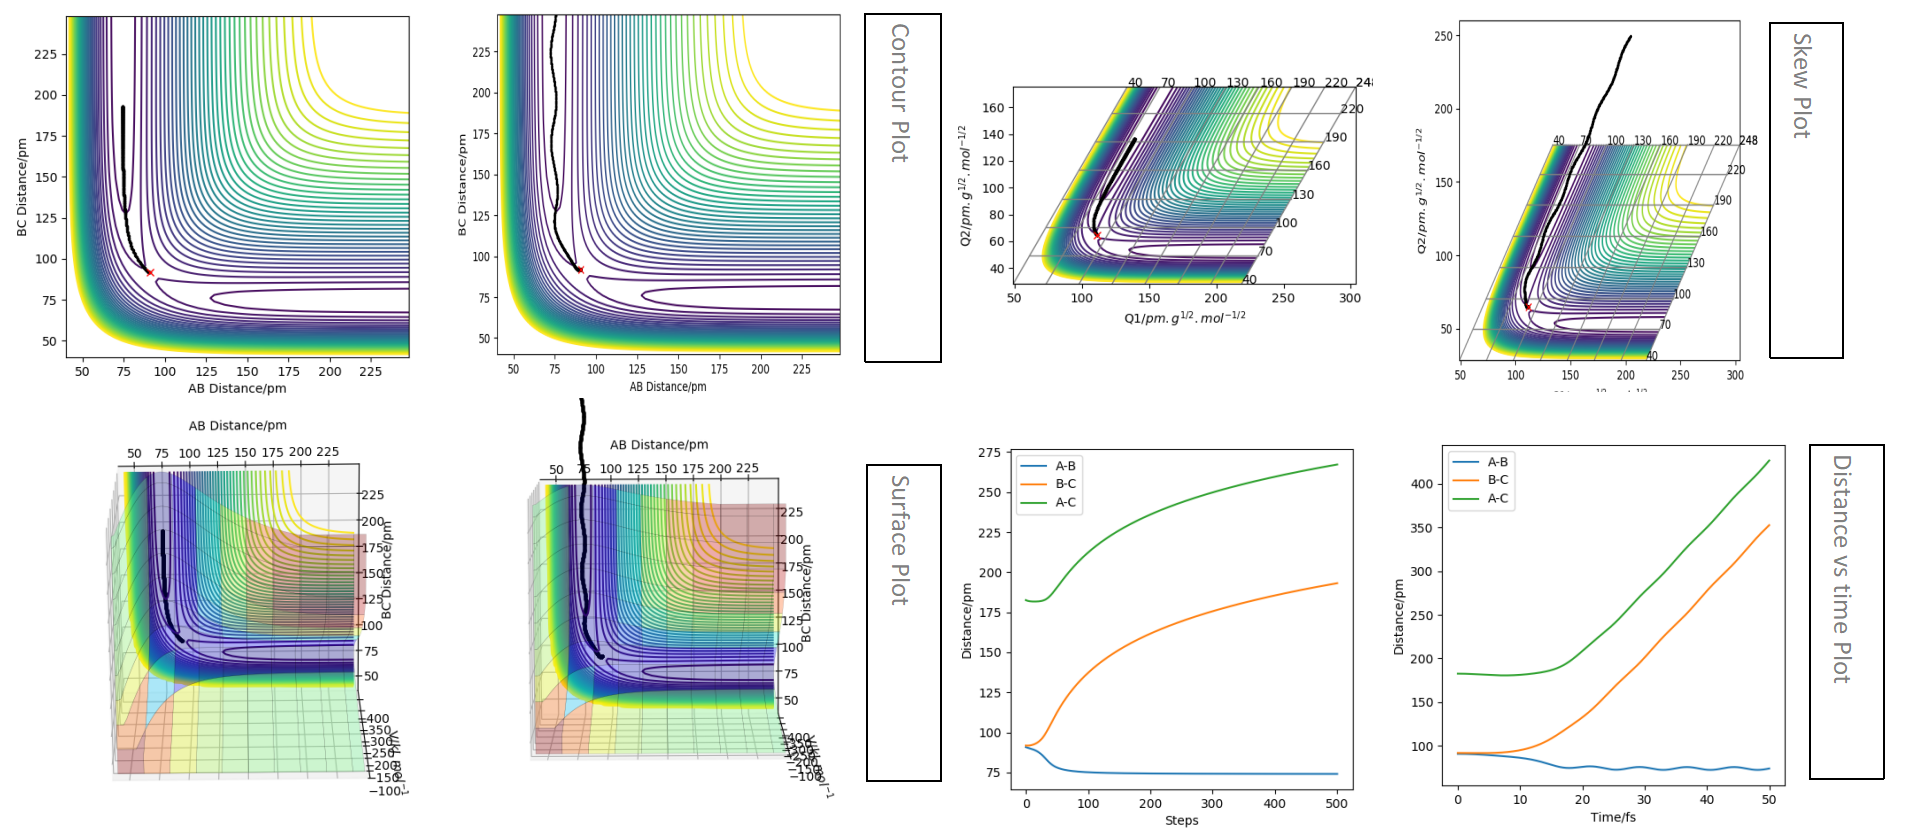
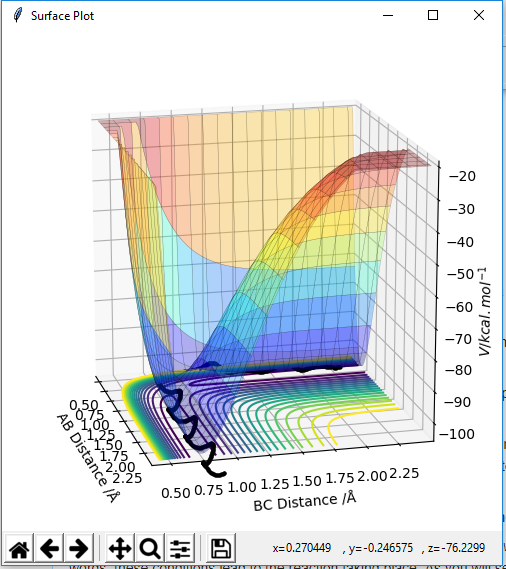
This is the plot obtained by setting the calculation type to dynamics.
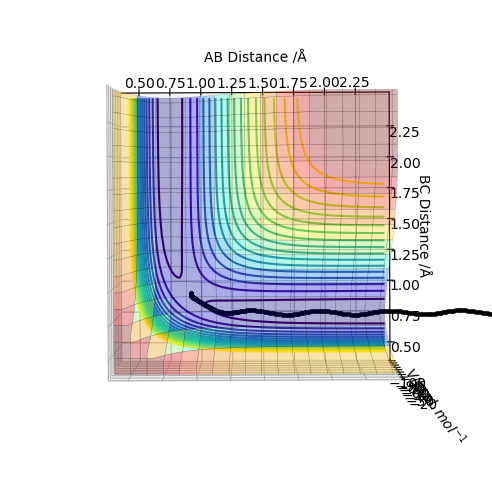
The trajectory for the dynamics pathway is longer than that for the mep pathway, and is also more wavey. This is because mep corresponds to the slowest motion possible of the species; this is not a plausible model as all atoms have a mass and so a corresponding momenta. The mep calculation neglects the oscillations of the species, leading to a straighter trajectory that neglects vibrational energy, of which is accounted for in the dynamics calculation. Also, a shorter trajectory is seen because of a reduced amount of momenta involved of the species involved.
Complete the table above by adding the total energy, whether the trajectory is reactive or unreactive, and provide a plot of the trajectory and a small description for what happens along the trajectory. What can you conclude from the table?
State what are the main assumptions of Transition State Theory. Given the results you have obtained, how will Transition State Theory predictions for reaction rate values compare with experimental valuesʔ
The main assumptions made for the transition state theory is that molecules must collide with enough energy at the correct orientation for a reaction to pass over and above the activation barrier and reach the transition state at which bonds between the reactants are broken and new bonds are formed between the products; this relies on the kinetic energy from the movement of the species through space and that the motion of the species involved behaves in a classical manner. A system may involve a heavier species, of which the motion can be ignored according to the Born-Oppenheimer approximation. Intermediates can also be formed if the system contains enough energy to pass over the lowest saddle on the potential energy surface. The transition state can be assumed to be the point where all of the reactants are present and at which old and new bonds are being formed in associative, dissociative or intermediary steps; various equations and laws can then be used to calculate the activation energy of involved in the system. Another assumption is that if the transition state has been successfully reached, the products formed at the transition state do not 'roll-back' into the reactants phase.
However, these assumptions fall short in real life situations. This can be due to the fact that atoms and molecules behave in a quantum mechanical manner when reacting. Some reactions can also be activated in a photochemical manner and so can proceed even if they do have enough energy to overcome the activation energy of the system in question. Another point to consider is that the transition state may not necessarily be the lowest saddle point at high temperatures, possibly indicating the fact that there are alternative pathways for the reaction to proceed.
Ng611 (talk) 16:42, 7 June 2019 (BST) A photochemical reaction involves absorption of a photon (so therefore involves an increase in reactant energy).
Following on from the points stated, it can be seen that for the first, second and third systems studied above, transition state theory matches the experimental values obtained as reactions do not occur if the system contains a lack of energy. However, system four and five do not follow the transition state theory stated, as the reactants reach the transition state, form products, but then cross back to reactants-this is not allowed in the transition state theory.
Ng611 (talk) 16:42, 7 June 2019 (BST) Good.
EXERCISE 2: F - H - H system
By inspecting the potential energy surfaces, classify the F + H2 and H + HF reactions according to their energetics (endothermic or exothermic). How does this relate to the bond strength of the chemical species involved? Locate the approximate position of the transition state.
The two reactions studied in this part of the lab was that ofː 1) H-H + F → H-F + H 2) H-F + H → H-H + F
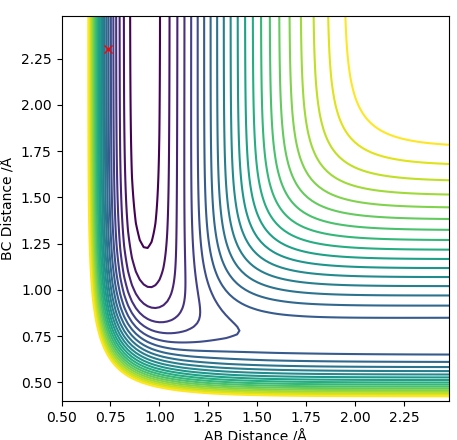
It can be seen in the Figure shown below that the reaction between the hydrogen molecule and an atom of F is an exothermic reaction as the products are lower in energy than the reactants in the energy profiles shown below, the reverse reaction is therefore endothermic. This statement can also be rationalised using the fact that the H-F bond of the products is stronger than that of the H-H bonds in the reactants due to the sheer difference in electronegativity of the H atom to the F atom. The H-F bond is essentially a strong ionic bond, whereas the H-H bond is a weaker covalent bond.
The dimensions used in the analysis for this part of the experiment for a reaction to occur are as followsː
H-H distanceː 0.74 Å H-F distanceː 2.30 Å Momentum Aː 0 kg⋅m/s Momentum Bː -11.5 kg⋅m/s
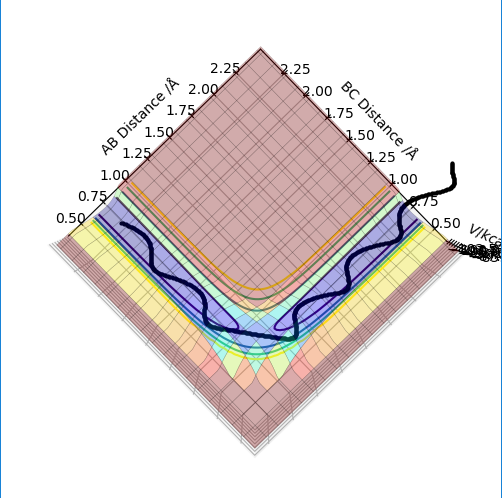
This is the surface plot of the reaction between H-H and F. This is an exothermic reaction as the energy state of the products is lower than that of the reactants, as seen above.
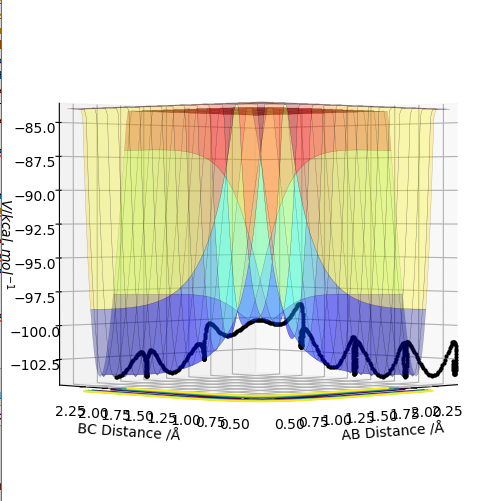
This is the surface plot of the reaction between H-F and H. This is an endothermic reaction as the energy state of the products is higher than that of the reactants.
The approximate position of the transition state can be determined by setting the momentum of the species to zero and varying the position of species so that the plot of distance against time produces a straight line whereby oscillations do not occur and so the products formed do not 'roll-back' into the reactants in exactly the same manner as above in Part 1. The exact dimensions to form the correct graph is as followsː
H-H distanceː 0.744873 Å H-F distanceː 1.81105 Å Momentum Aː 0 kg⋅m/s Momentum Bː 0 kg⋅m/s
With these initial conditions, the forces acting along the AB and BC coordinates are zero and a linear line on the distance against time graph is obtained. These values show the position of the transition state for reaction 1, and should be switched to find the transition state of reaction 2.
Report the activation energy for both reactions.
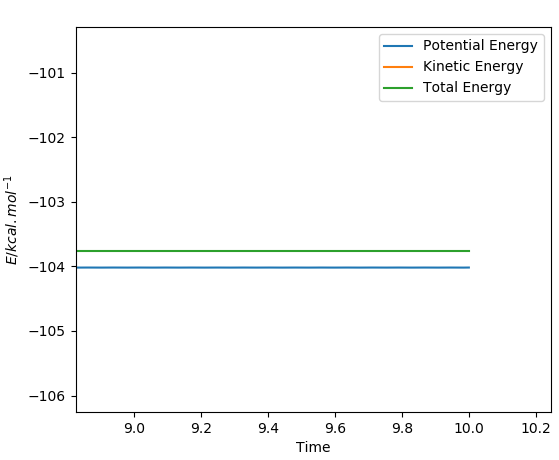
Similar to the methods described above, to calculate the activation energy of the two reactions, a dynamic calculation type is used - the results from this calculation are easier to analyse in comparison to the results obtained from an mep calculation. The distances have to be displaced relative to the transition state position. The activation energy was calculated as the difference in the levels of the total energy and the potential energy, as can be seen from the simple addition calculation that the total energy is equal to the potential energy plus the kinetic energy.
The forward reaction of H-H and F was determined as an exothermic reaction, and its activation energy was calculated asː
Total Energy - Potential Energyː -103.764 kcal/mol - (-104.018 kcal/mol) = 0.254 kcal/mol
This is a zoomed version of the energy against time plot of the H-H and F reaction.
The reverse reaction of H-F and H was determined as an endothermic reaction, and its activation energy was calculated asː
Total Energy - Potential Energyː -101.04 kcal/mol - (-133.973 kcal/mol) = 32.933 kcal/mol
This is a zoomed version of the energy against time plot of the H-F and H reaction.
In light of the fact that energy is conserved, discuss the mechanism of release of the reaction energy. Explain how this could be confirmed experimentally.
After having looked at the reaction animation, I have proven that the initial conditions for a reaction to occur in the forward, exothermic reaction was as followː
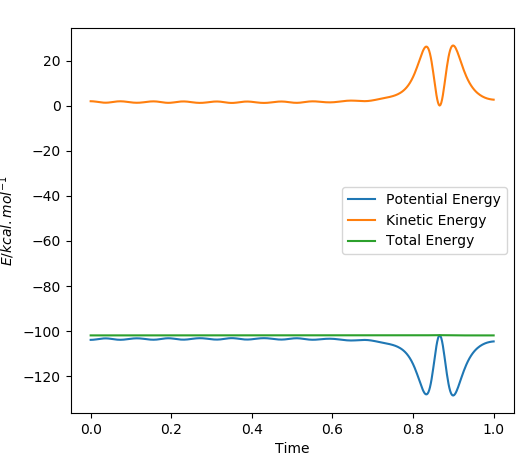
H-H distanceː 0.74 Å H-F distanceː 2.30 Å Momentum Aː -8.65 kg⋅m/s Momentum Bː -8.65 kg⋅m/s
The Figure below shows the energy against time plot of the reaction scheme of reaction 1. The two lines are a mirror image of each other; kinetic energy is required for the two reactants to collide with each other to overcome the activation energy barrier and reach the transition state of the reaction. At the start of the reaction the molecules only have potential energy, which is then converted to kinetic energy as the two reactants approach each other. The vibrational energy of the system increases as the products are formed. The H-H bond is then broken and a new H-F bond is formed. The increase in kinetic energy is due to the exothermicity of the reaction. The excess energy of the reaction system is converted to heat and is released into the surroundings. Therefore, calorimetry can be used to measure the heat released into the surroundings. IR can also be used to measure the vibrational energy of the product formed in the reaction.
Ng611 (talk) 16:43, 7 June 2019 (BST) You're right that IR needs to be used, but what features would you use to confirm vibrational excitation?
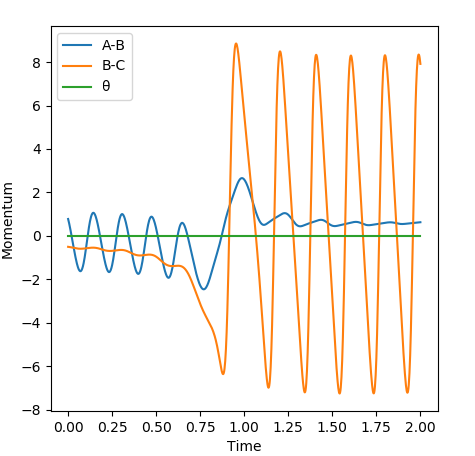
The increase in vibrational energy as the reaction proceeds is seen below, whereby the amplitude seen on the momenta against time plot increases as a H-F bond is formed in the products and the H-H bond is broken is the reactants. The products are vibrationally excited in comparison to the reactants, hence the increase in the amplitude of the oscillations.
Discuss how the distribution of energy between different modes (translation and vibration) affect the efficiency of the reaction, and how this is influenced by the position of the transition state.
The first reaction scheme shows an exothermic reaction between H-H and F; the system has an early transition state and resembles the reactants. It was seen here that the translational energy of the system was pivotal for the progression of the reaction, and less so for vibrational energy, in accordance with Polanyi's rule. On the other hand, for an endothermic reaction, vibrational energy is required to overcome the activation energy barrier.
It can be proven that H-H momentum corresponds to translational energy and H-F momentum corresponds to vibrational energy.
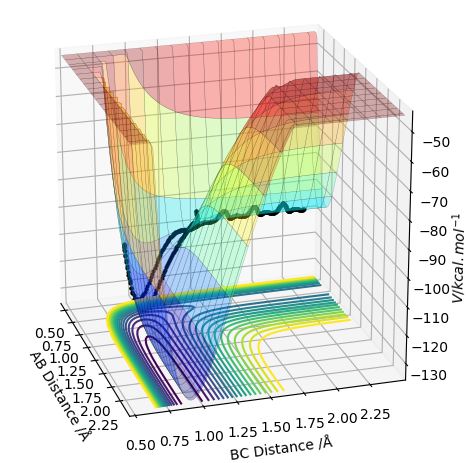
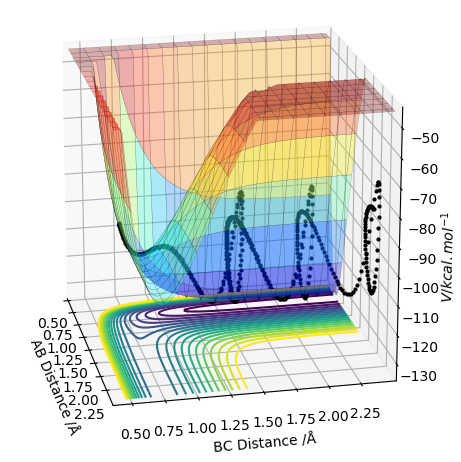
In accordance with the Polanyi rules1, the two Figures shown below represent the graphical versions of this rule and show that when the system has a high translational energy and low vibrational energy the reaction did not proceed, but when the system has a high vibrational energy and low translational energy, the reaction reaches completion.
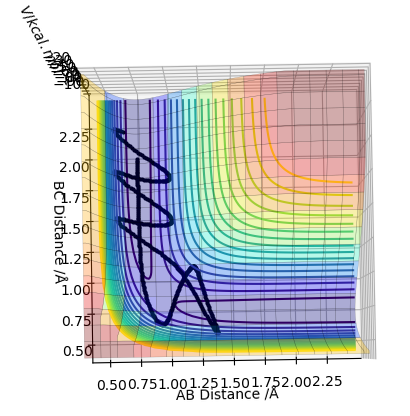
A system with a high translational energy and low vibrational energy that did not proceed. This was proven from the animation of the reaction; the bond between the reactants broke as H-H approached F, but a H-F bond was not formed due to a lack of vibrational energy involved in the system.
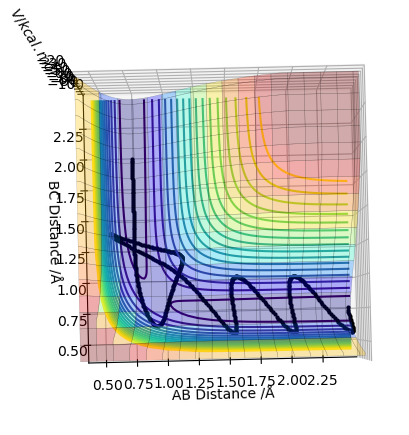
A system with a low translational energy and high vibrational energy that did proceed and reach completion.
Ng611 (talk) 16:45, 7 June 2019 (BST) This is for an F+H2 reaction, nor an H+HF reaction.
REFEREMCES
1) Shintaro Furuya; Polanyi’s Physical Adsorption: One of the Early Theories of Quantum Chemistry; Tokyo Institute of Technology, Japan; 2015

