MRD:Philaphon Sayavong
Molecular Reaction Dynamics
What value does the total gradient of the potential energy surface have at a minimum and at a transition structure? Briefly explain how minima and transition structures can be distinguished using the curvature of the potential energy surface.
At the minimum and at the transition state in the potential energy surface, the total gradient has a value of zero, as both of the points are at the turning points of the PES . The minimum and the transition state can be distinguished as the transition state is the saddle point of the plot. As a result, the minimum point has to satisfy the following criterion:
This is so in all of the direction in the reaction coordinate.
Whereas for the transition state, the second derivative of the PES has a different sign at different directions in the reaction coordinate (in this case it is in the rab and rbc).
Report your best estimate of the transition state position (rts) and explain your reasoning illustrating it with a “Internuclear Distances vs Time” screenshot for a relevant trajectory.
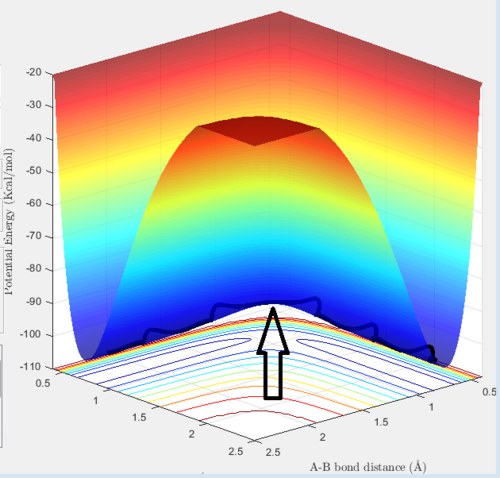
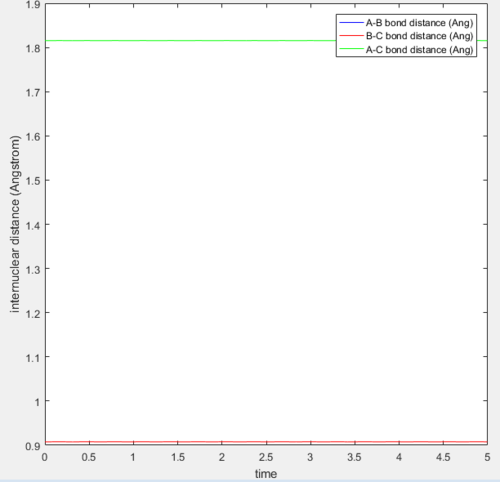
The transition state position (rts) is when the internuclear distance between the hydrogens are the same. This can be initially estimated from the PES as shown in figure 1. From there, a better approximation of the transition state position can be obtained by a trial solution method using the Internuclear distance - time plot. When the hydrogen atoms are placed at exactly this position with zero momenta, it will stay here with respect to time. This can be explained as follows. At the transition state, the change in the potential energy of the system is zero , hence the resultant force on the hydrogens is zero. Therefore, the displacements of the hydrogens at this position (with zero momenta) would be constant. Hence as the displacements is the same over time, the vibrational energy of the system is zero. For this system, the transition state position is at the internuclear distance of roughly 0.9077 Å, as this can seen that the distance is constant over time (see figure 2).


Comment on how the mep and the trajectory you just calculated differ.
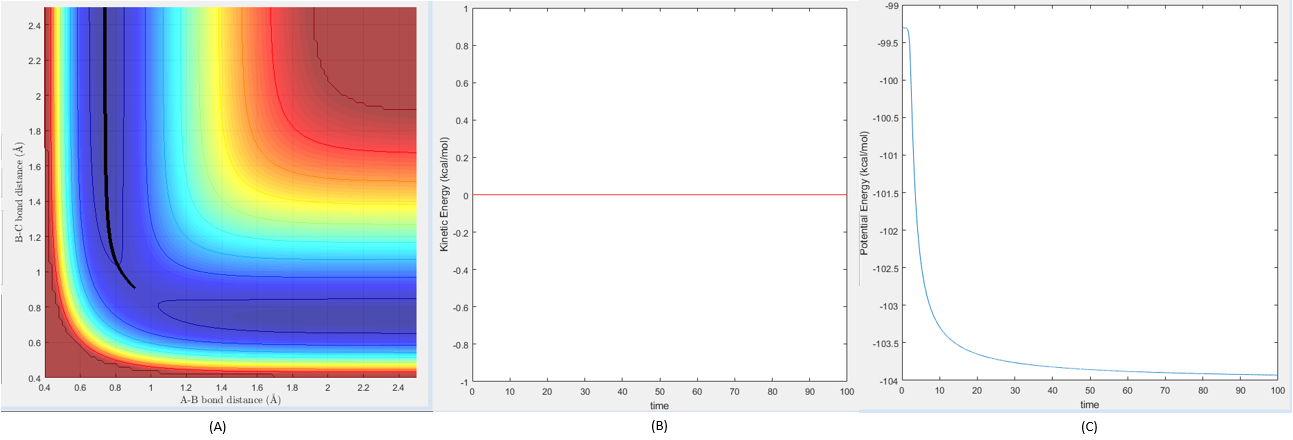
As can be seen in figure 3, the MEP for the trajectory consists of no molecular vibrations at all, as this is the minimum energy pathway that the trajectory can take theoretically (hence the name MEP). As this is the case, it can be seen that the kinetic energy of the system is zero throughout the trajectory, whereas the potential energy of the system decreases smoothly and reaches a minimum (see figure 3 (A) and (B)).

As for the Dynamics method, it can be seen that the trajectory has molecular vibrations throughout the trajectory as seen in figure 4 (A). Also, the kinetic energy of the system is not zero. It started of at zero and rises exponentially and oscillates at the mean value of roughly 4.6 kcal/mol (see figure 4 (B)). The potential energy of the system decreases exponentially and oscillates at the mean average value of around -104 kcal/mol. This similar to the minimum potential energy of the MEP system. This oscillations of the kinetic and the potential energy is due to the molecular vibrations, which the MEP lacks.

