
MRD:OliviaPini
Exercise 1
Question 1 = What value do the different components of the gradient of the potential energy surface have at a minimum and at a transition structure? Briefly explain how minima and transition structures can be distinguished using the curvature of the potential energy surface.
At a minimum the gradient of the potential energy surface is zero. At a transition state, as it is a maximum on the minimum energy path, it also has a differential of 0. However, the second differential of the transition state (maximum) is negative, whereas that of the minimum would be positive and so the curvature of the potential energy surface can be used to distinguish them. This potential energy surface below clearly shows the maximum of the minimum and so the position of the transition state.
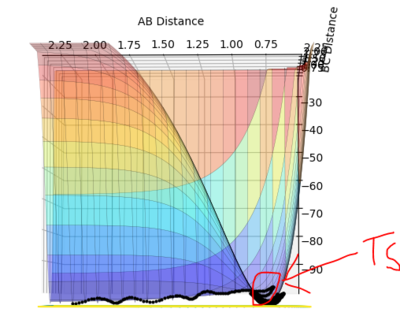
Fig. 1 - Potential energy surface of H + H2 with the transition state illustrated.
(The correct mathematical term is derivative, not differential. The TS is not a maximum! It's a saddle point, which means that it is a maximum in one direction and a minimum in another direction orthogonal to the first. Brownie points for the rather obscure drawing. In that perspective, the TS is actually covered up by the reaction path. Fjs113 (talk) 22:15, 17 May 2018 (BST))
Question 2 = Report your best estimate of the transition state position (rts) and explain your reasoning illustrating it with a “Internuclear Distances vs Time” plot for a relevant trajectory.
The best estimate for the transition state position to 2 d.p. is 0.91 Å for both AB and BC distance. This is because at 0.91 Å on the contour plot featured below the trajectory can no longer be seen as just a cross is present.This is expected at the transition state as this is a stationary point with gradient 0 and so if the reaction is started here with momentum 0 it will stay here forever. However, if an infinitesimally small change is made to the geometry then the reaction will fall into the products or reactants.
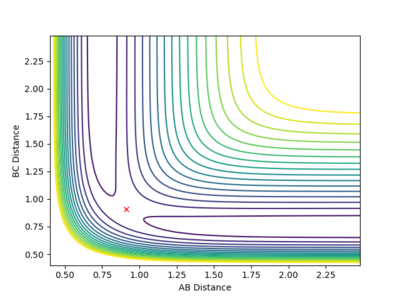
Fig.2 - Contour plot showing that at 0.91 Å the transition state is present as the trajectory is no longer seen.
This is supported by the inter-nuclear distance vs. time plot, which shows that AB and BC distances are the same, which is known to be a condition that must be fulfilled for a transition state to be present.

Fig. 3 - Internuclear distance vs time plot showing AB and BC distances to be the same, showing the transition state must be present.
(Ideally, at the TS this plot should not display any oscillations whatsoever. This can only be achieved by going to 3 decimal places. Fjs113 (talk) 22:15, 17 May 2018 (BST))
Question 3 = Comment on how the mep and the trajectory you just calculated differ.
Both show that if an infinitesimally small change is made to the geometry in the direction of the products, then the trajectory will fall into the product section of the potential energy surface. The main differences between these two graphs are due to velocity. In the MEP graph the velocity at each time step is zero and so the line is shown to stop as soon as it reaches an energy minimum after the transition state. Whereas in the dynamic graph where velocity varies, the trajectory is shown to continue on to infinity.
(This is unfortunately not correct. How far the trajectory (MEP or Dynamics) goes is solely depending on the number of steps calculated by the simulation. Zooming out on the dynamics trajectory would show you that it also ends somewhere. Likewise, increasing the steps would cause the MEP to continue further. Fjs113 (talk) 22:15, 17 May 2018 (BST))

Fig. 4 - MEP potential energy surface, illustrating the trajectory to stop at an energy minimum

Fig. 5 - Dynamic potential energy surface, illustrating the trajectory to carry on to infinity.
Question 4 = Complete the table by adding a column with the total energy, and another column reporting if the trajectory is reactive or unreactive. For each set of initial conditions, provide a plot of the trajectory and a small description for what happens along the trajectory.
| p1 | p2 | Total Energy | Reactive/Unreactive | Contour Plot | Reasoning |
|---|---|---|---|---|---|
| -1.25 kgm/s | -2.5 kgm/s | -99.01 Kcal/mol | Reactive |  |
From this contour plot it is known that the reaction is reactive as the blue trajectory line continues onto the product section of the plot after the transition state. |
| -1.5 kgm/s | -2.0 kgm/s | -100.46 Kcal/mol | Unreactive |  |
From this contour plot it is known that the reaction is unreactive as the blue trajectory line bounces off from the transition state and goes back into the reactants. |
| -1.5 kgm/s | -2.5 kgm/s | -98.96 Kcal/mol | Reactive |  |
From this contour plot it is known that the reaction is reactive as the blue trajectory line continues onto the product section of the plot after the transition state. |
| -2.5 kgm/s | -5.0 kgm/s | -84.96 Kcal/mol | Unreactive |  |
From this contour plot it is known that the reaction is unreactive as the blue trajectory line bounces off from the transition state and goes back into the reactants. (This is not the whole story though... For a short period, the products are formed but then barrier is recrossed. Fjs113 (talk) 22:15, 17 May 2018 (BST)) |
| -2.5 kgm/s | -5.2 kgm/s | -83.42 Kcal/mol | Reactive |  |
From this contour plot it is known that the reaction is reactive as the blue trajectory line continues onto the product section of the plot after the transition state. |
Question 5 = State what are the main assumptions of Transition State Theory. Given the results you have obtained, how will Transition State Theory predictions for reaction rate values compare with experimental values?
The assumptions of the Transition State Theory are:
1) Molecular systems that have gone over the transition state towards the products cannot go back to reform the reactants.
2) In the transition state, motion along the reaction coordinate can be separated from all other motion and treated classically as translation.
3) In the absence of equilibrium between reactants and products, the transition states becoming products are distributed among their states according to the Maxwell-Boltzmann laws.
4) The electronic and nuclear motions are separated (Born-Oppenheimer).
5) Reactant molecules are distributed among their states in accordance with Maxwell-Boltzmann distribution.
The first assumption does not match the results obtained here as in the unreactive reactions featured above the reactants reach the transition state but then are unable to turn into products and so go back to being reactants. Also the second approximation does not fit the data and graphs here, as vibrations also cause oscillations which affect the reaction trajectory and these cannot be treated quantum mechanically as they appear as quantized levels. Additionally, even if not shown here, Transition State Theory doesn't consider the fact that there is the possibility for particles to quantum tunnel through any barrier of finite energy, meaning some molecules will react even if they don't collide with enough energy to over come the transition state and activation energy. This all means that Transition State Theory will underestimate reaction rate values. (1)
(Not quite - tunnelling is noticable at very specific conditions. TST will usually overestimate the reaction rate as it does not account for barrier recrossing, see assumption 1). Fjs113 (talk) 22:15, 17 May 2018 (BST))
Exercise 2
Question 6 = Classify the F + H2 and H + HF reactions according to their energetics (endothermic or exothermic). How does this relate to the bond strength of the chemical species involved?.
F+H2 is an exothermic reaction, as the products are lower in energy then the reactants. The reaction also takes place and this all means that more energy is given out as the H-F bond forms then is needed to break the H-H bond.

Fig. 6 - Potential energy surface plot for H2 + F.
Whereas, H + HF is an endothermic reaction, as the product energy is higher then the reactant energy. Also, the reaction doesn't occur, meaning under these conditions the energy given out as the H2 bond forms isn't enough to compensate for the energy needed to break the HF bond.
(Would've been good if you could relate your answer above to the picture. Which is the product channel and which the reactant channel? Talk about the drop in potential energy. Fjs113 (talk) 22:15, 17 May 2018 (BST))

Fig. 7 - Potential energy surface plot for HF + F
Overall this shows that the HF bond is stronger then then the H2 as it takes more energy to break and releases more energy as it forms.
Question 7 = Locate the approximate position of the transition state.
The approximate position of the transition state is at HF distance = 1.810 Å and HH distance = 0.746 Å, as at these bond lengths the trajectory has again disappeared. As stated above, this is expected for the transition state because it is a stationary point with gradient 0 that will remain forever unless an infinitesimally small change is made to the geometry to favor the reactants or products.

Fig. 8 - Potential energy surface plot illustrating a transition state as reaction trajectory is not visible.
(Yes, but simply stating bare values does not show understanding. You need to show your working, even if it was just an educated guess! Fjs113 (talk) 22:15, 17 May 2018 (BST))
Question 8 = Report the activation energy for both reactions.
For the reaction of HF + H the energy of the transition state is -104.664 Kcal/mol and for the reactants is -132.841 kcal/mol. This was worked out from the graph below where the initial potential energy value is the energy of the transition state, whereas the final potential energy value on the plateu relates to the energy of the reactants. The difference between these values then gives an activation energy of 28.177 Kcal/mol.

Fig. 9 - Energy vs time plot for HF + H to show difference between TS and reactant energy.
For the reaction of F + H2 the energy of the transition state is -103.001 Kcal/mol and that for the reactants is -103.744, obtained using the graph below in the same way as above. This gives a difference and so activation energy 0.773 Kcal/mol. This also matches the literature value of 0.74 Kcal/mol for the barrier height of this reaction.(2)

Fig. 10 - Energy vs time plot for F + H2 to show difference between TS and reactant energy.
Question 9 = In light of the fact that energy is conserved, discuss the mechanism of release of the reaction energy. How could this be confirmed experimentally?
When the F atom approaches the H2 it has potential not kinetic energy as it is only a single atom and so cannot vibrate. However, when it bonds to the hydrogen atom there is now also kinetic energy in the form of vibrations and as energy is conserved it means some of the potential energy must become kinetic energy. This is seen in the inter-nuclear momentum vs time graph where the blue line representing the F atom is originally straight, illustrating purely potential energy but once it bonds to hydrogen it begins to show oscialltions, illustrating the conversion to kinetic energy as the bond vibrates. The opposite effect is seen for the BC bond (orange line) but on a much smaller scale, which starts with oscillations meaning it has some kinetic energy due to bond vibrations and ends having only potential energy, as the line platues off. This is because at first you have the H 2 bond which is capable of vibrations but it then breaks and becomes a single H atom which can't vibrate and so energy is converted into purely a potential energy form. (It's not just potential energy. Non-zero momentum still means it has kinetic energy. Fjs113 (talk) 22:15, 17 May 2018 (BST))
This can be confirmed experimentally carrying out reactions like calorimetry, as an increase in vibrations and so kinetic energy will lead to more heat being released.

Fig. 11 - Internuclear momentum vs time plot for F + H2, illustrating conversion of translational to vibrational energy.
This idea is supported by the contour plot shown below, as it starts with very little oscillation, illustrating that the total energy of the system is mostly potential energy as the single F atom approaches the slightly vibrating H2 molecule. However, then the oscillations become much larger as the reaction progresses, showing most energy has been converted into kinetic energy due to the much larger vibrations of the HF bond.

Fig. 12 - Contour plot for F + H2, illustrating conversion of translational to vibrational energy.
Question 10 = Discuss how the distribution of energy between different modes (translation and vibration) affect the efficiency of the reaction, and how this is influenced by the position of the transition state.
The Polanyi rules state that vibrational energy is the more efficient kinetic energy mode in promoting a late-transition state than translational energy. (3)
For the H2 + F reaction the transtion state is very early and so will have a structure similar to that of the reactants. This means it should not be promoted by an increase in vibrational energy of the H2 bond. Whereas the reverse reaction (HF + F), occurs via a late transition state which will have a structure resembling that of that products. In this case an increase in the vibrational energy should in fact promote the reaction.
This is supported by the fact that if both the forward and reverse reactions are given the same very small translational energy (AB momentum = -0.5 Kgm/s) it takes the forward reaction with an early transition state a vibrational (BC) momentum of -5.5 Kgm/s, whereas it takes the reverse reaction, with a late transition state only -2.9 kgm/s. This demonstrates that the late transition state is promoted more by vibrational energy then the early transition state.

Fig. 13 - Contour plot for F + H2, illustrating reaction occurs at -5.5 Kgm/s.

Fig. 14 - Contour plot for HF + H, illustrating reaction occurs at -2.9 Kgm/s.
It can also be proven that translational energy is more efficient in promoting an early transition state then a late transition state. When both the reactions are given a fixed vibrational (BC) momentum of -1.0 kgm/s, it takes the forward reaction a translational momentum (AB) of -7.7 kgm/s to occur. Whereas, the reverse reaction, with a late transition state still did not appear to go with a translational momentum up to -10kgm/s. This shows translational energy does promote an early transition state more then a late one.
(These are astronomical values to be inputting! At such high momenta and velocities, the reaction depends on different things. These effects can usually be seen best using values of up to 2 for the momenta. Fjs113 (talk) 22:15, 17 May 2018 (BST))

Fig. 15 - Contour plot for F + H2, illustrating reaction occurs at -7.7 Kgm/s.

Fig. 16 - Contour plot for HF + H, illustrating reaction does not occur up to -10 Kgm/s.
References
1) J. I. Steinfeld, J.S. Francisco, William I. Hase, Chemical Kinetics and Dynamics, Pearson, England, 1998.
2) D. G. Truhlar, B.C. Garret, N. C. Blais, The Journal of Chemical Physics, 1984, 80, 232.
3) Z. Zhang, Y. Zhou, D. H. Zhang, J. Phys. Chem. Lett., 2012, 23, 3416-3419.