MRD:OPB16
Second Year Computational Lab: Molecular Reaction Dynamics
Introduction
introduce using r_1 and r_2 - and use vectors force relation with potential all simulations are using a collision angle on 180 (deg)
All systems in this report are triatomic and involve the collision between an atom and a diatomic molecule at a collision angle of π radians. Successful collisions take the general form:
A + B-C → A-B + C
For a reaction to be successful, it has to overcome the activation energy. If this energy is not met or exceeded, the reaction is unsuccessful leaving BC as the diatomic molecule. The activation energy is the energy required to form the transition state (TS):
[A--B--C]‡
(Nice little introduction! Fjs113 (talk) 17:00, 28 May 2018 (BST))
The TS occurs at the maximum of the minimum energy path of the reaction and is a stationary point. This path also has two other stationary points which are minima. These represent the reactants and the products. The reactant minima is when the B-C bond length is at equilibrium and the distance between A and B is large. The product minima occurs for the opposite this.
The TS is at the saddle point on the potential surface
To determine between minima and the saddle point (TS), a Hessian Matrix for the potential surface, V(r1,r2) is developed:
- .
Let D(x,y) be determinant of the Hessian Matrix:
A stationary point on the surface occurs at point (a,b) when fr1(a,b) and Vr2(a,b) = 0. The type of stationary point is found using the rules below:
- If and then is a local minimum of V.
- If and then is a local maximum of V.
- If then is a saddle point of V.
If the determinant at (a,b) is equal to zero, then the nature of the stationary point is unknown.
H + H2 system
This system follows the reaction:
H + H2 → H2 + H
Transition State Determination
For the TS determination, the momentum of atom pair is set to zero and the outer hydrogens are set to be equidistant from the central one (r1 = r2).
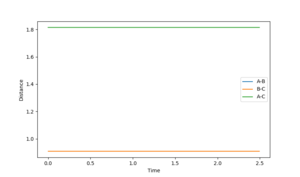
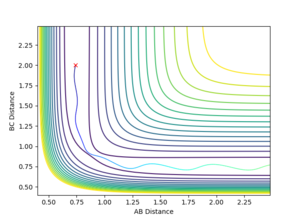
For large distance values, a Lennard-Jones like potential can be seen on the contour plot (Shown in figure 1). The minima of this curve is along the reaction pathway and is the TS. As the three atom system oscillates along the curve the distance between the atoms is shortened till it no longer oscillates, and the TS if formed. This occurs at an atom separation of 0.90774 Å. Due to the symmetry of the TS, it is located at (0.90774,0.90774) along the r1 and r2 axis (Shown in Figure 2).
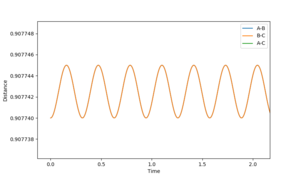
Once the separations were close to this value, the 'Internuclear Distances vs. Time' graphs generated from the simulation shown by Figure 3 were zoomed in and the oscillation more closely observed. If from time = 0, the distance increases, the separation value is too small, and the opposite is true for separation values too large. As can be seen by Figure 4, the value I have stated is too small, but looking at the vertical-axis of the graph the oscillation occurs over a 5*106 Å range which is incredibly small. To get a more accurate value for the position is redundant, if the value was change to being in the centre of the oscillation region, an insensible number of decimal places would have to be used to report the figure. As well, as this, further enhancement of the plot would show that there is still an oscillation.
The upper line on these two figures is the position of the third H atom so is equal to two times the TS H--H 'bond' length.
(Very good work. Fjs113 (talk) 17:00, 28 May 2018 (BST))
Minimum Energy Path
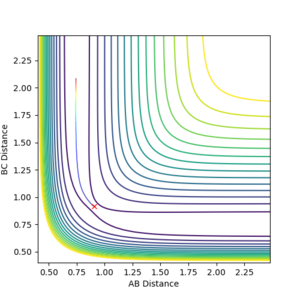
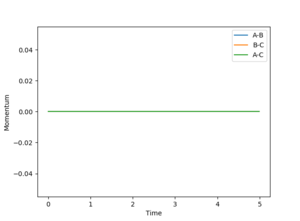
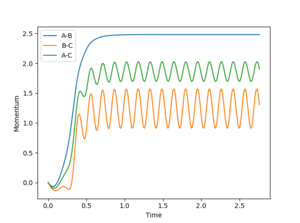
The reaction pathway was calculated by offsetting one of the H-H separations by 0.1 Å from the transition state, allowing the reactants to 'roll' down to the valley floor towards the products. Since the minimum energy path (MEP) corresponds to infinitely slow motion, no oscillation occurs in the H-H bond of the product, thus the reaction path seen in Figure 5 is a straight line along the valley floor. If instead the distance between the opposite pair of neighboring hydrogens is increased by 0.1 Å, then the reaction is driven towards opposite side of the potential energy surface. Figures 6 and 7 illustrate the difference in Intermolecular momenta vs Time for the two simulations as there is no oscillation in the H-H product bond for the minimum energy path.
 |
 |
 |
Trajectories
The following trajectories were test using r1 and r2 values of 0.74 and 2.0 respectively:
| p1 | p2 | Total Energy | Trajectory |
|---|---|---|---|
| -1.25 | -2.5 | -99.018 | Reactive |
| -1.5 | -2.0 | -100.456 | Unreactive |
| -1.5 | -2.5 | -98.956 | Reactive |
| -2.5 | -5.0 | -84.956 | Unreactive |
| -2.5 | -5.2 | -83.416 | Reactive |
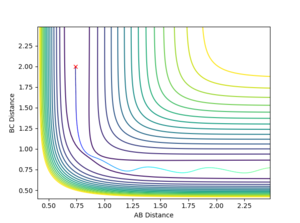
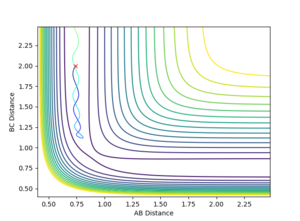
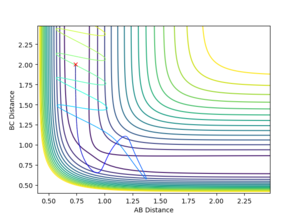
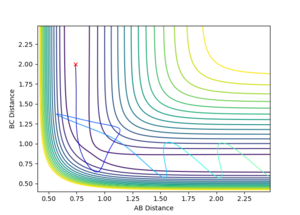
For this reaction, A-B is the initial H2 molecule and C is the free hydrogen. The first reaction is successful as indicated by the increased distance between A and B and the slight oscillation of bond length for B-C once the trajectory has surpassed the transition state. The increased oscillation of the bond is from the vibrational energy gained by the molecule. In the second reaction, the trajectory fails to overcome the activation energy of the TS and is instead reflected back along the potential well. The third trajectory is similar to the first as the collision is successful as the trajectory passes over the transition state. One difference between the first and third trajectories is that the third has more initial vibrational energy in the B-C bond as evidenced by the larger B-C separation fluctuation before reaching the saddle point. The fourth reaction shows the trajectory crossing the TS, however due to the high vibrational energy, the trajectory strongly oscillates along the "walls" of the potential ridge till passes back through the TS, into the initial state but with larger vibrational energy in the B-C bond. In the final reaction, the trajectory surpasses the transition state, crosses back over the TS as in the previous trajectory, but then crosses the TS again leading to a successful reaction.
The table also shows that there is no general trend between energy and the success of the reaction. This is because there are different types of energies in the system that each effect the trajectory differently. This can be seen in the case of reactions 4 and 5 where the large amount of vibrational energy leads to the trajectory passing over the TS multiple times.
(Well done. Fjs113 (talk) 17:00, 28 May 2018 (BST))
Limitations of Transition State Theory
Transition state theory (TST) is the idea that the border between the initial and final states of a reaction is given a transition state which occurs at a potential energy maximum along the reaction path and must be energetically overcome for the reaction to proceed. The following assumptions are made: [1]
- The atomic nuclei behave classically
- If a product crosses the TS with velocity towards the final state, it will not cross the border again
- Only one reaction path - via lowest energy saddle point
The first assumption ignores possible quantum effects. These effects are important when simulating systems with low activation energies and low particle masses as there is increased chance of tunnelling through the energy barrier, meaning a lower energy than assumed is required for the trajectory to cross the TS. The affect of these properties on the transmission coefficient for a particle tunnelling through a barrier of energy U(x) is given by:
This would result in a higher rate being given based on TST than for experimental values. The second point was violated in the last two examples where the trajectory crossed the TS multiple times. Since this is not expected for TST, the experimental rate will be lower than predicted. The third point means that no other alternate reaction pathways are allowed, only the one that follows the minimum energy path. Since quantum effects are only likely to occur for very small mass systems, overall, the experimental rate constant for a given reaction will be larger than the value calculated according to TST.
F--H--H System
The are two possible reactions in this system:
F + H2 → HF + H (Reaction 1)
H + HF → H2 + F (Reaction 2)
The H-F bond strength is much stronger than that of H-H, and are reported in literature as 569.7 and 435.7 kJ mol-1 respectively.[2] Because of this, more energy will be required for a successful Reaction 2. These values show that 1 is exothermic and Reaction 2 is endothermic. Even though Reaction 1 will release energy, an activation energy will still be required to reach the [F--H--H]‡ TS.
(Would've been good if you explained this using the contour plot from the program rather than just using bond energies. Fjs113 (talk) 17:00, 28 May 2018 (BST))
Determination of the Transition State
As similar method was employed as before for locating the TS where the momentum of each component was set to zero. In this case however, r1 and r2 are not equal, and due to the larger interaction between H-F as opposed to H-H, the distance between H-F will be larger in the TS than between the two hydrogen atoms. As before, the atom separations were altered till the potential of the system oscillated about a certain point. The bond separations were then further altered till this oscillation was infinitesimally small and the TS was left. This gave the coordinates of the TS as (1.81074, 0.74488) along the F-H and H-H axis respectively and can be seen in Figure 13.
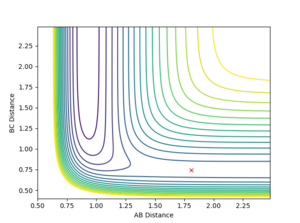 |
Hammond's postulate states that the structure of the TS will most closely resemble the species in the reaction which is closest in free energy to it. This means that for an exothermic reaction (like reaction 1) the TS most closely resembles the reactants in structure, and that for endothermic reactions (reaction 2) the TS is closest to the products. Since this TS is non-symmetrical, the TS no longer occurs equidistant from the reactant and product minima. This results in early and late transition states, where an early TS is when the TS is closer to the initial state than the final state. From Hammond's postulate we can say that exothermic reactions will have an early TS, and endothermic reactions will have a late TS. Figure 13 shows that the TS lies closer to the higher in energy F + H2 side.
Activation Energies
The activation energy is found using the same method as used for calculating the MEP in the three hydrogen atom system. However, larger deviations of atom separations from the TS had to be used to make sure that the reaction occurred (± 0.05 Å). The activation energy of the reaction is not equal to the H-H bond enthalpy since this a concerted reaction and not an 'SN1 - like' reaction. [3] The activation is calculated from the Energy vs. Time plot where the change in potential for the reaction to take place is easily observed (shown in Figure 14). These were worked out to be 0.36 and 29.75 kcal mol-1 for reaction 1 and 2 respectively.
 |
Reaction Dynamics
As the total energy of the system is conserved, when the reactants pass over the TS in reaction 1, the loss of potential energy is converted in both vibrational and translational kinetic energy. The gain in translational kinetic energy effects the motion of the products whilst the vibrational kinetic energy increases the oscillation of the diatomic molecule bond in the product. As the kinetic energy of the system increases, the heat and thus the temperature of the system will increase:
- (For Three Dimensions)
Because of this, the reaction can be measured experimentally using calorimetry.
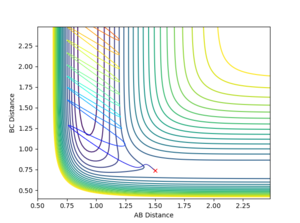
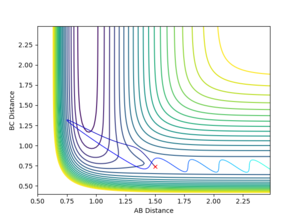
For reaction 1, a set of high kinetic energy trajectories with rHH = 0.74, rFH = 1.5, pFH = -0.5 and a range of pHH of [-3,3]. Figure 11 shows the trajectory for the reactant H2 with a momentum of 0. Here the reaction is successful and once the trajectory has passed the TS, due to the large potential energy drop discussed earlier, very strong oscillation of the newly formed F-H bond can be seen. The reaction remains successful until the magnitude of the initial HH momentum reaches 1.4. At this point the vibrational energy of the initial bond is very large, this translates to the vibrational energy of the product bond, causing for the trajectory to pass back over the TS yielding the reaction unsuccessful. An example of this is shown in Figure 12'.
The system has enough total energy to overcome the potential barrier of the TS but is unsuccessful. These results confirm that the increasing of kinetic vibrational energy hinders the prospects of a succesful collision for this reaction and that kinetic translational energy is of more importance. These results confirm that increasing the vibrational energy present in the system does not correlate an increased probability of reaction.
 |
 |
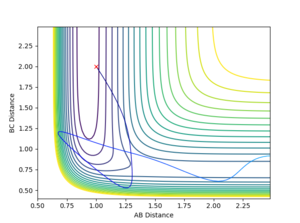
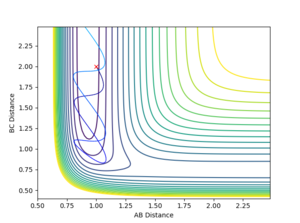
For reaction 2, a series of simulations were run with rHH = 2 and rHF = 1 values with both of the momenta being altered. Unlike reaction 1, an increase in vibrational energy which can come from a more negative momentum of the initial HF molecule increases the chance of a reaction. Using a fixed initial hydrogen atom momentum of -1.25, a pHF value of -10 or lower was needed for the formation of H2. This is a large number but from the calculation earlier, the activation energy for this reaction is very high. Switching the values of the momentum around (i.e. pHF = -1.25, pHH = -10) does not overcome the TS. This proves that the kinetic energy factors affecting reaction 2 are the antithesis of those affecting reaction 1. Figures 17 and 18 shows the significance of a large vibrational energy indicated by the large bond oscillations, on the the reaction outcome.
 |
 |
To clarify the momentum between the free atom and the first atom of the diatomic does not completely correspond to translational energy as there is there is a mixture of vibrational energy in there as well. Though it is true that increasing the momentum of the diatomic will substantially increase the vibrational energy of the bond, increasing the oscillation as seen by the contour plot.
These results are coherent with the empirical rules stated by Polanyi. These rules state that the translational energy of the reactants are more effective at overcoming an early potential barrier whereas vibrational kinetic energy is best for a late potential barrier.[4] Earlier, we recognised that due to the exothermic nature of reaction 1 it has an early state, and the endothermic nature of reaction 2 leads it to having a late transition state. This justifies that reaction 1 has a higher chance for a successful collision when the majority of the kinetic energy is translational since it has an early TS. And that the late TS of reaction 2 is best overcome with vibrational energy.
(Overall, a very good report. Very well done indeed. Fjs113 (talk) 17:00, 28 May 2018 (BST))
References
- ↑ T. Bilgaard and T. J. Nørskov, Chemical Bonding at Surfaces and Interfaces, 2008, 143-254.
- ↑ Y. R. Luo, Comprehensive Handbook of Chemical Bond Energies, Cambridge , 2007.
- ↑ R. D. Levine, Molecular Reaction Dynamics, Cambridge, 2009, 150-160.
- ↑ S. Yan, Y. T. Wu and K. Liu, PNAS, 2008, 105, (35), 12667-12672.


