MRD:OHC15
Introduction
In this wikipage, triatomic reactions between a single atom and a diatomic molecule, were modeled and investigated using a MATLAB programme with 2 different calculation methods available (i.e. MEP and Dynamic). Reactivity analysis was performed through investigating transition state position, potential energy profile, kinetic energy profile and internuclear momentum of different reaction trajectories of H-H-H and H-H-F systems with the aid of Transition State Theory and Polanyi's rules.
H-H-H System
Potential Energy Surface and Reaction Trajectory
 |
 |
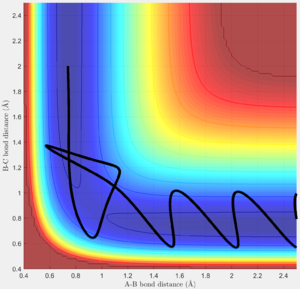
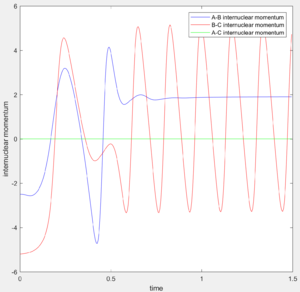
The system is modelled with the single H atom (atom A), and the diatomic H2 (B-C molecule). Figure 1 and 2 shows the reaction trajectory of a H + H2 reaction passing through a transition state. The reaction trajectory passes through the lowest potential energy channel. Minimum points on the potential energy surface are critical points, where their gradients equals to zero (i.e.Ux=0 and Uy=0, where Ui is the first partial derivative of variable i). From the surface plot, we know that the transition state position is at the maximum point of the lowest potential energy reaction path. In another words, transition structure occur at the saddle point. Thus, total gradient of the potential energy surface at minima and transition state equals to zero.
In a one dimensional curve, a maximum point has a negative second derivative value and vice versa for a minimum point. Applying this to our two dimensional potential energy surface, our saddle point of the transition state is a minimum when viewed along the y-axis, but at the same time, if viewed along the x-axis, it is a maximum. Therefore, Uxx and Uyy at the saddle point would be of opposite signs(i.e. UxxUyy is less than zero and smaller than square of Uxy) . Using this property, we can distinguish the transition state position from the minimum points, while the minimum points would have positive values for both Uxx and Uyy.
Estimation of transition state radius
For H + H2 system with symmetrical surface, r1=r2 at transition state. Setting momenta equal to zero, we could find the transition state position which gives us a constant intermolecular distance over time.
 |
 |
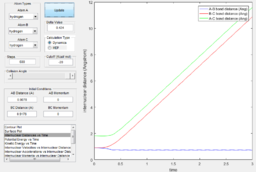
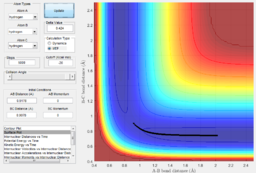
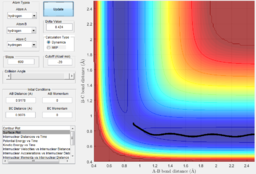
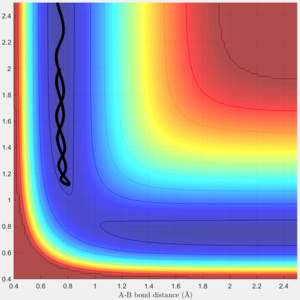
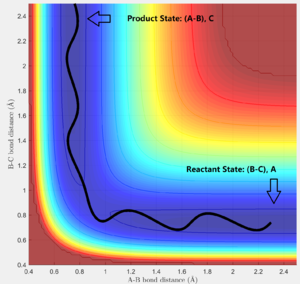
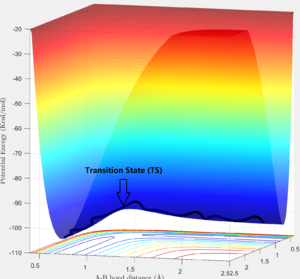
Via trial and error, an estimate transition state was found at approximately rts=0.9078 Ang. The periodic pattern is hardly observable, indicating that the transition state is at approximately 0.9078 Ang.(Fig.3) This can be confirmed using the surface plot, the black dot representing our system is situated at the maximum point of the lowest energy trajectory (Fig. 4).
Calculation Methods of Simulation and Observations
Knowing the transition state position is at approximately rts=0.9078 Ang, we can propagate simulation of forward and backward reaction from the transition state by deviating r1 or r2 from rts by . The following two methods were applied to both sets of initial conditions:
| Variables | Case 1 | Case 2 |
| Direction of reaction | Forward reaction | Backward reaction |
| r1 | rts | rts+ |
| r2 | rts+ | rts |
| p1 | 0 | 0 |
| p2 | 0 | 0 |
Minimum Energy Path Calculation Mode(MEP):
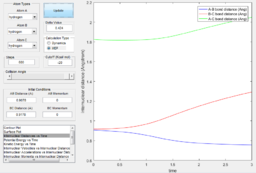
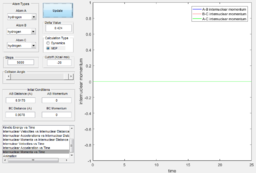
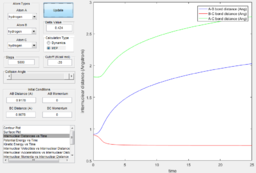
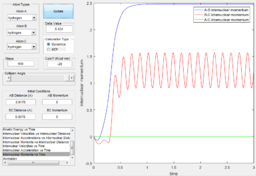
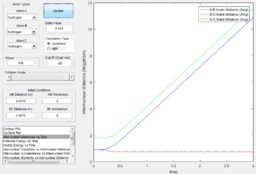
From the internuclear momentum plot of MEP, it is observed that the momentum is zero at all time during the simulation.(Fig. 6) This is due to the settings in this calculation method, where initial momentum of each time step is reset to zero prior to calculation process. It evaluates the gradient of the surface at a point and uses this value to approximate the distance of the current position from the position where gradient of the surface is zero (i.e. product state). This calculation process is repeated in each time step. When the trajectory enters a region where gradient is less steep, the step width to the next step gets smaller and approach the product state at a slower pace. Since momentum is reset at the beginning of each step, there is no vibrational motion observable in this trajectory, yielding a straight trajectory on the surface plot. Due to the similar reason, the internuclear distance change is significant in the first 5 time unit, but then the increment in internuclear distance gets smaller and smaller. (Fig. 7)
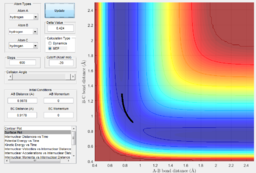
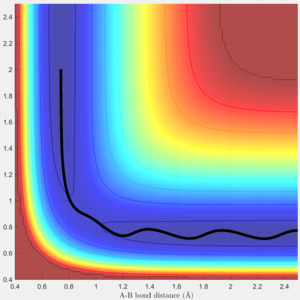
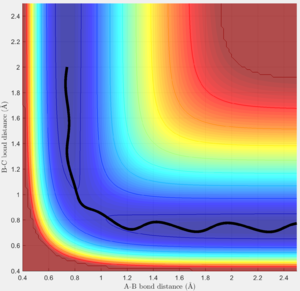
In addition, from the MEP surface plot we can see that the trajectory (Fig. 5) going from the transition state to a product state has a decreasing r1 (i.e. A-B distance) and increasing r2(i.e. B-C distance). This shows that a bond between the approaching H atom (i.e. atom A) and one of the H atom in the H2 molecule (i.e. atom B) is formed and approaches to a constant value, while rBC is constantly increasing.
Dynamic Calculation Mode:
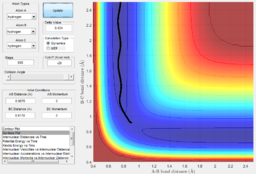
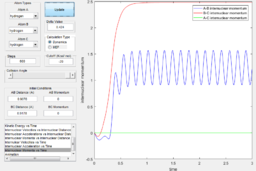
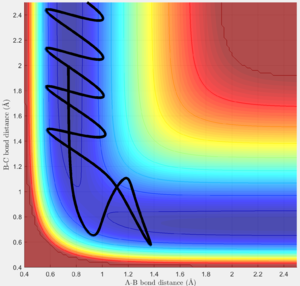
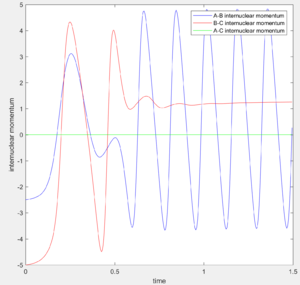
Using the dynamic method, a curvy periodic trajectory is recorded, showing the vibration of A-B bond after the transition state, while atom C is moving further and further away from the newly formed H2 molecule (i.e. A-B molecule). This observation is comparable to the periodic pattern observed for the A-B bond internuclear distance plot. It is also observed that the B-C bond distance increases linearly after the exponential increase at the beginning. From this we can see that the dynamic method takes a different calculation approach. Analysing the momentum plot, we can observe that A-B and B-C momenta both increases sharply as they start moving from the initial transition state. This is due to the conversion of potential energy into kinetic energy as the intermediate transit to the product state. It is observed that momentum of B-C has steeper increment than that of A-B, this is because partial of the potential energy gained between A-B is converted to the A-B bond energy. For B-C momentum, the curve levels off and reaches a constant value after approximately 1 time unit, this is the time point where there is no more B-C interactions in the system. Meanwhile, the internuclear momentum between A and B achieved a periodic pattern with constant amplitude and wavelength, which reflects the bond vibration motion of molecule A-B.
Comparing to the MEP, this method reaches the product state at much earlier time step and bond vibration motion of the product is observable. In this method, a continuous trajectory of the system was simulated, where trajectory data is accumulative.
Case 2:
Applying case 2 conditions to both methods, we can observe that the trajectory of both method was a reflected image along of case 1. In fact, this simulation is modelling the reaction pathway of the reverse reaction, going from transition state back to the reactant state. Besides, there is no difference in the internuclear distance and momentum between the systems in case 1 and case 2.
Reactivity Test of Reactions with Different Initial Momenta
Complete the table by adding a column reporting if the trajectory is reactive or unreactive. For each set of initial conditions, provide a screenshot of the trajectory and a small description for what happens along the trajectory.
Transition State Theory
The Transition State Theory (TST) assumes classical behaviour of atomic nucleus, where reaction trajectory can only pass through the transition state (TS) once either from reactants to products or vice versa when energy barrier is overcome.[1] This means quantum mechanics ideas of tunnelling and quantisation were not taken into account. However, in reality, a small probability of particle tunnelling through a potential barrier and quantisation of energy do exist. From the above cases, it is learnt that sufficient initial kinetic energy is required to overcome the energy barrier (classical requirement), but at the same time, not all reactions that satisfied the energy barrier could yield a complete reaction to the product state. Case 4 and 5 provided evidence that reaction pathway can recross the TS more than once and reactions that has sufficient energy to overcome the barrier could be unreactive. A resultant energy of the newly formed molecule that matches the allowed vibrational mode energy of the molecule is equally crucial for the reactive to reach completion. Therefore, reaction rate values predictions of TST would give a continuous range of values, while the experimental values are fixed values at each quantised level.
F-H-H System
Transition State and Activation Energy
H+HF
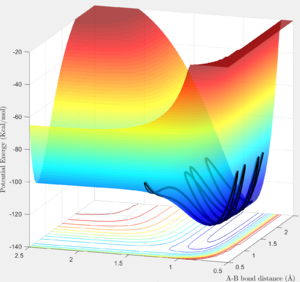
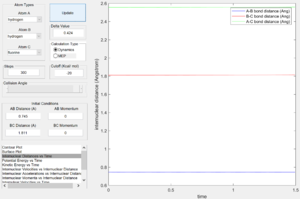
From the surface plot(Fig. 24), it is observed that this is an endothermic reaction as the potential energy of the reactant channel is lower than that of the product channel. The Hammond's Postulate states that in an endothermic reaction the TS structure is geometrically and energetically closer to that of the product and thus the TS is expected to be found in the product channel. The internuclear distance plot (Fig. 25) shows that the transition state saddle point is at r1=0.745 Ang and r2=1.811 Ang. Using MEP calculation method, an activation energy of 30.2kcal/mol was recorded.(Fig.26) This large activation energy reflected the strong H-F bond strength as large amouont of energy is required for H-F bond dissociation.
 |
 |
 |
F+H2
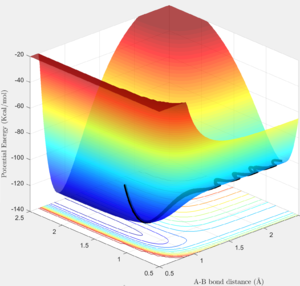
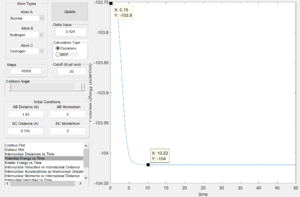
From the potential energy surface plot (Fig. 27) of the F+H2 system, we can see that the reactant channel has higher potential energy than that of the product channel, indicating this is an exothermic reaction. Again, using the Hammond's Postulate, the transition state is expected to be found in the reactant channel of a exothermic reaction. The internuclear distance plot with very little vibration confirms the transition state position to be at r1=1.811 Ang and r2=0.745 Ang.(Fig. 28) Using dynamic calculation method, the activation energy value was recorded to be 0.2kcal/mol.(Fig.29) This small energy value reflects that H-H bond strength is much weaker than that of H-F in comparison to the value of activation energy collected for H+HF system.
 |
 |
 |
F+H2 Reaction Analysis
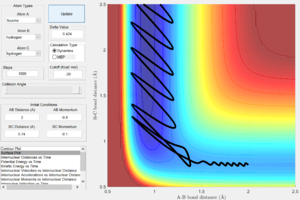
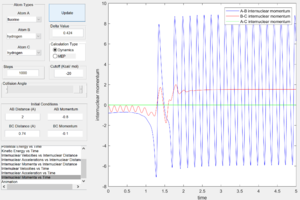
Figure 30 shows a reactive trajectory of F+H2 with initial conditions of r1=2 Ang, r2=0.74 Ang, p1=-0.8 and p2=-0.1. The internuclear momenta plot (Fig. 31) of this reaction shows that loss in potential energy is converted to vibrational energy of the newly formed H-F bond and translational energy of the leaving H atom. This can be confirm using IR spectroscopy, absorption peak resulting from the excitation of H-F bond vibration to higher energy levels (i.e. overtones) can be observed.
 |
 |
Polanyi's Empirical Rule
According to Polanyi's Empirical Rule[2], the initial relative translational and vibrational energy required to yield a reactive trajectory depends on the transition state position in the reaction. For reaction with early transition state, more translational energy than vibrational energy would increase the probability for reaction to reach completion. On the other hand, for late transition state reactions, greater vibrational energy than translational energy would similarly increase the chance of getting a reactive reaction.
F+H2
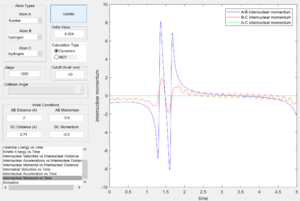
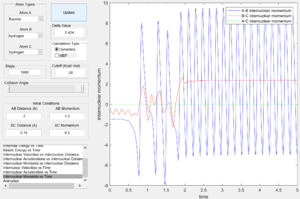
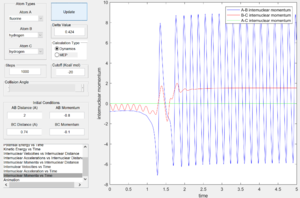
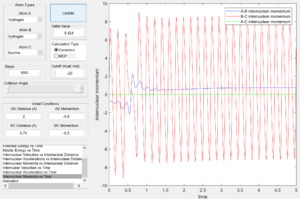
From the internuclear momentum plots (Fig. 32 & 33), increase in translational momentum of F atom (i.e. internuclearn momentum A-B) from -0.8 to -1.5 with same vibrational momentum of -0.5, resulted in a reactive reaction. Also, a decrease in vibrational momentum of F atom (i.e. internuclear momentum B-C) from -0.5 to -0.1 with same translational vibration momentum of -0.8, resulted in a reactive reaction.(Fig. 33 & 34) These results obey the Polanyi's rules of an exothermic reaction.
 |
 |
 |
H+HF
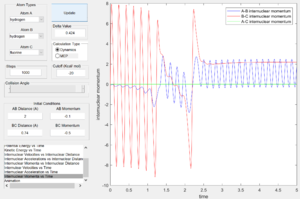
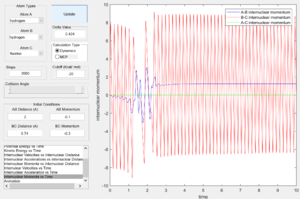
From the internuclear momentum plots (Fig. 35 & 36), decrease in translational momentum of F atom (i.e. internuclear momentum A-B) from -0.8 to -0.1 with same vibrational momentum of -0.5, yielded a reactive reaction. Also, an increase in vibrational momentum of F atom (i.e. internuclear momentum B-C) from -0.3 to -0.5 with same translational vibration momentum of -0.1, resulted in a reactive reaction. (Fig. 36 & 37) These results obey the Polanyi's rules of an endothermic reaction.
 |
 |
 |
Conclusion
From experimental data of H+H2 reactions, transition state is recorded at rts=0.9078 Ang. Reactivity analysis of reactions with different initial internuclear momentum of this system identified limitations of Transition State Theory and provided evidence for barrier recrossing.
For the F-H-H system, an exothermic H2+F reaction and an endothermic HF +H reaction were identified. Activation energies of 0.2kcal/mol and 30.2kcal/mol were calculated respectively. Transition states of the 2 reactions is an inverse of the other reaction, where they can be considered as a reverse reaction of the other. (i.e. Exothermic: (rFH,rHH)=(0.745,1.811) and Endothermic:(rFH,rHH)=(1.811,0.745)) Reaction efficiency of both reactions were tested with different initial translational and vibrational energies and all observations are comparable with predictions of the Polanyi's Empirical Rule, proofing that this is a better theory in predicting reaction behaviours than TST. However, experimental results of some literature disagrees with the Polanyi's Empirical Rules, showing that this rule is not perfect for all cases, especially when a system with great energy difference between the reactant and product channel is encountered.[3]
References
[1] Truhlar, D. G., Garrett, B. C., Klippenstein. S, J. Phys. Chem. 100 (31): 12771–12800.
[2] Z. Zhang, Y. Zhou, D. H. Zhang, G. Czakό, J. M. Bowman, J. Phys. Chem. Lett.,2012, 3 (23), 3416-3419.
[3] Z. Zhang, Y. Zhou, D. H. Zhang, G. Czako, and J. M. Bowman, “Theoretical Study of the Validity of the Polanyi Rules for the Late- Barrier Cl + CHD 3 Reaction.”

