MRD:OA010298
Reaction Molecular Dynamics Comp Lab
Exercise 1: H + H2 System
In this section we are considering a system of 3 hydrogen atoms all aligned on the same line of motion. By altering the distance between A and B (rAB), the distance between B and C (rAB), the momentum between A and B (pAB) and the momentum between B and C (pBC) we can assign initial conditions that simulate a collision between H2 and a H atom.

Representation of the transition state on a potential energy surface:
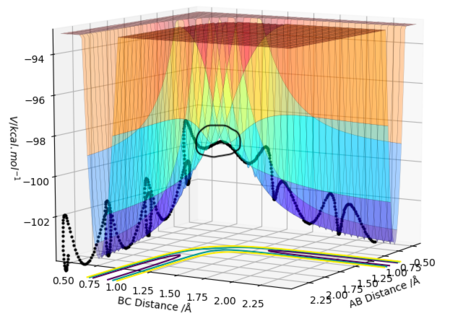
On the potential energy surface the transition state is the point in the reaction pathway with the highest potential energy, as shown in figure 1. Mathematically, at this point, both
and
will equal 0. However, this result is true for all points on the reaction pathway So the entire reaction pathway has no gradient??. Pu12 (talk) 22:09, 30 May 2019 (BST)
. The transition state is the point on this pathway with the highest value of V (potential energy). It is a maximum in a trough of minima.
More correctly the transition state is represented by a saddle point. A saddle point is mathematically defined as satisfying the below equation:
If the point were a minimum then the above result would not be true. It would be greater than 0. The transition state is both a maximum and a minimum depending on direction considered, unlike a local minimum which is always a minimum. It looks like you copied the equation from somewhere, it's correct but, it's easier to consider the TS point as somewhere where the second derivative of potential energy with respect to time is <0 in one direction and >0 in the other. Pu12 (talk) 22:09, 30 May 2019 (BST)
Locating the transition state position:
We know that the transition state is going to be symmetric (the new H bond is forming as the old H bond is breaking) and so it can be found by setting rAB = rBC and giving them both no initial momenta (pAB=pBC=0). By doing this the trajectory is 'trapped' on the ridge created by the minimum component of the saddle point that represents the transition state. It can only oscillate at the top of this ridge rather than going down either of the sides. By adjusting the value of rAB and rBC (maintaining that rAB = rBC) a point can be found where the trajectory doesn't oscillate at all (ie. it is stationary), this will be the transition state position (rts).
rts was found to equal 0.908 Å (3 d.p.)
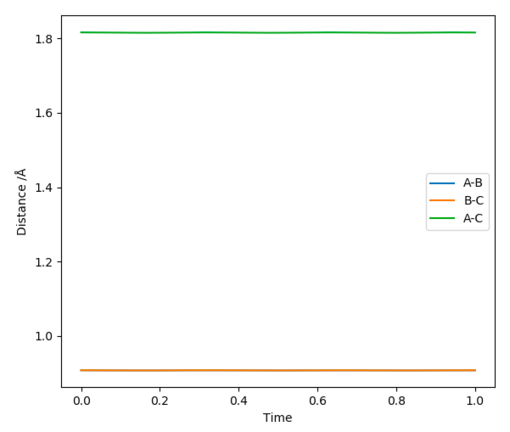
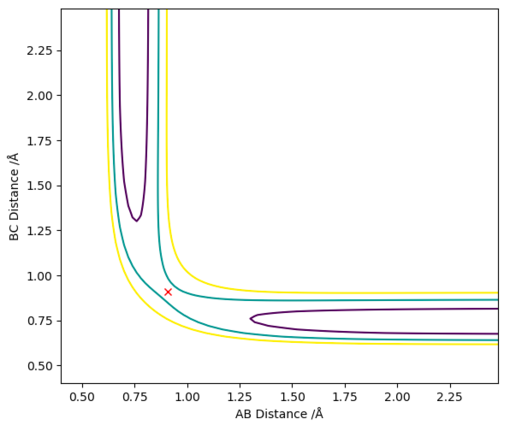
The 2 graphs shown in Figure 2 and 3 display the results of having rAB = rBC=0.908 Å and pAB=pBC=0. Both confirm that the H atoms are stationary and that rts=0.908 Å.
Good. Pu12 (talk) 22:09, 30 May 2019 (BST)
The minimum energy path:
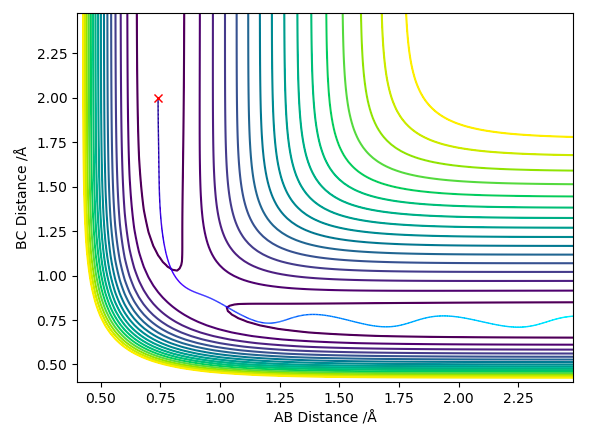
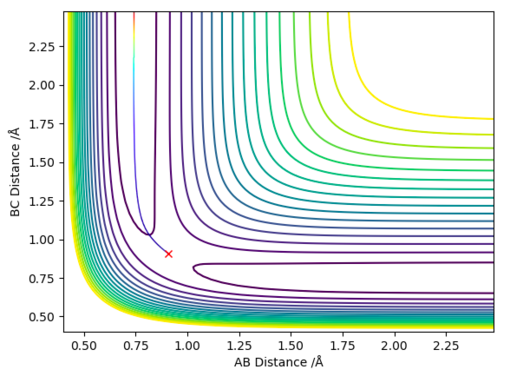
The minimum energy path way is a special type of trajectory that resets all the momenta to 0 for every step of the simulation. By doing this the inertial motion of the gaseous H atoms is removed, resulting in a trajectory that exactly follows the bottom of the reaction pathway, hence the name minimum energy pathway. In order to simulate this the MEP setting is chosen (instead of Dynamic) and rAB is set to rts (0.908 Å), rBC is set to rts + δ (0.910 Å) and both momenta are set to 0. This produces the 2D contour plot shown in figure 4.
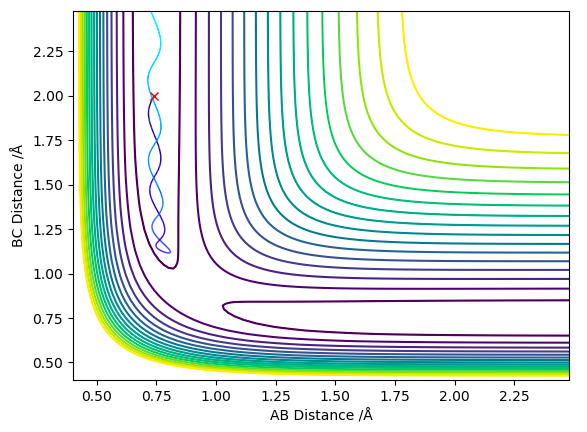
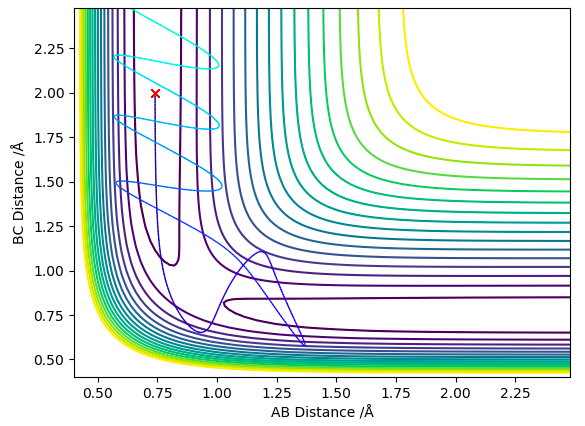
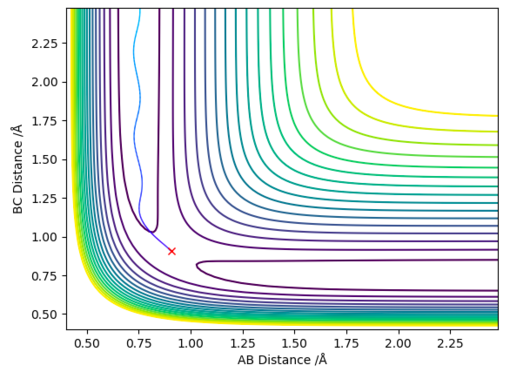
When the same simulation is run using the Dynamic setting instead of the MEP setting the inertial motion is now taken into account, the particles now have momentum/kinetic energy and are therefore seen to oscillate. This is shown in figure 5, the trajectory follows the reaction pathway but oscillates up and down the sides.
Reactive or Unreactive?
Good discussions but you should also mention the vibrations. Pu12 (talk) 22:09, 30 May 2019 (BST)
This table highlights 2 key ideas:
1) By increasing the momentum (and therefore energy) of the system the transition state barrier can be overcome.
2) For higher energy systems the transition state barrier will be overcome but there is a chance the reactants can reform after this.
Transition State Theory
The transition state theory attempts to explain rates of reaction using 3 key assumptions[1]:
1) Once reactants have reached the transition state they cannot return back to being reactants.
2) The distribution of the particles potential energies follows the Boltzmann distribution.
3) The reactants are in a constant equilibrium with the activated complex (transition state).
My previous results show an obvious discrepancy with the 1st assumption as trajectories have passed back and forth over the transition state. There is also a discrepancy with the 3rd assumption, where there is significant recrossing over the transition state barrier it is reasonable to approximate an equilibrium between reactants and the transition state but all trajectories end by travelling infinitely far away from the transition state. In these examples the equilibrium will never be regained.
Good, there is also an assumption about quantum tunnelling but its effect is minuscule. The discrepancy you mention with the 3rd reaction is a quirk of the computations, I think that the question means in-lab obtained values for experimental values where the reaction would be contained in a vessel (although this is unclear so your answer is fine). Pu12 (talk) 22:09, 30 May 2019 (BST)
Exercise 2: F-H-H System
PES Inspection
Classifying the reactions:
F + H2
^^This reaction is exothermic.^^
FH + H
^^This reaction is endothermic.^^
These conclusions were made by assessing the potential energy surface (PES) for the F-H-H system. Figure 6 shows the PES at an angle that clearly shows how the energy at the bottom of the reaction pathway varies with distance BC (the distance between the 2 H atoms). Effectively forming a 2D representation of potential energy against distance BC. It shows that when BC increases (ie the H-H bond dissociates) the energy of the system becomes more negative, it is stabilised. This is characteristic of an exothermic reaction. In figure 7 the PES is orientated in a way that shows the relationship between the distance AB (the distance between F and HB). Now we see that the energy is raised as the distance AB is increased (ie the F-H bond dissociates). This raising of energy is characteristic of an endothermic reaction, energy needs to be put in for the reaction to occur.
These results are confirmed by the relative strengths of the H-H and H-F bonds. The H-F bond is stronger (565 kJmol-1) than the H-H bond (432 kJmol-1)[2]. In the F + H2 reaction the weaker H-H bond is broken and a stronger H-F bond is formed having a net release of energy therefore making it exothermic (ΔG = -133 kJmol-1). In the reverse direction the opposite occurs making it endothermic.
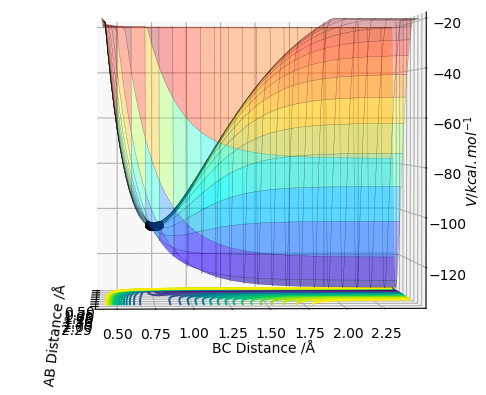
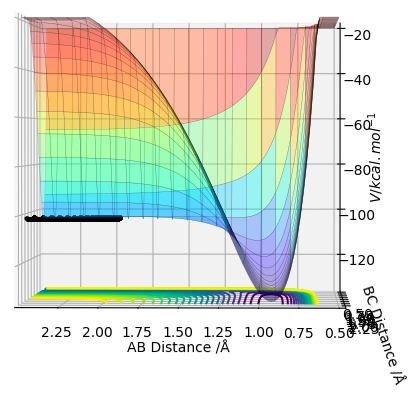
Good explanation. Pu12 (talk) 22:09, 30 May 2019 (BST)
Location of the transition state:
The PES can also be used to find the transition state position of the reaction using a method similar to that of the H + H2 system. Its not quite as simple as though since the transition state will no longer be symmetric as all the atoms aren't the same. Both the momenta are set to 0 and the correct distances between bonds can be approximated by looking for the characteristics of the transition state described in Representation of the transition state on a potential energy surface on the PES, these distances can then be adjusted until the trajectory doesn't move. The Hammond postulate can also be used to help approximate the position of the transition state. F + H2 → F-H + H is an exothermic process and therefore has an early transition state. Hammonds postulate states that similar energy species will be similar shapes[3], we can therefore conclude that the transition state is similar in shape to the reactants. This means that the H-H separation in the transition state will be similar to the H-H bond length (74 pm or 0.74 Å[4]).
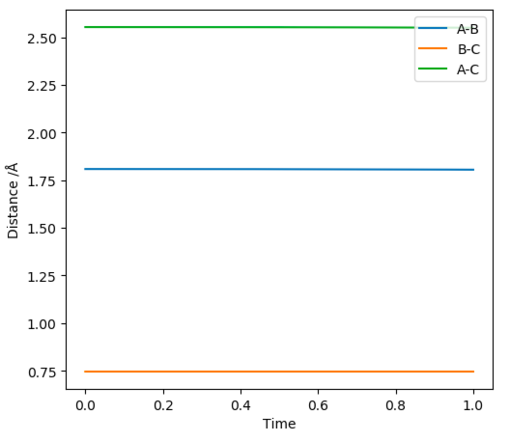
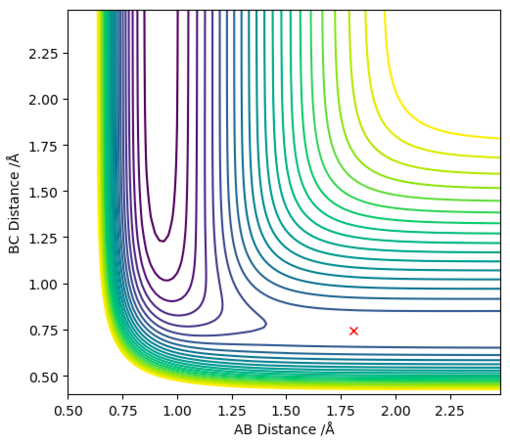
Once found the transition state position can be displayed by all horizontal lines on an Internuclear distances vs Time graph (figure 8) or on a 2D contour graph that shows no movement of the trajectory (figure 9).
The F-H separation in the transition state was found to be 1.808 Å (3 d.p.)
The H-H separation in the transition state was found to be 0.745 Å (3 d.p.) (note similarity to the H-H bond length)
Calculating activation energies:
The 2 activation energies can be found by running an MEP, setting all momenta to 0 and adjusting the size of the H-H separation to the distance in the transition state (0.745 Å) and the F-H separation slightly displaced from its transition state value (1.798 Å and 1.818 Å). By running these 2 MEPs the trajectory can flow down either side of the transition state. Its the Energy vs Time graphs that these simulations produce that are crucial, using these we can find the energy difference between the transition state and the reactants/products by calculating the difference between the highest (ie transition state energy) and lowest energies (Ie reactant/products energies) on the Energy vs Time graphs. The Energy vs Time graphs and their respective MEP 2D contour plots are shown in figure 10 and figure 11.
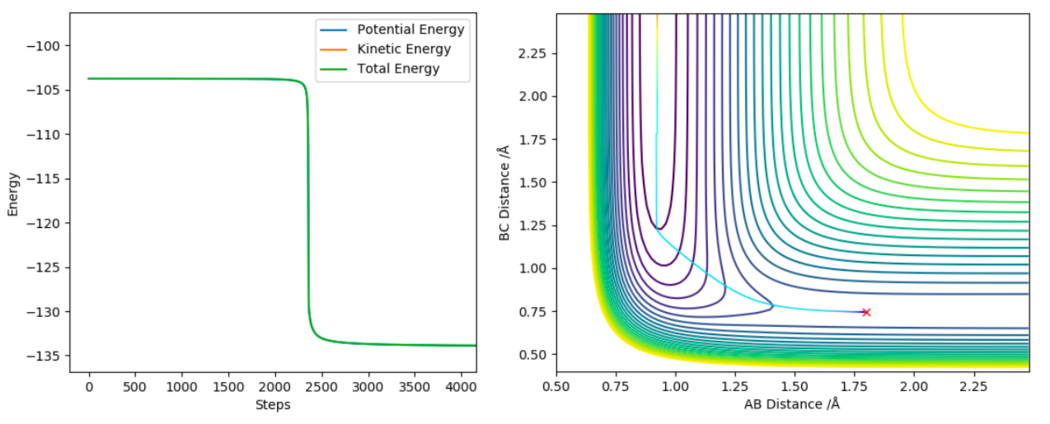
Using the Energy vs Time graph shown above:
Ea for F-H + H → F + H2 = (-103.752)-(-133.868) = 30.1 (2 d.p.) Correct, but units are in kcal/mol. Pu12 (talk) 22:09, 30 May 2019 (BST)
(Exact values for energies found by zooming in on the graph on the lepsgui.py software)
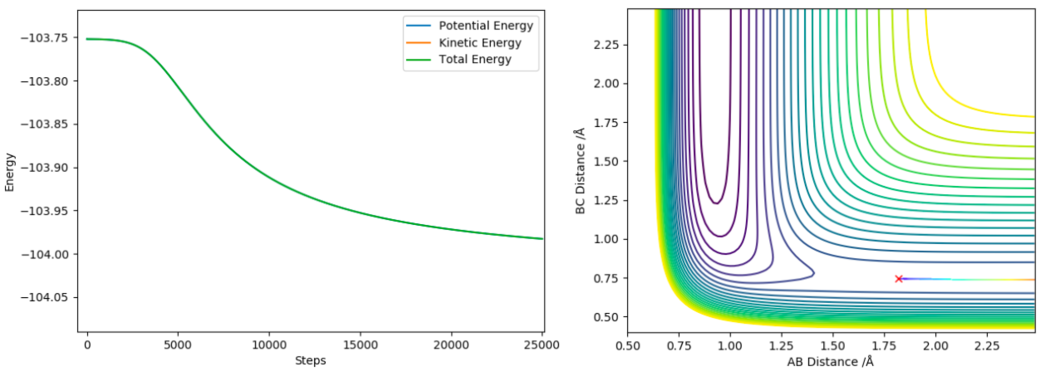
Using the Energy vs Time graph shown above:
Ea for F + H2 → F-H + H = (-103.752)-(-103.928) = 0.23 (2 d.p.)
(Exact values for energies again found by zooming in on the graph on the lepsgui.py software)
The larger Ea for F-H + H → F + H2 makes sense as this process is endothermic and therefore has a late transition state, the kinetic barrier is high (F + H2 → F-H + H is exothermic and has an early transition state).
Reaction dynamics:
1 set of successful F + H2 → F-H + H reaction conditions are rFH = 2.3 Å, rHH = 0.74 Å, pFH = -2.5 and pHH = -1.5. The results of running a simulation with these conditions are shown below in figure 12.

Considering the Momenta vs Time graph in figure 12, the orange line is initially oscillating with a negative momentum, representative of the H2 molecule possessing vibrational and translational kinetic energy and travelling towards the F atom. Once the reaction is complete (~ at t = 2.0) the orange line becomes positive and flat, representative of the now displaced H atom only possessing translational kinetic energy and travelling in the opposite direction. The blue line also starts of with a negative momentum, the F atom is actually travelling away from the H2 molecule but the F atom is ~ 10 times larger than the H2 molecule and so having a momentum that is marginally larger than that of the H2 molecule means the H2 molecule easily catches up/collides with the F atom. It too is flat, showing that the F atom only possesses translational kinetic energy at this point. When the reaction is complete the blue line then starts to oscillate with a large amplitude, indicative of the large vibrational energy possessed by the F-H bond. The reaction energy has been released as increased vibrational energy. Note the total energy of the system is constant throughout, there is a balance between kinetic and potential energy.
Since the reaction energy is released as vibrational energy IR spectroscopy could be used to monitor this. Good, calorimetry could also be used because the vibrational energy would be picked up as heat and this would likely be an easier method. Pu12 (talk) 22:09, 30 May 2019 (BST)
Polanyi’s rules:
Polanyi’s rules state that vibrational energy will overcome a late transition state barrier more efficiently than translational energy whereas translational energy is better for an early transition state barrier[5].
By varying the initial conditions and utilising the fact that the F + H2 reaction has an early transition state and the F-H + H reaction has a late transition state these rules can be explored.
Early transition state
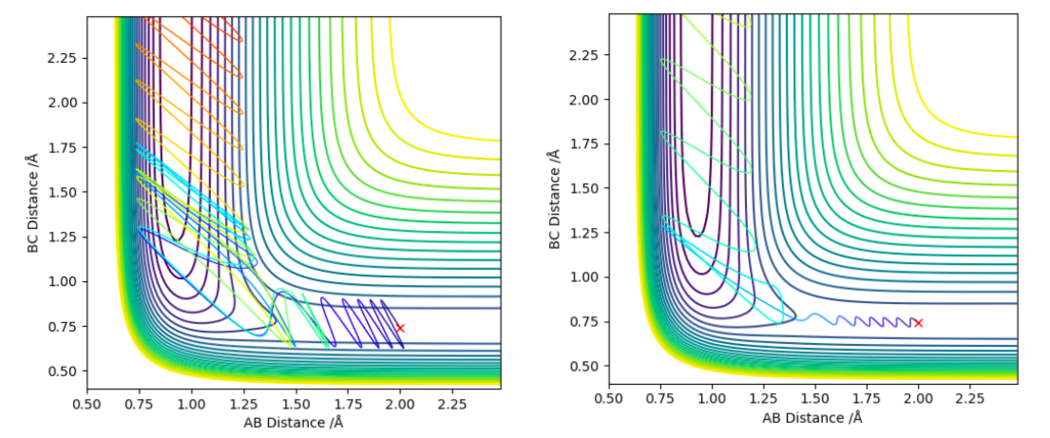
Figure 13 displays the effects on varying the amount of translational and vibrational energy in the system on the efficiency of the F + H2 reaction with an early transition state. Both trajectories start at the same position, rFH = 2 and rHH = 0.74. The 2D contour plot on the left has a much higher H-H bond vibrational energy (pFH = -0.5 and pHH = 2.4). In this case the reaction is successful but there is significant recrossing, the reaction isn't very efficient. The 2D contour plot on the right of figure 13 shows what happens when some of the vibrational energy of the H2 molecule is converted into translational energy of the F atom, the magnitude of pFH is increased (from -0.5 to -0.8) but the magnitude of pHH is significantly decreased (from 2.4 to 0.1). In this case the reaction is seen to be successful with minimal recrossing. These results align with Polanyi’s rule that translational energy overcomes an early transition state more efficiently compared to vibrational energy.
Late transition state
The trajectories shown in figure 14 were found using the inversion of momentum procedure on the 2 trajectories above in figure 13. By doing this the effects on varying the amount of translational and vibrational energy in the system on the efficiency of the F-H + H reaction can be observed. The plot on the left has higher vibrational energy (pFH = -6.674) compared to the simulation on the right (pFH = 1.108), it is also less efficient in crossing the transition state barrier (the translational energies were similar pHH = -1.016 on the left and pHH = -1.171 on the right). This actually contradicts Polanyi's rules as it suggests the lower vibrational energy system is more efficient at crossing the late transition state.
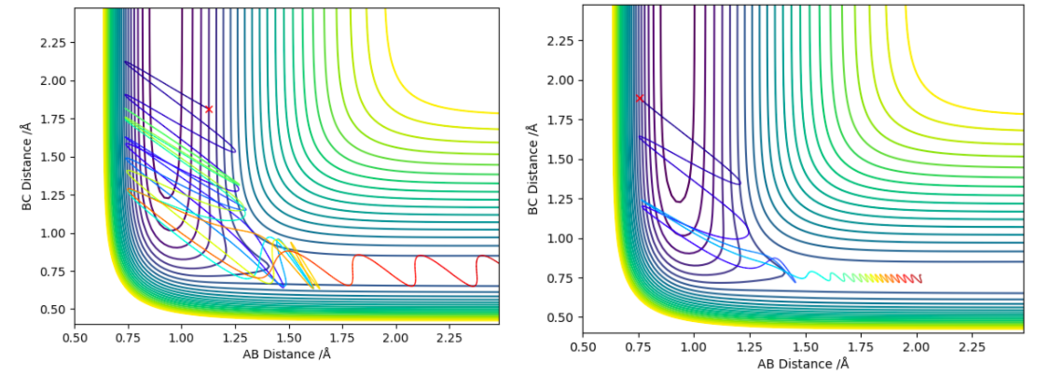
Acquiring simulations that clearly depicted Polanyi's rule for late transition states proved difficult as the inversion of momentum procedure dictated which starting conditions were feasible. This limited control over how much relative vibrational and translational energy you could give the system.
Good discussion, it's difficult to get contour plots to demonstrate the efficiency of reaction clearly, you don't need to use them for this. Pu12 (talk) 22:09, 30 May 2019 (BST)
Good report overall. Pu12 (talk) 22:09, 30 May 2019 (BST)
References
1 - Steinfeld, Jeffrey I., Francisco, Joseph S, and Hase, William L. Chemical Kinetics and Dynamics. Englewood Cliffs, N.J.: Prentice Hall, 1989.
2 - Darwent, B. National Standard Reference Data Series. No. 31 31, (1970).
3 - Hammond, G. S. A Correlation of Reaction Rates. J. Am. Chem. Soc. 77, 334–338 (1955).
4 - CRC Handbook of Chemistry and Physics. (Boca Raton, 2013).
5 - Polanyi, J. C. Concepts in reaction dynamics. Acc. Chem. Res. 5, 161–168 (1972).

