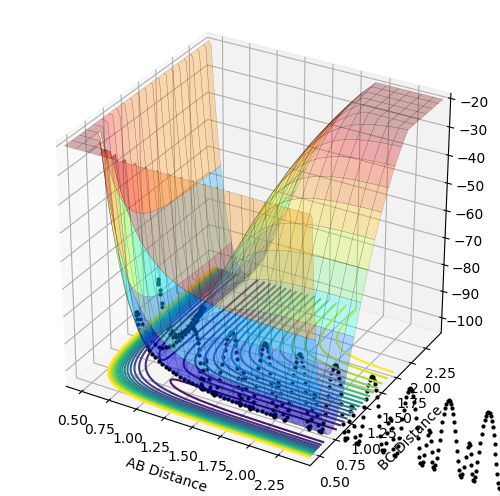
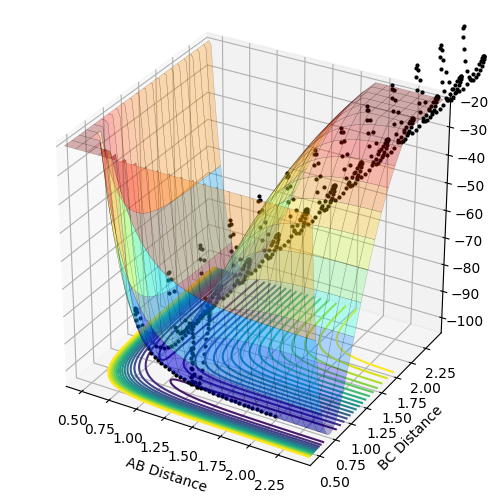
MRD:NW716
H + H2 System
Potential Energy Surface
Transition State and Minima
Qn: What value do the different components of the gradient of the potential energy surface have at a minimum and at a transition structure? Briefly explain how minima and transition structures can be distinguished using the curvature of the potential energy surface.
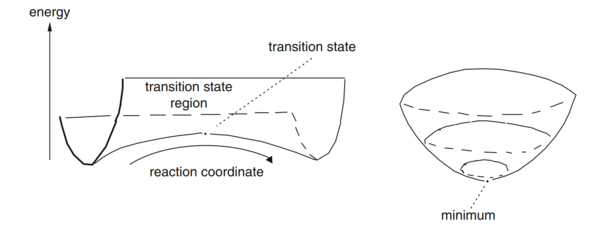 |
| Figure 1 - Transition State and Minimum [1] |
The gradients of the potential energy surface at a minimum and at a transition structure are both 0. At a local minimum, the distance between two bonded atoms is a constant, hence, one of the component, eg. , is zero and > 0. The other component, eg. , is increasing as r2 decreases, i.e. the single atom approaches the diatomic molecule. Transition state linking the two minima represents a maximum along the direction of the reaction coordinate, but along all other directions, it is a minimum. At the transition state, which is the saddle point of the graph, both and are zero. However, for the two reaction coordinates, one of the second derivatives is negative and the other is positive. Hence, if the point is a minimum in one direction and does not decrease in the orthogonal direction, it is a minimum. However, if the point is a minimum in one direction but a maximum in the orthogonal direction, it is a saddle point, which corresponds to the transition state.
(Perfect! Fjs113 (talk) 18:11, 28 May 2018 (BST))
Qn: Report your best estimate of the transition state position (rts) and explain your reasoning illustrating it with a “Internuclear Distances vs Time” plot for a relevant trajectory.
 |
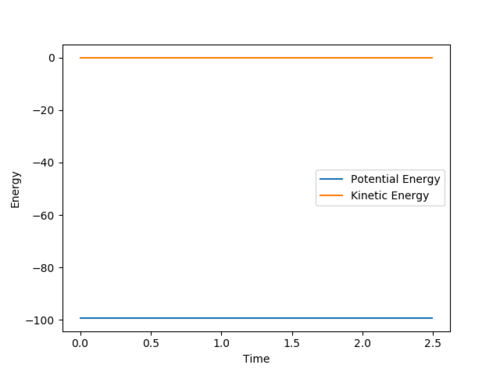 |
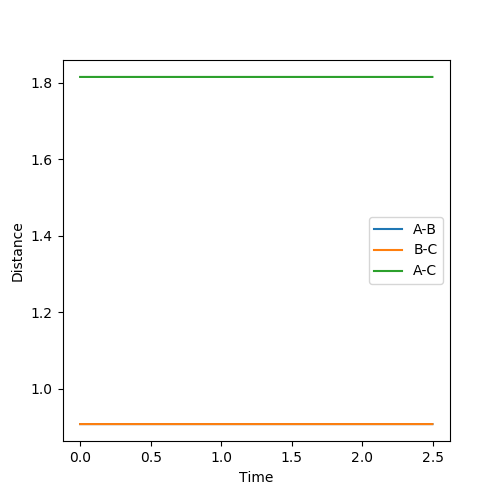
| Figure 2 - Plot of Internuclear Distance VS Time | Figure 3 - Plot of Energy VS Time |
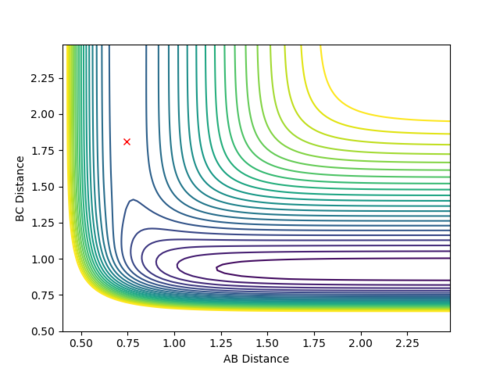
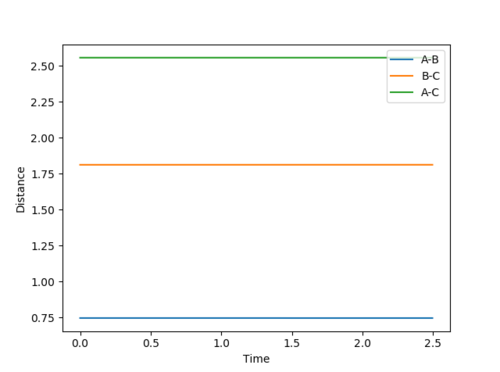
rts is estimated to be 0.9077 Å. Since r1 = r2 and there is no momentum, the distances of A-B and B-C are the same and should not vary. Hence, only two lines are observed in the Internuclear Distances vs Time plot as two lines overlap and the lines are perfectly horizontal. This can also be confirmed using the Energy vs Time plot, Fig 3. At the transition state position, the kinetic energy is zero and potential energy should be a constant.
Reaction Trajectories
Minimum Energy Pathway and Dynamics Calculations
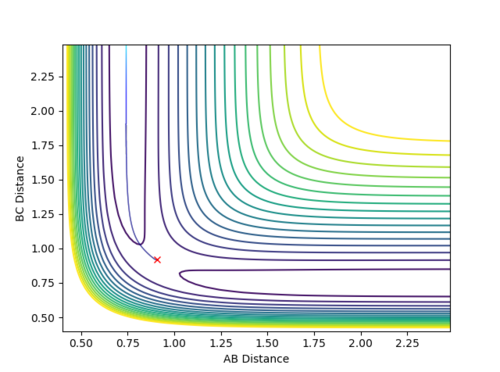
Qn: Comment on how the mep and the trajectory you just calculated differ.
 |
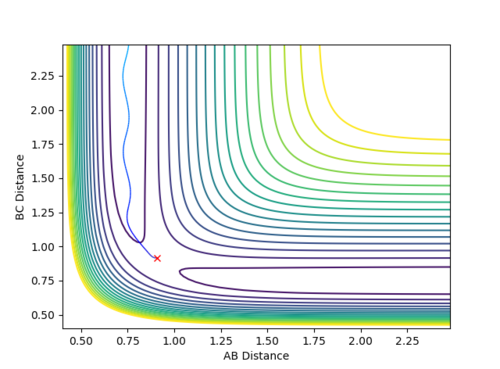 |
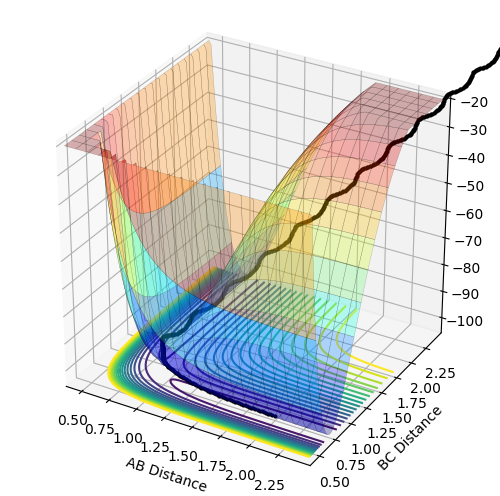
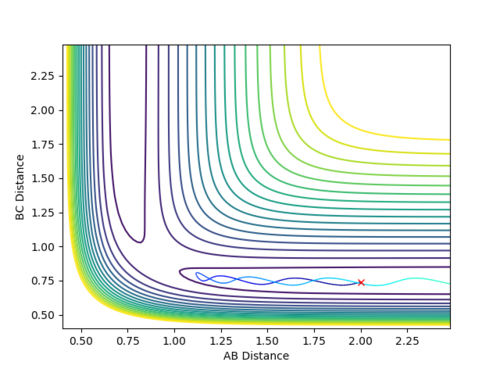
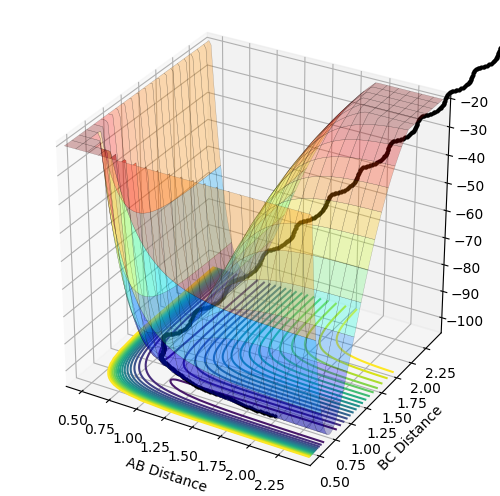
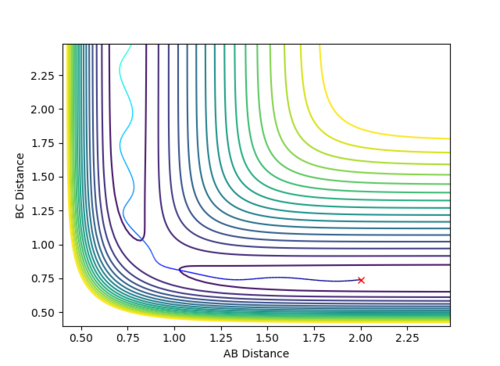
| Figure 4 - Minimum Energy Path (MEP) Calculation | Figure 5 - Dynamics Calculation |
The MEP trajectory is a smooth line without oscillation. The trajectory calculated using Dynamics shows the vibration of HB-Hc bond. This difference is owing to the different calculation methods. MEP corresponds to an infinitely slow motion. Each step is extremely small and the velocity is set to zero after each step. Hence, the motion of the molecule at each step is independent of the previous step and is a trajectory connecting all of the lowest energy points for each step. Therefore, MEP is a smooth and non-oscillatory line. On the contrary, Dynamics calculation corresponds to a continuous motion and every step is dependent upon the previous step (motion of atoms is inertial). Hence, the molecule possesses a velocity to climb up the potential energy surface and results in the oscillation. Moreover, to obtain the length of MEP shown in Fig 4 above, the Steps set for calculation is 50000. However, the Steps set for Dynamics calculation is only 500. Since each step for MEP is extremely small, more steps are required to obtain the same length of the trajectory with the same amount of time.
(This is perfect! Fjs113 (talk) 18:11, 28 May 2018 (BST))
 |
 |
| Figure 6 - Dynamics Calculation: Plot of Internuclear Momenta VS Time | Figure 7 - Dynamics Calculation: Plot of Internuclear Distance VS Time |
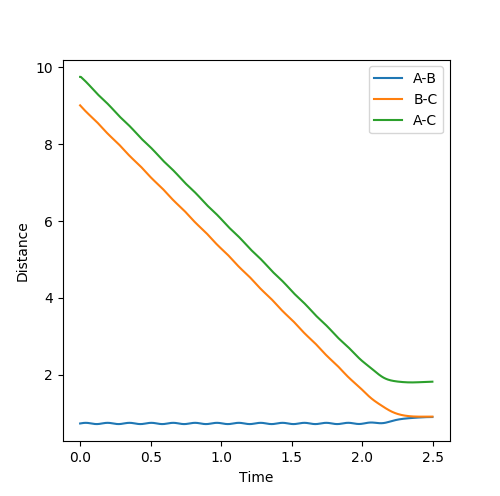
Using the Dynamics calculation, at large time, r1 increases linearly as HB and HC separates and r2 decreases slightly to 0.74 as HA-HB bond forms, seen in Fig 7. At large time, p1 increases to 2.5 and p2 increases to 1.25 (on average). These values indicate that once the reactants surpass the transition state, even slightly, the reaction proceeds readily.
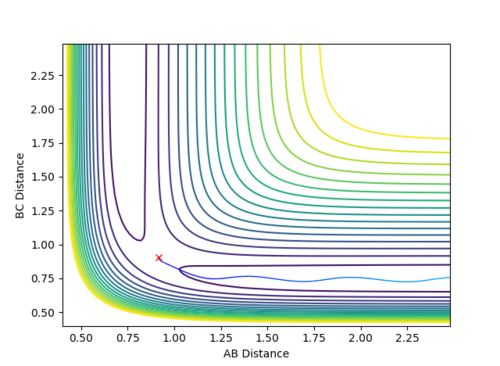
When the parameters of the final position are used as the initial conditions and the signs of the momentum are reversed, the reaction will proceed and end at the transition state, as seen in Fig 8 and 9 below. The final position of this reaction is the red cross at the transition state. This is confirmed by the plot of Internuclear Distance VS Time as r1 is equal to r2 at the end of the reaction.
 |
 |
| Figure 8 - Contour Plot | Figure 9 - Plot of Internuclear Distance VS Time |
Reaction with Different Momenta Combinations
Qn: Complete the table by adding a column with the total energy, and another column reporting if the trajectory is reactive or unreactive. For each set of initial conditions, provide a plot of the trajectory and a small description for what happens along the trajectory.
| Reaction No. | p1 | p2 | Total Energy / kcal mol-1 | Kinetic Energy / kcal mol-1 | Reactivity |
| 1 | - 1.25 | - 2.5 | - 99.018 | + 4.687 | Reactive |
| 2 | - 1.5 | - 2.0 | - 100.456 | + 3.250 | Unreactive |
| 3 | - 1.5 | - 2.5 | - 98.956 | + 4.750 | Reactive |
| 4 | - 2.5 | - 5.0 | - 84.956 | + 18.750 | Unreactive |
| 5 | - 2.5 | - 5.2 | - 83.416 | + 20.290 | Reactive |
Reaction 1: p1 = -1.25, p2 = -2.5
Reaction 2: p1 = -1.5, p2 = -2.0
Reaction 3: p1 = -1.5, p2 = -2.5
Reaction 4: p1 = -2.5, p2 = -5.0
Reaction 5: p1 = -2.5, p2 = -5.2
Transition State Theory
Qn: State what are the main assumptions of Transition State Theory. Given the results you have obtained, how will Transition State Theory predictions for reaction rate values compare with experimental values?
Transition State Theory (TST) assumes that the motion of the atoms obeys classic mechanics and with higher initial momenta, trajectories starting with the same position would be more likely to form the transition state and react as the system contains more kinetic energy to overcome the activation energy barrier. Hence, the reaction should be more likely to proceed with a higher momenta combination as the system would possess a higher kinetic energy. However, from the experimental values above, it can be concluded that the system with a lower kinetic energy (lower than the activation energy of -99.305 - (-103.869) = 4.564 kcal mol-1, calculated using the programme) would not be reactive, for instance, a kinetic energy of 3.25 kcal mol-1 in Reaction 2. However, a system would be unreactive despite a very high kinetic energy which is higher than the activation energy, for instance, Reaction 4 above. This is because as the momenta increases, the atoms populate higher energy vibrational modes. Their motion becomes more complex and collisions might cause the transition state to deviate from the lowest energy saddle point. Hence, even with sufficient energy, a reaction does not occur. This means TST will fail at high temperatures when more reactant molecules occupy higher energy vibrational modes.
TST also assumes that transitions from a reactant state to a product state occur without barrier recrossings.[2] However, Reaction 4 and 5 above show barrier recrossing which does not agree with TST.
Moreover, since the TST is based on the assumption that nuclei behave according to classic mechanics, it does not describe the quantum effects, specifically, quantum tunnelling. There is always a possibility that the reactants will react even if they do not collide to form the transition state and cross the activation barrier. Quantum tunnelling is significant if the activation barrier is low as the tunnelling probability increases with decreasing barrier height.
TST also assumes that the transition state is long-lived so that the reaction continues. It fails if the transition state is short-lived and could affect product selectivity.[3] Therefore, whether a reaction will take place does not solely depend on the initial momenta of the reactants, which illustrates the kinetic energy the system possessed. The Transition State Theory is not accurate to predict the reaction rate with a low activation barrier, a short-lived transition state and at high temperatures.
F - H - H System
Potential Energy Surface
 |

|
| Figure 20 - Surface Plot of F + H2, reactants on the left | Figure 21 - Surface Plot of H + HF, reactants on the left |
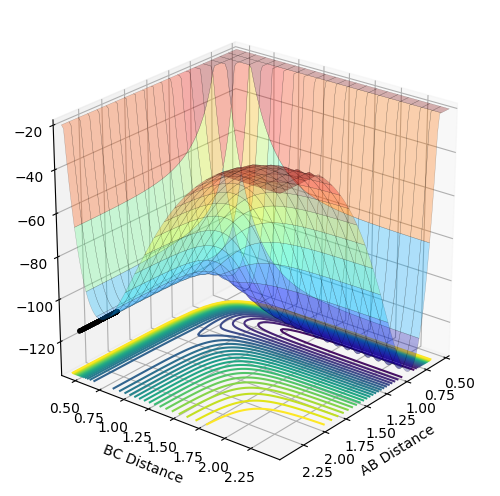
Setting the reactants to be 2.3 Å away from each other, B-C distance to be H-H and H-F bond length respectively and both momenta to be 0, the above two surface plots are obtained. From Fig 20, by observing the two minima, the reactants, H2 and F are at a higher minimum comparing to the product. Hence, the products are lower in potential energy which means that the reaction is exothermic.
Similarly, from Fig 21, the products are higher in potential energy and the reaction between H and HF is endothermic.
Formation of H-F bond and breaking of H-H bond releases energy to the surrounding. Formation of H-H bond and breaking of H-F bond need energy input. These results reflect that H-F bond is stronger than H-H bond, which agrees with a higher H-F bond energies. Bond energy of H-F is 565 kJ mol-1 and that of H-H is 432 kJ mol-1.
Transition State Approximation
F + H2
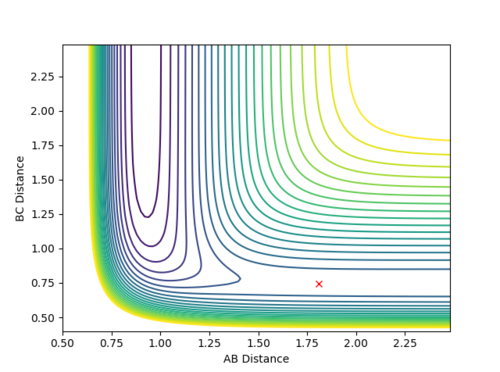
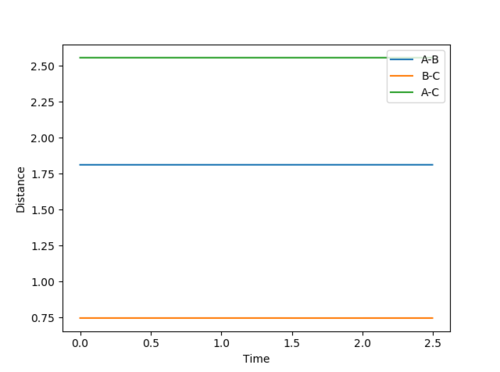
Transition state of F + H2 reaction should compose of longer H-H and H-F bond distances. Based on observation of Fig 20, distance AB is around 1.8 Å and distance BC is around 0.75 Å. This agrees with the Hammond postulate as the transition state of an exothermic reaction should resemble more closely to the reactants, H2 and a separate F atom. Hence, the H-H bond is only stretched a bit from the bond length of 0.74 Å. Using trial and error, F-H distance is estimated to be 1.8107 Å and H-H distance is 0.7450 Å for the transition state structure. From the contour plot, Fig 22, the reactants do not move along the PES and inter-atomic distances stay constant, shown in Fig 23.
 |
|
| Figure 22 - Surface Plot of Transition State | Figure 23 - Internuclear Distance VS Time of Transition State |
H + HF
The H-H and H-F distances for this reaction should be the same as the above reaction as this is the reverse reaction. The transition state in this endothermic reaction should resemble more closely to the products, which are H2 and a separate F atom, based on Hammond postulate. Hence, the F-H distance is 1.8107 Å and H-H distance is 0.7450 Å. The transition state is illustrated with Fig 24 an 25 below.
 |
|
| Figure 24 - Surface Plot of Transition State | Figure 25 - Internuclear Distance VS Time of Transition State |
Activation Energy
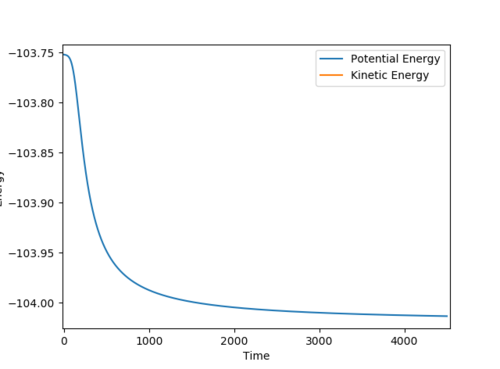
A MEP calculation from a structure neighbouring the transition state, H-F length used in F + H2 reaction 1.8207 Å and is 1.8007 Å in H + HF reaction. These distances are chosen so that the trajectory is towards the reactants and the change in potential energy is therefore the activation energy. The potential energy of the transition state was determined to be -103.752 kcal mol-1, which is the same for both reactions.
The potential energy of reactants in F + H2 reaction is -133.624 kcal mol-1 and that in H + HF reaction is -103.886 kcal mol-1. Hence the activation energies for the two reactions are:
F + H2 : Ea = -103.752 - (-103.886) = 0.134 kcal mol-1
H + HF : Ea = -103.752 - (-133.624) = 29.872 kcal mol-1
 |

|
| Figure 26 - Energy VS Time (F + H2) | Figure 27 - Energy VS Time (H + HF) |
Reaction Dynamics
F + H2
Reactive Conditions
| Reaction No. | p1 | p2 | Contour Plot |
| 1 | -1.5 | 0 | 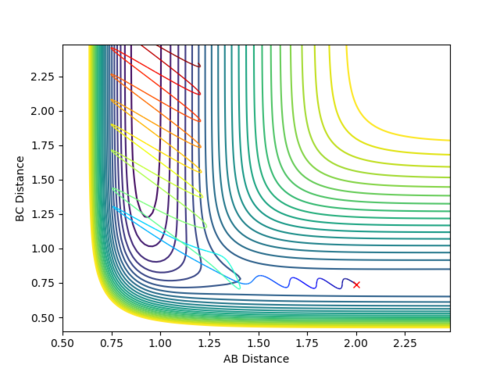 |
| 2 | -1.5 | -0.25 | 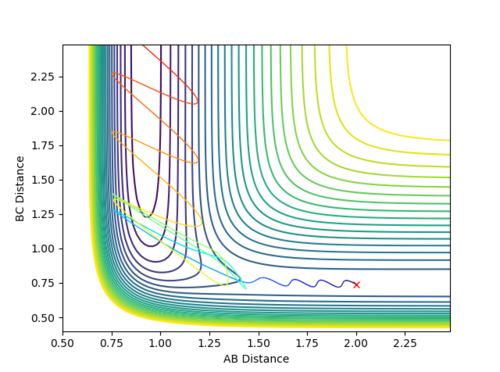 |
| 3 | -2.0 | -1.25 |  |
| 4 | -2.2 | -1.25 | 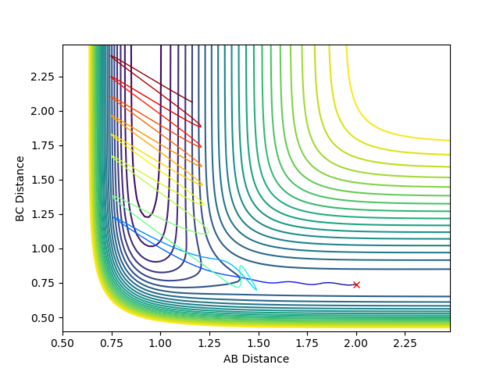 |
| 5 | -2.2 | -1.5 | 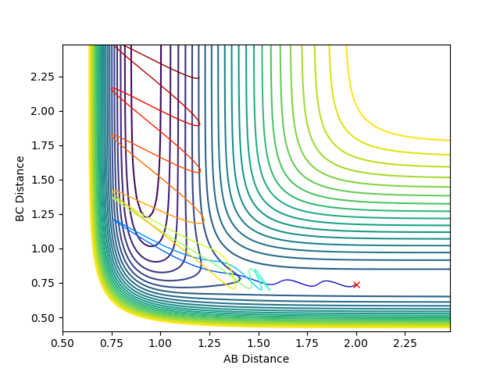 |
Qn: In light of the fact that energy is conserved, discuss the mechanism of release of the reaction energy. How could this be confirmed experimentally?
From all of the five conditions above, it can be observed that the initial oscillation of the trajectory is extremely small and the final HF molecule contains great vibrational energy, as seen from the large amplitude of the oscillation once the reaction completes. Reaction energy released as F approaches H2 becomes the motion in HF, the product vibration, whereas energy released as HF separates from H becomes the motion along the BC distance coordinate, the product translation. The HF vibrational energy can be determined using IR and analyse the frequency of the vibrational band. Translational energy of H atom can be confirmed by measuring the scatter of the products. The energy distribution can be measured by recording the infrared chemiluminescence of the reaction under "arrested relaxation".[4]
The above five conditions illustrate that a higher p1 (pFH) is always required for the reaction to be reactive, especially in Reaction 1 when p2 (pHH) is zero. Hence, one can assume that pFH, which corresponds to a high translational energy of the reactants, more effectively affects the reactivity of the reaction.
Reactivity with Variation of pHH
When rHH = 0.74 and momentum pFH = -0.5, values of pHH in the range from -3 to 3 were used for calculation. As pHH gets close to -3 or 3, barrier recrossing takes place and the reaction conditions render the reaction unreactive. Starting from pHH = -3, when pHH is greater than approximately -2.5, the reaction is reactive. When pHH reaches 1, or extremely close to 1, the reaction is unreactive and remains unreactive until pHH is above 1.5 and below approximately 2.4, although the reaction may be unreactive with pHH in between 1.5 and 2.4 (eg. 1.7 and 2.1). This shows that change in pHH can affect the reactivity of the reaction even with just a small change at constant pFH but there is no trend observed for whether the reaction is reactive or not.
However, increasing pFH slightly to -0.8, and reduce the overall energy of the system by reducing pHH to 0.1, the reaction is now reactive as shown in Fig 34. This means that a higher overall energy of the system does not mean that the reaction will be reactive, but a high pFH, which corresponds to a high translational energy, is required.

|
| Figure 33 - Contour Plot with pFH = -0.8 and pHH = 0.1 |
The reaction between F and H2 is highly exothermic with an extremely low activation barrier. The transition state is in the entrance valley, hence, an early barrier. Using the assumption from the five reactive conditions above ( pFH more effectively affects the reactivity of the reaction.) and observations from various pHH values, pFH does have a significant effect on the reactivity of the reaction.
H + HF
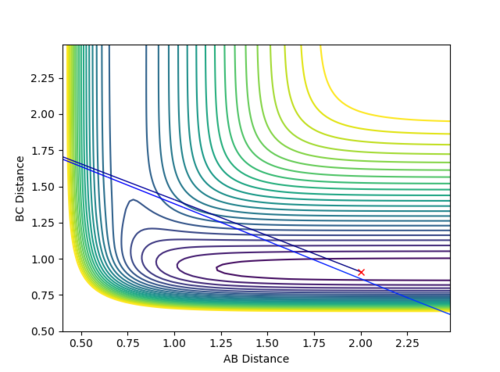 |

|
| Figure 34 - Contour Plot with pHH = -50.0 and pHF = 0.01 | Figure 35 - Contour Plot with pHH = -8.0 and pHF = 0.5 |
pHH = -8.0 is still very large. This complies with the high activation energy of this reaction as the products formed are thermodynamically less stable than the reactants. It can be concluded that an increase in pHF, which corresponds to a high vibrational energy in H-F coordinate, is necessary for the reaction to take place. pHH, which corresponds to the translational energy in the H-H coordinate that is always very large, does not contribute too much to affect the reactivity of the reaction.
The transition state is present in the exit valley, hence, a late barrier for this endothermic reaction. The reactivity of endothermic reactions is thus dominated by the vibrational energy of the system from the results above.
Conclusion from Reaction Dynamics
Qn: Discuss how the distribution of energy between different modes (translation and vibration) affect the efficiency of the reaction, and how this is influenced by the position of the transition state.
For substantial exothermic reactions, such as F + H2, the transition state is located in the entrance valley, corresponds to an early barrier of the PES. For substantially endothermic reactions, such as H + HF, the transition state is in the exit valley, corresponds to a late barrier. The favoured degree of freedom for barrier crossing in exothermic reactions would be translation. This means that the momentum of the approaching atom and the atom which it is going to collide with has a greater impact on the rate of the reaction (eg. F atom in F + H2 reaction). However, reagent vibration, which is related to the momentum of the two bonded atoms (eg. HF in H + HF reaction) in the colliding particles, would be most effective in enabling endothermic reactions to take place.[4] The above reaction results do agree with Polanyi's empirical rules. However, sometimes a small change in one of the momenta might change the reaction from reactive to unreactive. Hence, Polanyi's empirical rules are a guideline to describe general required excitation for exothermic and endothermic reactions, but unable to predict whether the reaction is reactive for a certain initial conditions.
(Overall, this is a pretty much perfect report. Very well done. Fjs113 (talk) 18:11, 28 May 2018 (BST))
References
- ↑ E. G. Lewars, Computational Chemistry (Springer Netherlands, Dordrecht, 2011; http://link.springer.com/10.1007/978-90-481-3862-3).
- ↑ T. Komatsuzaki, M. Nagaoka, Study on “regularity” of barrier recrossing motion. Journal of Chemical Physics. 105, 10838–10848 (1996).
- ↑ D. Dyson, Advanced Chemical Kinetics, World Technologies, 2012.
- ↑ 4.0 4.1 J. C. Polanyi, Some Concepts in Reaction Dynamics. Accounts of Chemical Research. 5, 161–168 (1972).

