
MRD:Ms12218
Molecular Dynamics Lab
Exercise 1: H - H - H System
Dynamics from the transition state region
On a potential energy surface diagram, the transition state is mathematically defined as the maximum on the minimum energy path, so ∂V(ri)/∂ri=0 (the gradient of the potential, or the first derivative, is zero). However, it is not a simple local maximum. The transition state is a saddle point which means that while it is a local maximum in potential energy with respect to reaction coordinates, it is also a local minima with respect to the orthogonal coordinates. Therefore, in order to distinguish the transition state saddle point from a local minimum of maximum, the second partial derivative should be computed: H = fxx(x0,y0)fyy(x0,y0)-fxy(x0,y0)2. If H < 0, then (x0,y0) is a saddle point but if H > 0, then (x0,y0) is either a local maximum or minimum.
Good description on the transition state (TS) but there is some confusion when distinguishing between the local minimum and the TS. The TS is the local maximum and you can distinguish between the local maximum and minimum using the second partial derivative of V(r1,r2) Sf3014 (talk) 20:50, 1 June 2020 (BST)
Trajectories from r1 = r2 : Locating the Transition State
The three atoms are the same (H) and therefore the transition state will be symmetric and the internuclear distances equal (r1 = r2). At the transition state point, as described above, the gradient of the potential is zero, and consequently a trajectory started exactly at the transition state, with no initial momentum, will remain there forever - this can be seen in the Contour Plot, where the trajectory is a single point. This means that the Internuclear Distances will not change (seen in the Internuclear Distance vs Time plot, showing distance as a constant) and the forces along r1 and r2 will be exactly 0 kJ mol-1 pm-1. Therefore to find the transition state position, different initial conditions with r1 = r2 and p1 = p2 = 0 g mol-1 pm fs-1 were tested to meet these provisions. The transition state was found when r1 = r2 = rts = 90.777 pm.
-
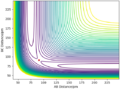 Figure 1ː Contour Plot showing a trajectory starting exactly at the transition state.
 -
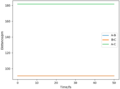 Figure 2ː Internuclear Distance vs Time for the Transition State
 -
 Figure 3ː The Transition State (H - H - H)


Good description on locating the TS Sf3014 (talk) 20:54, 1 June 2020 (BST)
Trajectories from r1 = rts + 1, r2 = rtsː The Reaction Path
The reaction or minimum energy path (mep) is a trajectory that corresponds to infinitely slow motion from the transition state to H1 + H2-H3. However, it does not provide a realistic account of the motion of atoms during a reaction.
With the MEP calculation, the trajectory of r1 is approximately constant, but with the dynamics calculation, it oscillates. This is because MEP does not take account of the vibrational energy of the forming molecule H2-H3 - real atoms do not move in infinitely slow motion, they vibrate.
Also with the MEP calculation, the trajectory of r2 (H1 atom moving away from the H2-H3 molecule) increases to ~ 200 pm, but increases infinitely with the dynamics calculation. This is MEP does not account for the fact that atoms have mass, and as a result, in the gas phase their motion will be inertial - constant motion.
Good but refer to your figures in your description. Also, where is the evidence that the mep does not account for mass? Some mention of the momenta in mep calculation before concluding your statement about mass would be clearer to the reader Sf3014 (talk) 21:03, 1 June 2020 (BST)
-
 Figure 4ː Contour Plot of the Reaction Path (Dynamics)
 -
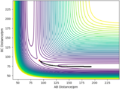 Figure 5ː Contour Plot of the Reaction Path (MEP)


If the initial conditions were changed to make r1 = rts, r2 = rts + 1, then the same process would occur, but H1-H2 would form the molecule, with H3 as the atom moving away.
By setting up a dynamics calculation where the initial positions correspond to the final positions of the previous trajectory with the same final momenta values but their signs reversed:
- r1 = 352.598374019175 pm p1 = - 5.06794069218826 g mol-1 pm fs-1
- r2 = 74.0408880639704 pm p2 = - 3.2038548324798097 g mol-1 pm fs-1
The trajectory then shows the opposite of the reaction path - the formation of the transition state from H1 and H2-H3. The contour plot shows this trajectory clearly, and the Internuclear Distances vs Time plot shows the formation of the transition state as r1 and r2 come to be equal.
-
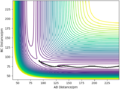 Figure 6ː Contour Plot of the Reverse of the Reaction Path (Dynamics)
 -
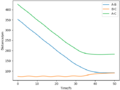 Figure 7ː Internuclear Distances vs Time for the Reverse of the Reaction Path


Reactive and Unreactive Trajectories
| p1 / g.mol-1.pm.fs-1 | p2 / g.mol-1.pm.fs-1 | Etot / kJ mol-1 | Reactive? | Description of the dynamics | Illustration of the trajectory |
| -2.56 | -5.1 | -414.280 | Yes | The trajectory shows the reaction path from H1-H2 + H3, through the transition state, to H1 + H2-H3. | 
|
| -3.1 | -4.1 | -420.077 | No | The trajectory shows H3 approaching H1-H2, however they do not react and H3 moves away again. The transition state is never formed. | 
|
| -3.1 | -5.1 | -413.977 | Yes | The H3 atom has more momenta than the previous example.
The trajectory shows the reaction path from H1-H2 + H3, through the transition state, to H1 + H2-H3. |

|
| -5.1 | -10.1 | -357.277 | No | The trajectory shows H3 approaching H1-H2 and even forming the transition state. However, though H2 and H3 interact, H1-H2 reforms once more, and H3 moves away again. | 
|
| -5.1 | -10.6 | -349.477 | Yes | The H3 atom has more momenta than the previous example. The trajectory shows the reaction path from H1-H2 + H3, through the transition state (with some interaction between H1 and H2), to H1 + H2-H3. | 
|
From the table, it is clear that it is not sufficient for just the momenta (kinetic energy) of the molecule (p1) to increase (i.e. from -3.1 to -5.1), the momenta of the atom (p2) needs to also be sufficiently high for a reaction to occur (i.e. -5.1 vs -5.6 and -10.1 vs -10.6). The atom must also have a larger momentum (more kinetic energy) than the molecule for a reaction to take place.
Good table layout. Your conclusion is poor because it doesn't address the trajectories that do not abide by the statements you made in your conclusion, ie in all cases p2 is greater than p1 and the trajectory isn't always successful and p2 doesn't have to be "sufficiently high" (not defined, what is high?) as seen in the first example given in your table Sf3014 (talk) 21:14, 1 June 2020 (BST)
Transition State Theory
Transition State Theory is a powerful theory to rationalise and calculate the rate of chemical reactions based on the properties of the reactants and the transition state structure. The main assumptions of transition state theory are as follows:
- Molecular systems that have crossed the transition state in the direction of the products cannot turn back and form reactant molecules again.
- The reactant molecules are distributed among their states in accordance with the Maxwell-Boltzmann Distribution.
- In the transition state, motion along the reaction coordinate may be separated from the other motions and treated classically as a translation, quantum effects being ignored.[1][2]
However, in reality, these assumptions are not always obeyed. Firstly, contrary to transition state theory, there are in fact a number of ways in which a system may re-cross a potential-energy surface. The penultimate set of conditions in the above table (p1 = - 5.1 g mol-1 pm fs-1 and p2 = - 10.1 g mol-1 pm fs-1) show a case of barrier recrossing - the system crosses the transition state region and a bond in the product forms, but then the system reverts back to the reactants. Multiple crossings of the transition state will inevitably decrease the rate of reaction, and thus as a result conventional transition state theory leads to overestimated reaction rates.[2]
Transition state theory assumes that motion across the transition state region can be treated as classical motion, but in reality, quantisation of motion introduces the possibility that the system may tunnel through the potential energy surface. When this occurs, the system does not need to have the activation energy, and therefore quantum tunnelling increases rate of reaction, particularly in reactions involved very light species such as H atoms.[2]
Transition state theory also simplifies motion on the potential energy surface to one-dimensional motion along the reaction coordinate, however, actual motion may include components normal to the reaction coordinate and the reaction path may lie above the minimum energy configuration - as a result, the effective activation energy may be somewhat higher than the barrier height. A larger activation energy will lead to a decreased rate of reaction.[1]
Overall, transition state theory will overestimate the rate because the energy barrier effects have a much larger contribution to the rate of reaction than quantum tunnelling (less significant).
Very good and clear description Sf3014 (talk) 21:23, 1 June 2020 (BST)
Exercise 2: F - H - H System
PES Inspection
By inspecting the potential energy surfaces, the reactions of a F - H - H system can be classified as follows:
- F + H2 → HF + H is exothermic: the reactants are higher energy than the products.
- HF + H → H2 + F is endothermic: the products are higher energy than the reactants.
From this, it can be concluded that HF is a stronger bond than H2. In the exothermic reaction, more energy is released forming H-F than used to break H-H. In the endothermic reaction, more energy is used to break H-F than is released forming H-H.
-
 Figure 8ː Surface Plot of the F-H-H System where A=F, B=C=H.

Good but how did you determine which direction was exo- and endo- thermic? refer to your figure 8 and describe how you reached that conclusion. Also, your comment on bond energies would benefit from published experimental values Sf3014 (talk) 21:27, 1 June 2020 (BST)
Transition State
As the F - H - H system is not symmetric, the transition state is not simply found where r1 = r2. However, it is still the case that at the transition state, the forces along r1 and r2 equal zero. The Internuclear Distances that satisfy these conditions are r1 = 180.1 pm and r2 = 74.488 pm, where r1 is the distance between F and H r2 is the distance between H and H. At this point, with no initial momentum, the trajectory is a single point.
Hammond Postulate:
- Exothermic = early TS, reactant-like.
- Endothermic = late TS, product-like.
-
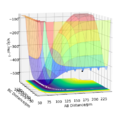 Figure 9ː Surface Plot with a trajectory starting exactly at the transition state.
 -
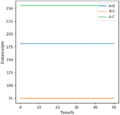 Figure 10ː Internuclear Distances vs Time for the Transition State


As seen in the surface plot, the transition state point is much closer to the reactants H2 + F. This can be explained with Hammond's Postulate: an exothermic reaction will have an early transition state that is reactant-like, and an endothermic reaction will have a late transition state that is product-like. H2 + F are the reactants of F + H2 → HF + H which is exothermic, and the products of HF + H → H2 + F which is endothermic.
Good but how did you find the distances for the transition state? Was it trial and error? What was your process? Did Hammond's postulate help you find the distances? More details required. Also, where did you get the information on Hammond's postulate? Reference Sf3014 (talk) 21:33, 1 June 2020 (BST)
Activation Energies
The activation energy for each reaction can be found by performing an MEP calculation from a structure neighbouring the transition state to find the trajectory that corresponds to infinitely slow motion from the transition state to the products.
To find the activation energy of the endothermic HF + H → H2 + F:
- r1 = rts - 1, r2 = rts so r1 = 180.1 pm and r2 = 74.488 pm.
- The trajectory shows the reaction path proceeding from the transition state to HF + H.
- By plotting energy against time for this trajectory, the potential energy difference can be found between HF + H (the reactants) and the transition state.
- Transition state potential = 433.981 kJ mol-1.
- Reactants (HF + H) potential = - 560.036 kJ mol-1.
- Therefore the activation energy for HF + H → H2 + F is 126.055 kJ mol-1.
-
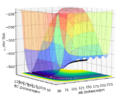 Figure 11ː Surface Plot with a trajectory of the formation of HF and H from the transition state, A = F, B = C = H.
 -
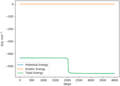 Figure 12ː Energy vs Time for the formation of HF and H from the transition state.


To find the activation energy of the exothermic H2 + F → HF + H:
- r1 = rts + 1, r2 = rts so r1 = 182.1 pm and r2 = 74.488 pm.
- The trajectory shows the reaction path proceeding from the transition state to H2 + F.
- By plotting energy against time for this trajectory, the potential energy difference can be found between H2 + F (the reactants) and the transition state.
- Transition state potential = 433.981 kJ mol-1.
- Reactants (H2 + F) potential = - 435.013 kJ mol-1.
- Therefore the activation energy for H2 + F → HF + H is 1.032 kJ mol-1.
- This is much smaller than the above reaction () reflecting the fact that this is an exothermic vs an endothermic reaction.
-
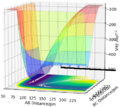 Figure 13ː Surface Plot with a trajectory showing the formation of H2 and F from the transition state, A = F, B = C = H.
 -
 Figure 14ː Energy vs Time, for the formation of H2 and F from the transition state.
 -
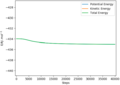 Figure 15ː Energy vs Time for the formation of H2 and F from the transition state.


Very good and clear description but refer to your figures Sf3014 (talk) 21:35, 1 June 2020 (BST)
Reaction Dynamics
Mechanism for the release of reaction energy for: F + H2 → HF + H
The initial conditions r1 = 175 pm, r2 = 74 pm, p1 = -1.6 g mol-1 pm fs-1, and p2 = 0.2 g mol-1 pm fs-1 resulted in a reactive trajectory for this reaction as seen in the contour plot below.
-
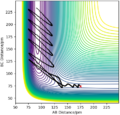 Figure 16ː Contour Plot with a trajectory showing F + H2 → HF + H, A = F, B = C = H.

Energy in the reaction is conserved, and the reaction energy is released into the vibrational mode of newly formed HF molecule - potential energy is converted into kinetic (vibrational energy) energy. This is clearly seen in the contour plot above by the extent of oscillation in HF which corresponds to vibration of the molecule.
This mechanism of release of reaction energy into vibrational energy can be confirmed experimentally with IR absorption spectroscopy. The formation of the H-F bond and release of reaction energy means that the HF molecule is vibrationally excited: a proportion of the molecules are in the 1st excited level. Therefore, there are two vibrational transitions available: 0 → 1, and 1 → 2, and we expect to see two peaks in the IR spectrum - a fundamental intensity (reflecting the 0 → 1 transition), and a hot band (reflecting the 1 → 2 transition between excited levels) at a lower frequency. The overtone has a lower frequency due to the anharmonicity of the interaction. As the molecule reverts back to the relaxed state, the overtone intensity will become weaker and the fundamental peak will increase in intensity. If the reaction energy was not released as vibrational kinetic energy, the overtone would not be seen and there would be only one peak in the IR spectra.
Another method of confirming the method experimentally is with IR emission spectroscopy (e.g. gas-phase FTIR). As the vibrationally excited molecules revert to the relaxed state, photons are emitted as electrons fall to the ground state - the energy of the photon is equal to the difference in energy levels, and therefore can be used to probe the electronic structure of the molecule (and confirm vibrational excitation - molecules in the ground state will not emit photons).
Good. This description on the experiment is missing how the result will be obtained as the reaction proceeds Sf3014 (talk) 21:41, 1 June 2020 (BST)
Polanyi's Empirical Rules
According to Polanyi's empirical rules, the distribution of energy between different modes (translation and vibration) required for a successful reaction, depends on the position of the transition state.
Exothermic reactions (F + H2 → HF + H) are characterised by an early transition state. An early energy barrier therefore occurs while the reactants are approaching each other. Translational energy is the most effective - a molecule with all its energy in motion along the reaction coordinate can easily overcome the energy barrier. Reactant vibrational energy, on the other hand, may be ineffective for reaction - a vibrationally excited molecule does not have enough energy left to reach the top of its barrier, and the vibrational motion does not allow the atom to simply fall into the reaction channel.[3][4]
Endothermic reactions (HF + H → H2 + F) are characterised by a late transition state. Vibrational energy in the reactants will be more effective than translational energy in overcoming the energy barrier. Vibrationally excited molecules with the correct phase can reach the top of the barrier, while molecules with rapid translational motion are repulsed by the inner wall of the potential surface.[3]
This is the core of Polanyi’s Rules - in general, vibrational energy is better at promoting an endothermic reaction and translational energy is better at promoting an exothermic reaction.
Example: F + H2 → HF + H (exothermic).
- Initial conditions: r1 = 225 pm, r2 = 74 pm, A = F, B = C = H.
- In the first trajectory, the molecule (H-H) has a large amount of vibrational energy (large oscillations). The trajectory is not reactive.
- In the second trajectory, the molecule (H-H) has a very small amount of vibrational energy (reduced momentum). The trajectory is reactive.
| p1 / g.mol-1.pm.fs-1 | p2 / g.mol-1.pm.fs-1 | Etot / kJ mol-1 | Reactive? | Description of the dynamics | Illustration of the trajectory |
| -1.0 | -6.1 | -402.845 | No | The trajectory shows F approaching H-H and even forming the transition state. However, H-H reforms once more, and F moves away again. | 
|
| -1.6 | -0.2 | -434.482 | Yes | The trajectory shows the reaction path from F + H-H, through the transition state, to F-H + H. | 
|
Very good description. What about the endothermic reaction? Sf3014 (talk) 21:45, 1 June 2020 (BST)
References
- ↑ 1.0 1.1 J. I. Steinfeld, J. S. Francisco, W. L. Hase, Statistical Approach to Reaction Dynamics: Transition State Theory, Chemical Kinetic and Dynamics, 2, Pentice-Hall, 1998, 287 - 391.
- ↑ 2.0 2.1 2.2 K. J. Laidler, Conventional Transition-State Theory, Chemical Kinetics, 3, Harper-Collins, 1987, 89-94.
- ↑ 3.0 3.1 J. I. Steinfeld, J. S. Francisco, W. L. Hase, Experimental Chemical Dynamics, Chemical Kinetic and Dynamics, 2, Pentice-Hall, 1998, 272 - 274.
- ↑ K. J. Laidler, Reaction Dynamics, Chemical Kinetics, 3, Harper-Collins, 1987, 460-469