MRD:MolecularReactionDynamicsas11815
H + H2 system Analysis
Dynamics from the transition state region
The potential energy surface plot of a reaction is a function of the potential energy surface as a function of the reaction coordinate. Any minimum or at any maximum What do you mean???--Sw2711 (talk) 10:14, 1 June 2018 (BST)- the transition state; also known as the saddle point, that corresponds to the transient state of a reaction coordinate, at this point, both derivatives with respect to the transition state will be zero. In this reaction, ∂V(ri)/∂i=0 was used to find the minima and transition state. The two can be differentiated from the second derivative.
where x and y = critical points and z = the derivative of the critical points. Why is z the derivative? Is it not the value of the function, in this case the energy? -- João (talk) 12:35, 2 June 2018 (BST)
If, ∆ > 0 then the point will be a saddle point. If ∆ < 0 and (∂2z)/(∂x2) > 0 then the point will be a local minima. [1]
I can see where you are coming from. But you haven't really explained to me why this test works. Please have a look at this video. This video explains your test here well. link --Sw2711 (talk) 10:17, 1 June 2018 (BST)
Locating the transition state
The gradient of the potential energy surface at the transition state is zero. This means the net force acting on the hydrogen molecule must also be zero. The system has no kinetic energy and all kinetic energy is converted to potential energy I am not sure what you mean. No kinetic energy and all kinetic energy is converted to potential energy? --Sw2711 (talk) 10:31, 1 June 2018 (BST)– thus we are looking at the highest potential energy point. Additionally, no net force means the momentum is zero.
The reason to look for the transition state this way is that, the TS point is a saddle point - a stationary point. It means, if you place your system at that point with no momenta, it shouldn't move at all. --Sw2711 (talk) 10:31, 1 June 2018 (BST)
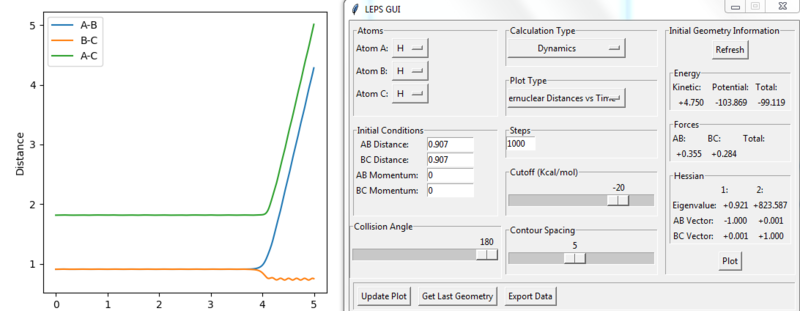
For the H+ H2 symmetric system, the transition state will occur when the r1 = r2. The value of this was found using GUI software by testing different constant bond distances and initial momentum of zero, so the molecule has no energy to escape the minimum potential well, It is not really a minimum potential energy well. It is not a well. It is a saddle point. It is the minimum at the potential energy valley, but it is the maximum at the reaction coordinate. --Sw2711 (talk) 10:31, 1 June 2018 (BST)to find that r1 = r2 = 0.907 Å was the best approximate match for a flat distance vs time plot (Figure 1). When there are no oscillations, it is confirmed that the molecule does not move and this must be the transition state.
MEP and Dynamic Pathways: Calculating the reaction path
The minimum energy path (MEP) is the lowest energy pathway from reactants to products. This is the most likely mechanism to occur. In this part, the GUI is set as r1=rts+0.01=0.9175, r2= rts=0.9075, zero momenta and it is found that depending on the calculation used – MEP or Dynamics, two different trajectories are obtained.
Countour plots: From Figure 3 it can be seen that MEP the line is not wavy because it represents the gradient of the surface at a point. However, for the Dynamics calculation (Figure 2), the reaction path for the plot is wavy indicating that the vibrations of the diatomic molecule match the inertial trajectory in which the molecule does oscillate. As a result of this, in the MEP plot the reaction doesn’t go to completion whereas in the Dynamics plot it does.
You are right about MEP represents the gradient of the surface at a point. More of like the system will follow the gradient. But no oscillation is not the reason to say MEP doesn't go to completion. And what do you mean by not go to completion? The black trajectory line doesn't reach the end of the channel? --Sw2711 (talk) 10:34, 1 June 2018 (BST)
 |
 |
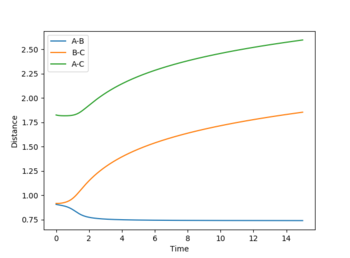
Internuclear distance vs time plots: In the MEP plot (Figure 5), all the bond distances are initially constant. The internuclear distance however, decreases as the A-B bond forms during the first 2-3 s and then reaches plateau once the bond is completely formed. Likewise, B-C and A-C internuclear distances gradually increase as these bonds break. For the dynamic plot (Figure 4) it can be seen that for a constant A-B, the B-C and A-C internuclear distances increase exponentially. (It appears linear as it is a very small range plotted on graph)
 |
 |
If the initial conditions are changed to r1 = rts and r2 = rts +0.01, the reverse reaction pathway is calculated as the internuclear distance vs time (Figure 6) and momenta vs time (Figure 7) graphs reverse in sign. Figure 8 shows the internuclear momenta vs time with initial conditions. These are the final positions of the trajectories for which A collides with B-C to form A-B + C but because the internuclear distance and momenta vs time graphs oscillate it shows A-B + C is reversible with A + B-C. So the forward and reverse reactions happen sequentially.
Reactive and Unreactive Trajectories
When a system has enough energy to overcome the activation barrier towards the transition state, the reaction is considered to go to completion. With constant initial positions of r1 = 0.745, r2 = 1.805 and varying momenta, the dependence of the reactivity of reaction pathway on momenta values are investigated.
This part is good--Sw2711 (talk) 10:37, 1 June 2018 (BST)
| p1 | p2 | Total energy (kcal/mol) | Contour plot | Reactivity |
|---|---|---|---|---|
| -1.25 | -2.5 | -99.018 |  |
Reactive: The trajectory is reactive. The reaction path starts at the reactants and channels towards the products, where it ends. Initially, the H2 molecule oscillates much less than the new A-B molecule formed. This suggests a lot of H-H bond potential energy is converted to kinetic energy of H-F during the reaction. |
| -1.5 | -2.0 | -100.456 |  |
Unreactive: The reaction path begins at the reactants but then oscillates back to the initial point before it can surpass the transition state. The reaction path corresponds to vibrating atom A approaching the lower vibrational B-C, which begins to vibrate as well. During this vibrational energy transfer the reactants interact such as to reach an energy near the A—B—C transition state but as there is not enough energy to form the transition state completely, so the complex reverses back to A and B-C reactants. |
| -1.5 | -2.5 | -98.956 |  |
Reactive: This is reactive. The vibrations of both initial A and B-C are more visible than the first example. This is due to the higher momentum B-C is given so it the initial oscillation of B, as well as the total vibrational energy during the reaction, is higher. |
| -2.5 | -5.0 | -84.956 | 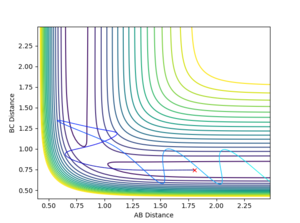 |
Unreactive: Compared with the second example, the higher momentum means there is a higher vibrational energy - clearly indicated by the increased oscillations. However, although the vibrational energy may be enough to overcome the activation barrier of the transition state, the reaction pathway recrosses the transition state towards the reactants. This is because there is not enough translational energy and there needs to be a combination of both vibrational and translational energy for the energy barrier to be overcome. |
| -2.5 | -5.2 | -83.416 |  |
Reactive: This is similar to the first and third example, there is enough vibrational and translational energy to overcome the transition state. But is it actually similar to first and third example, just because it is reactive?--Sw2711 (talk) 10:37, 1 June 2018 (BST) |
The main assumptions of transition state theory are :
1) The activated complex is in quasi-equilibrium with the reactants only and not the products.
2) The reactant nuclei are assumed to obey classical mechanics. This comes from the Born-Oppenheimer approximation of separating nuclei and electron motion due to nuclei being much heavier. As quantum mechanical pathways such as the lower energy tunneling is ignored, so transition state theory may overestimate the activation barrier, and falsely claim that a reaction is unreactive.
3) The reaction pathway must pass through the transition state on a potential energy diagram. This assumes that the reactant molecules follow Boltzmann distribution, which assumes that within the time of the reaction the system has reached thermal equilibrium. For high temperatures, population of higher energy states may be possible for which the transition state theory would also overestimate the activation barrier. [2]
I think the term ‘equilibrium’ is not very applicable here. ‘equilibrium’ is mainly used in statistical thermodynamics. So like…thinking about a reaction A+B<=>C. Statistically speaking there is 80% molecules in this system reacts from the left to the right and 20% the other way around. (about obviously you should think about more like a Boltzmann distribution ). This reaction has reached an equilibrium. But in terms of your system, there are only 3 atoms. So, it is either one way or the other. --Sw2711 (talk) 10:38, 1 June 2018 (BST)
Also, does the TST predicts your tests well? Do you agree or disagree with TST?--Sw2711 (talk) 10:38, 1 June 2018 (BST)
EXERCISE 2: F-H-H and H-H-F systems
PES inspection
The endothermic/exothermic nature of the the following reactions are direct consequences of: H-H bond enthalpy = 104 kcal/mol H-F bond enthalpy = 136 kcal/mol [3]
The high electronegativity difference gives H-F a partial ionic character, making it stronger and more energetically stable.
F+H2 are found to react exothermically: The reactants are in a higher energy state than the products. This is a direct consequence of the more energetically stable bond of H-F in comparison with H-H. The enthalpy of formation of the more stable and thus, more negative value of H-F compared with the more positive dissociation energy associated with H-H leads to an overall negative energy change. Energy flows out of the system.
H and HF react endothermically: The reactants are in a lower energy state than the products. This is a direct consequence of the more energetically stable bond of H-F in comparison with H-H. The enthalpy of more positive enthalpy of dissociation of the stronger H-F bond is not compensated for by the smaller negative value formation of H-H. Energy flows out of the system.
For this part, I need some evidence. How did you know the reactants are higher energy for H+H2 system, for example?--Sw2711 (talk) 10:40, 1 June 2018 (BST)
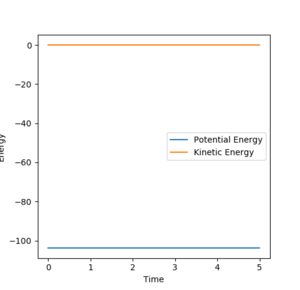
The approximate position of the transition state can be located using Hammond’s postulate which states that the transition state of a reaction will resemble either the reactants or the products depending on which one it is energetically closer to. Thus, for exothermic reactions (F+H2) it will resemble the reactants and for endothermic reactions (H+HF) it will resemble the products. In the case of these reactions, the transition state corresponds to H-F-H complex which will always be closer to the H-H bond as it is higher in energy. Bond distances close to this energy were tested so that the contour plot showed no oscillations (Figure 14) and the energy plot (Figure 15) showed relative kinetic energy of zero compared with the total energy of the system because the system will be at its maximum potential energy. The transitions state values that best match this were found to be H-F = 0.74631 Å and H-H = 1.81009 Å. he transition state for the H + HF would also be the same as both reactions form the same [H-H-F]‡ complex. Thus it is expected that H-H = 0.74631 Å and H-F = 1.81009 Å also correspond to the transition state for the F+H2 reaction and this is confirmed from the plots. (Figure 16) and (Figure 17).
This part is good.--Sw2711 (talk) 10:40, 1 June 2018 (BST)
The activation energy is the difference in energy between the maximum of the transition state and the minimum of the reactants. In order to find the maximum energy change, the reactant energies were deviated slightly from the transition state bond lengths so that MEP calculations could be carried out to find the activation energy. For the plots shown below, H-F = 0.75 Å and H-H = 1.71 Å

The transition state was found to occur at -103.7 Kcal/mol
Activation energy = energy of transition state – energy of reactants
F+H2 reaction: Activation energy = -103.7 Kcal/mol – (-104) = 0.3 Kcal/mol
HF+H reaction: Activation energy = -103.7 Kcal/mol – (-136) = 32.3 Kcal/mol
Good, how did you get the energy -104? I need some evidence.--Sw2711 (talk) 10:41, 1 June 2018 (BST)
Reaction dynamics
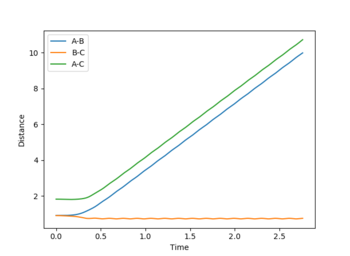
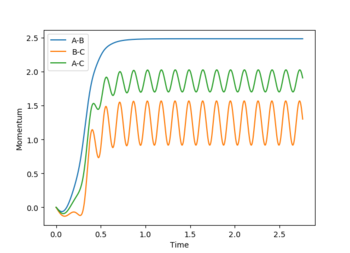
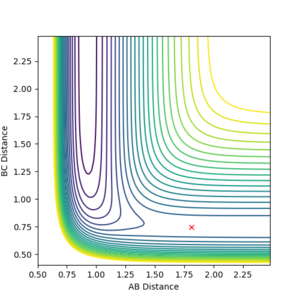
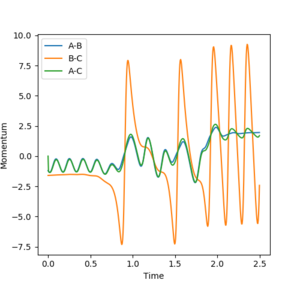
The initial conditions that result in a reactive trajectory for the F+H2 were found to be: r1 =0.76, r2 = 2.1, p1 = -1.2, p2 = -1.6. At the start of the reaction, the H-H molecule, (represented by B-C on the plot), oscillates. After collision, the reaction occurs and the H-F bond that is formed (represented by A-B on the plot) oscillates continuously. By the law of conservation of energy, the energy released in the exothermic reaction is converted from potential energy to kinetic energy. This can further be seen on the internuclear momenta vs time graph where the product H-F molecule’s oscillations are of a higher amplitude than H-H. The higher vibrational motion of H-F can be experimentally using several methods. IR spectroscopy can be used to check that H-F shows overtone bands due to the higher vibrational energy. Calorimetry can be used to calculate changes in enthalpy as a function of reaction coordinate. Emission spectroscopy to determine the photons released by vibrational molecules could further be used to determine vibrational energies.
This part is good. --Sw2711 (talk) 10:42, 1 June 2018 (BST)
 |
 |
Polanyi’s empirical rules
In order for a chemical reaction to occur, the reactant must overcome the activation barrier of the transition state to form the products using its translational and vibrational energies. Polanyi’s Empirical Rules state that translational energy is more effective than vibrational when promoting an early transition barrier, whilst vibrational energy is more effective than translational energy when promoting a late transitional barrier. [5]
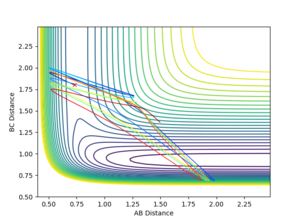
The F+H2 is exothermic and found to have an early transition state by Hammond’s postulate, so an increase in translational energy would be expected to have a larger effect than vibrational energy on the reactivity. The surface plot obeys Polanyi’s rules as p1 = vibrational energy (low) = 2.0, and p2 = translational energy (high) = -5, produces a reactive reaction (Figure 21), whereas as p1 = vibrational energy (high) = 6, and p2 = translational energy (low) = -2, produces an unreactive reaction (Figure 22). Thus, it is confirmed that high translational energies result in successful exothermic reactions.
This comparison is good.--Sw2711 (talk) 10:44, 1 June 2018 (BST)
 |
 |
The HF+H is endothermic and found to have a late transition state by Hammond’s postulate, so an increase in vibrational energy would be expected to have a larger effect than translational energy on the reactivity. Thus, the exact opposite would be observed compared with F+H2
Would be interesting to see some tests here. --Sw2711 (talk) 10:44, 1 June 2018 (BST)
References
- ↑ C. M. Bender and S. A. Orszag, Advanced Mathematical Methods for Scientists and Engineers I: Asymptotic Methods and Perturbation Theory, Springer New York, 2013.
- ↑ P. Atkins, J. de Paula, Atkins' Physical Chemistry, Oxford University Press, 2014, 894-902
- ↑ http://www.cchem.berkeley.edu/rsgrp/groupsheets/bondenergies.pdf
- ↑ “Organic Chemistry”, Clayden, Greeves, Warren and Wothers, (Oxford University Press, 2001)
- ↑ Theoretical Study of the Validity of the Polanyi Rules for the Late-Barrier Cl + CHD3 Reaction Zhaojun Zhang, Yong Zhou, Dong H. Zhang, Gábor Czakó, and Joel M. Bowman The Journal of Physical Chemistry Letters 2012 3 (23), 3416-3419 DOI: 10.1021/jz301649w

