MRD:MolecularReactionDynamics01523148
On a potential energy surface diagram, how is the transition state mathematically defined? How can the transition state be identified, and how can it be distinguished from a local minimum of the potential energy surface?
The transition state is mathematically defined by ∂V(ri)/∂ri=0, which r value represents the distance between atoms.The transition state can be identified at the position between maximum and minimum on the Potential Energy Surface and also by finding out the energy value around the trajectory from the contour plot.
Good but more details needed, like how can you distinguish between the transition state and the local minimum? Also, your reference to the plot below is not clear Sf3014 (talk) 22:54, 21 May 2020 (BST)
Report your best estimate of the transition state position (rts) and explain your reasoning illustrating it with a “Internuclear Distances vs Time” plot for a relevant trajectory.
The best estimate of the transition state position is around 90.775pm as it has no F and oscillation between each atoms as there is no oscillation occurs from the internuclear distance vs time plot. This means the picture captured is the transition state.
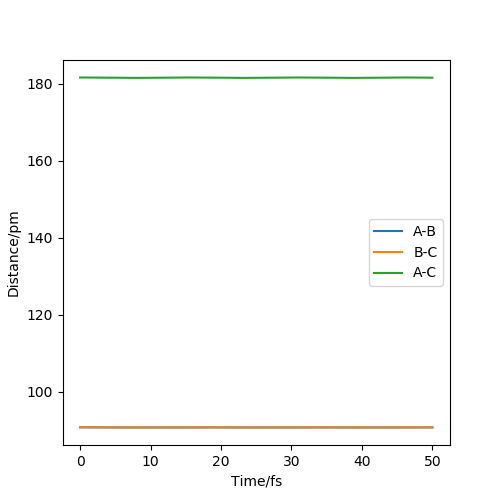
Good but how did you get to this value for your distance and is this equal for both r1 and r2? Stating that there is no F is not an explanation Sf3014 (talk) 23:01, 21 May 2020 (BST)
Comment on how the mep and the trajectory you just calculated differ.
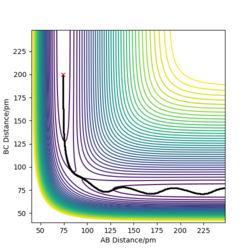
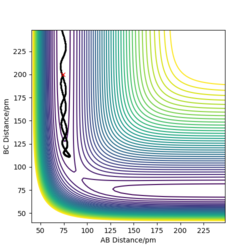
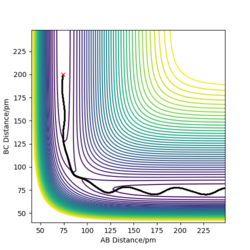
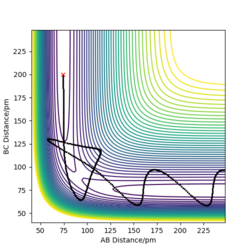
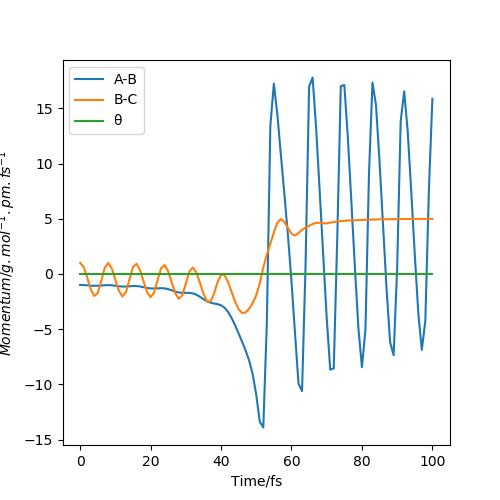
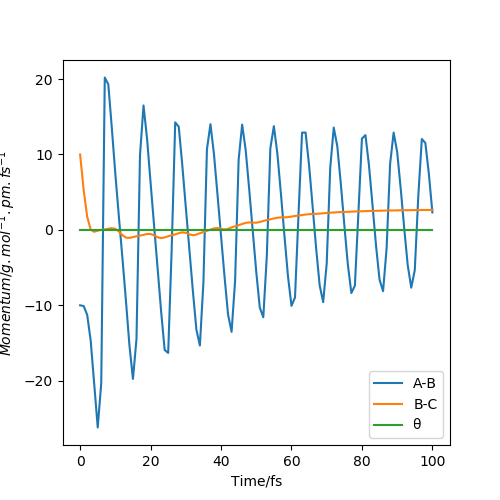
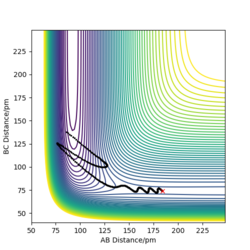
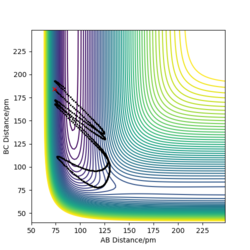
From the images below, using r1 = rts+δ, r2 = rts, with δ=1. The MEP and dynamics calculation types are compared.
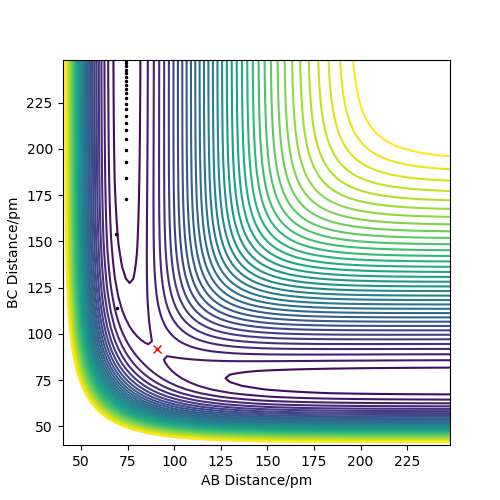 Dynamics contour plot
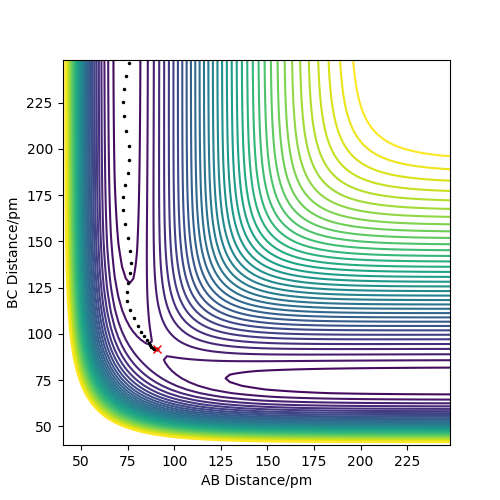 MEP contour plot
From the pictures above, it shows that dynamics include the calculation of oscillation of bonds as from the Dynamics contour plot we can see there is oscillating curve around B-C distances. This means dynamics calculation involve calculation of vibrational energy, while no kinetic energy will be accounted in MEP calculation.
Yes the vibrational energy is not a factor in the mep calculation, but what shows that the kinetic energy is zero? You should refer to your momenta vs time graph Some mistakes in your labeling for above plots. Also, refer to your plots Sf3014 (talk) 23:09, 21 May 2020 (BST)
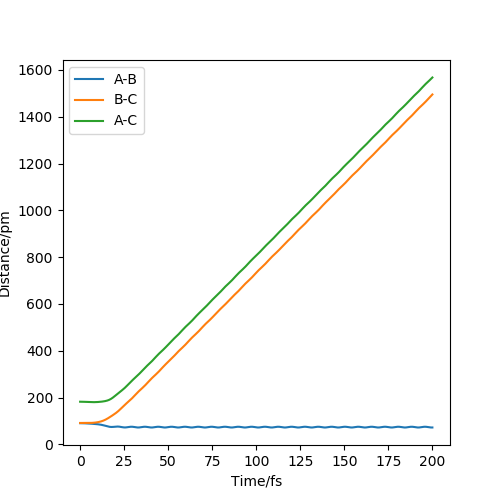 Internulcear Dynamics plot
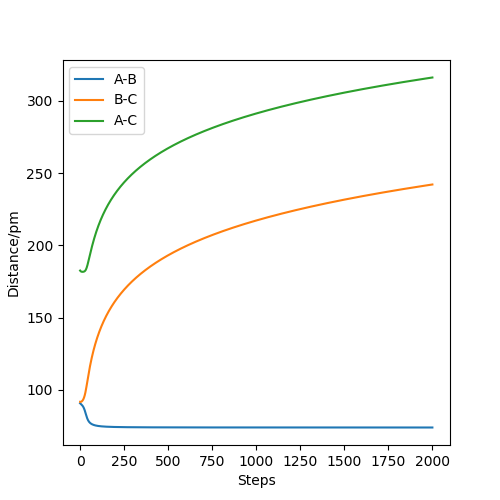 Internuclear MEP plot
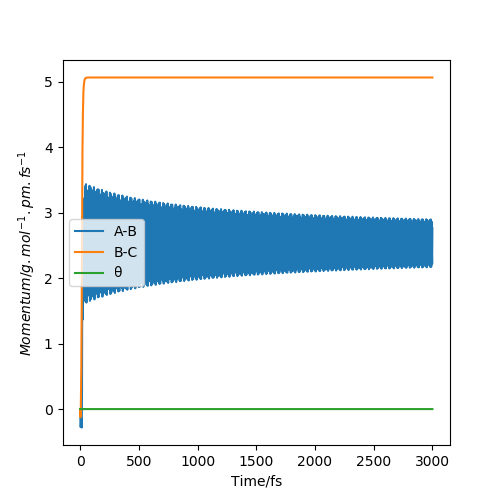 MomentaVsTime Dynamics plot
 MomentaVsTime MEP plot
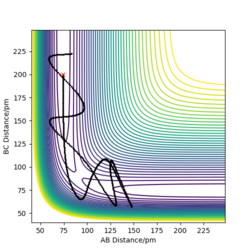
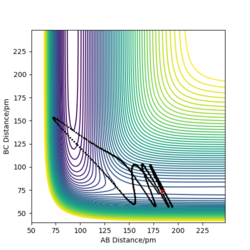
Complete the table above by adding the total energy, whether the trajectory is reactive or unreactive, and provide a plot of the trajectory and a small description for what happens along the trajectory. What can you conclude from the table?
Good descriptions but what can you conclude from this table? Sf3014 (talk) 23:13, 21 May 2020 (BST)
Given the results you have obtained, how will Transition State Theory predictions for reaction rate values compare with experimental values?
Transition state theory treats reaction classically such that quantum tunnelling cannot occur. Also energy must obey Boltzmann distribution rule. There is always equilibrium between reactants and transition state. All systems that have already crossed the TS region cannot recross the areas from product back to reactants. Therefore the reaction rate values from TST prediction is expected to be greater than experimental values (like scenario 5 above) if any quantum effect like barrier-recrossing. Although sometimes tunnelling might occur that give underestimate value compared to experimental one because the reaction don't need to overcome the energy barrier then. However, the recrossing barrier effect usually dominates over that of tunnelling effect, therefore mostly overestimate of reaction rate values happens.
Good but what is "scenario 5"? there are no numbered "scenarios". Your need to be clearer And for good practice, it is best to define abbreviations before using them ie transition state theory (TST) Sf3014 (talk) 23:25, 21 May 2020 (BST)
Exercise 2: F-H-H system
PES inspection
By inspecting the potential energy surfaces, classify the F + H2 and H + HF reactions According to their energetics (endothermic or exothermic). How does this relate to the bond strength of the chemical species involved?
F+H-H reaction is exothermic while H+H-F is endothermic. Since enthalpy of HH is +436 kJ/mol while HF is +562 kJ/mol, the formation of HF is exothermic as the energy released from H-F formation is greater than H-H breaking, vice versa. From PES, it proves the classification as from the (F+H2) PES, the potential energy along reaction is actually lower than that of (H+HF) inspection.
Yes but your description is unclear you need to define A, B and C for your figures and are those bond enthalpies? Where did you get them from? A reference for this would be good Sf3014 (talk) 23:30, 21 May 2020 (BST)
 PES plot of H+HF
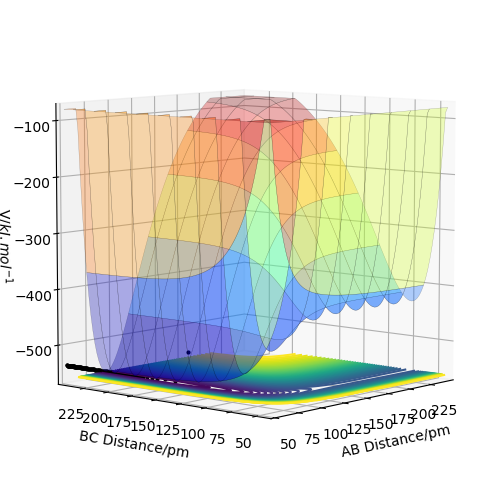 PES plot of F+HH
Locate the approximate position of the transition state.
Endothermic reaction means the late transition state resembles the products meanwhile exothermic reaction resembles early transition state which is the reactants. Hence from (F+H-H) reaction, the exothermic reaction allows us to predict the transition state is around 74pm, which is the bond length of H-H, in one of the internuclear distances.
Through trial and error, AB=181.1pm and BC=74.4875pm allow us to obtain the transition state, with potential energy of -433.981.The internuclear distance plot by MEP below shows that no oscillation occurs around and hence confirm the capture of transition state.
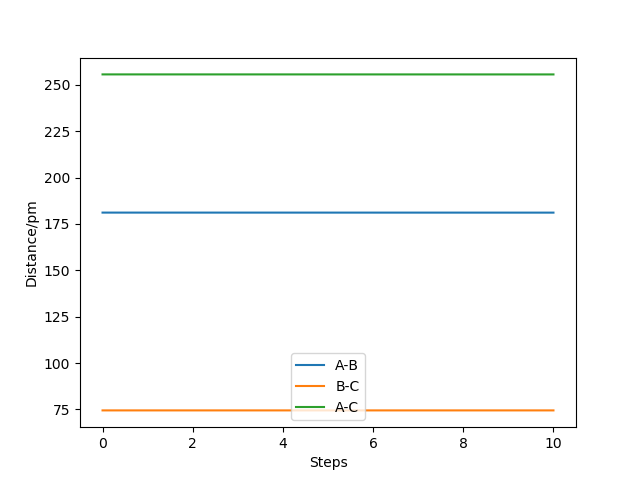
Very good but why does an endothermic reaction mean a late transition? When you are certain of something you need to explain your certainty Sf3014 (talk) 23:34, 21 May 2020 (BST)
Report the activation energy for both reactions.
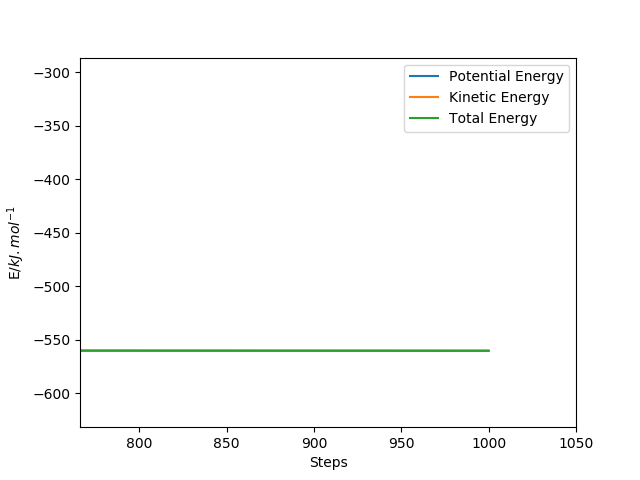
Energy of transition state - Energy of reactants = activation energy. Since the transition state energy was found from above, the energy of reactants can be found from the following image, using 185pm AB and 50pm BC, with 1000number of steps and 0.15fs of size. The picture below depicts how energy transforms throughout the (F+H2) reaction. There are two energy states captures in the graph because there are two flat lines in the reaction observed. The first flat line shows the energy of -434.751 kJ/mol, which is energy of these two reactants combined (F+H2), meanwhile the second flat line shows the energy of -559 kJ/mol, which resembles the energy of the products (H+HF).
Therefore, the activation energy of H+HF endothermic reaction is -433.981-(-434.751)=+0.77kJ/mol
The activation energy of F+HF exothermic reaction is -433.981-(-559)=+125 kJ/mol
 The energy state of reactants(H+HF)
 The energy state of reactants(F+H2)
Good work Sf3014 (talk) 23:38, 21 May 2020 (BST)
In light of the fact that energy is conserved, discuss the mechanism of release of the reaction energy. Explain how this could be confirmed experimentally.
Momentum of F-H is dependent on the rate of reaction, as supported from the plots below. This explains that the reaction energy is released as kinetic energy, more specifically, translational and vibrational form of kinetic energy. Since kinetic energy can convert into form of heat, heat can be measured by calorimetry, using E=mc(dT). IR spectroscopy and vibrational spectroscopy can also measure the vibrational kinetic energy absorbed from the bond oscillation of HF, with IR measuring the transition from ground state to excited state while vibrational spectroscopy measuring the overtones of peaks in the spectra(e.g.0-->1,1-->2,1-->0).
Description is needed on your plots you cannot rely on them you do all your talking because it is not clear why your first statement means energy is released as kinetic energy. Also, describe the experiments, how will you use IR spectroscopy as the reaction is taking place? And what kind of calorimetry? How will you obtain your data? Sf3014 (talk) 23:56, 21 May 2020 (BST)
AB=184pm,-1g.pm/fs.mol, BC=74pm,1g.pm/fs.mol
AB=184pm and -5g.pm/fs.mol, BC=74pm,5g.pm/fs.mol
AB=184pm and -10g.pm/fs.mol, BC=74pm, 10g.pm/fs.mol
Discuss how the distribution of energy between different modes (translation and vibration) affect the efficiency of the reaction, and how this is influenced by the position of the transition state.
Polanyi's empirical rule states that the translational energy is more effective than vibration energy in overcoming an early transition state barrier, and vibrational energy is more effective than translational energy when overcoming a late transition state region.
From exothermic (F+H2) reaction, it resembles early transition state barrier. Therefore, from the images below, with increasing momentum and decreased energy of H-F vibration, the greater proportion of translational energy is more likely to overcome the transition energy barrier.
From endothermic(H+HF) reaction, the late transition state barrier is resembled. The smaller proportion of p1 to p2 ratio will be more likely to form reactive trajectory because transition state barrier is more likely to be overcame by increased proportion of vibration energy.
all scenarios with r1=184pm, r2=74pm, scenario 1&2 with atom A=F and atom B&C=H, while scenario 3&4 with atom A&B=H and atom C=F
Good effort but you need to be clearer in your description. You switch from one term to the next in your paragraph (above table) when you talk about p1 and p2 or translational and vibrational but don't actually link the two. Your table has a good layout but your "scenarios" are not labeled. Also, you should reference your statement about Polanyi's rules Sf3014 (talk) 00:12, 22 May 2020 (BST)


