
MRD:MToth96
Collision of H2 and H
Q1 Potential Energy Surface
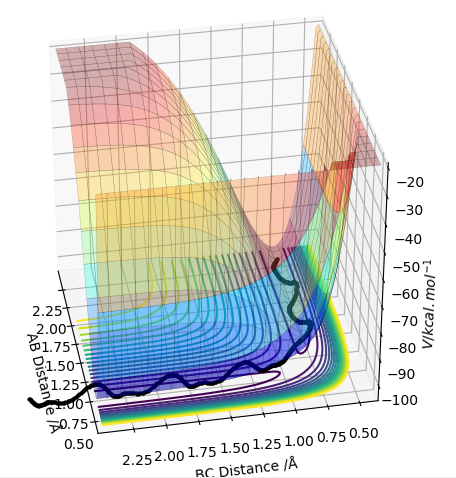

On a potential energy surface (see above), the transition state is found and defined as the point where it is true that ∂V(ri)/∂ri=0, and ∂V2(ri)/∂ri2>0. Empirically, the gradient of the surface is hence equals zero. Looking at the surface plot, the kinetic energy surface, as a function of AB distance has a curvature that describes the potential energy as a function of distance. The transition state is at its minimum, as the distances are in balance. Also, the trajectory (see black line) has to have its maximum value at the transition state, as we are expecting an energy maximum at this point. The transition state is the highest point along the trajectory. At this point, AB and BC are also equal. After the second differentiation, a local maximum is found if the derived value is positive. It is distinguished from other local minima by implementing the following criterium: ∂V/dq1 = 0 and ∂V/dq2 = 0, where q1 is the tangent to the minimum and q2 is orthogonal to this as well as to the reaction path. Hence, ∂V2/dq12 < 0 and ∂V2/dq22 > 0 for that point.
This isn't quite correct. The transition state is both a maximum and a minimum, in different directions. In the direction of the minimum energy trajectory (i.e. the path the black line follows) it is a maximum. The second partial derivative of a maximum is always negative. Therefore the second partial derivative of the function of the PES in the direction of the reaction trajectory will be negative. However, as the TS occurs on the minimum energy pathway, this point is also a minimum, but in a direction orthogonal to the reaction trajectory. Therefore, as the second partial derivative of a minimum is always positive, the second partial derivative of the PES at the TS in the direction orthogonal to the trajectory will be positive. Rk2918 (talk) 12:04, 28 May 2019 (BST)
Q2 Locating Transition States
When the transition state is reached, both the AB and BC distances are equal. Atoms show no vibration and therefore the graph displays no straight lines in accordance with this observation. The optimal distance was found to be 0.908 Å, at which both AB and BC distances were equal. Also, the momentum for both p1 and p2 were set to zero. The Intermolecular distanced vs Time plot is shown below (on the left). The aim was to minimise oscillation and obtain flat lines with no corresponding gradients. No vibration means no change in distance and the vibration of the H atom and molecule is restricted. A restriction in vibrational freedom means that the TS is reached. Moreover, the BC and AB distances are equal and the corresponding lines are on top of each other. A static picture of the animation of the transition state can be seen below (on the right)
 .
. 
Q3 MEP and Dynamic Trajectory
 .
. 
The trajectory is displayed as the black line along the bottom of the surface plots (see above. When the MEP calculation (on the left) is used, the line starts from the transition state but is only displayed for a short length. Whereas, the dynamic calculation (on the right) gives a much longer, complete black trajectory. The program tries to find the steepest descent along the potential energy surface to obtained a minimum. The MEP method is being reset to zero after every step, whilst with dynamic calculation the data is being carried further to the next step. Hence, the calculation is being carried on regardless, whereas with MEP the kinetic energy stays at its minimum. Thus, an oscillating line with the dynamic, and a local maximum with the MEP calculation is being observed.


For comparison, values of interatomic distances were changed (see above. Values were being shifted from r1=ts+0.01, r2=ts (on the left); to r1=ts and r2=ts+0.01 (on the right) In both cases, it was observed that the lines corresponding to the AB and BC distances were exchanged (as expected). When the numbers got changed, the transition state was approached by the opposite direction - as a symmetrical system is being considered - and the values are exactly the same but opposite. Hence, the same plot was displayed in the opposite direction. The same variations were applied for Momenta vs Time plots. The observations are exactly the same as for the distances, with the position of the lines being exchanged in between. The initial values are displayed below on the left, whereas the changed values can be seen on the right.


Q4 Reactivity through trajectory analysis
| p1 | p2 | Etot (kcal.mol-1) | Reactive? | Description of the dynamics | Illustration of the trajectory |
|---|---|---|---|---|---|
| -1.25 | -2.5 | -99.018 | Yes | A-B oscillates, B and C bond formation | 
|
| -1.5 | -2.0 | -100.456 | No | A-B oscillates, no reaction | 
|
| -1.5 | -2.5 | -98.956 | Yes | A-B oscillates, B and C bond formation | 
|
| -2.5 | -5.0 | -84.956 | No | A-B oscillates intensely, B and C bond formation is expected, but it bounces off and C remains a single atom | 
|
| -2.5 | -5.2 | -83.416 | Yes | A-B oscillates intensely, very close transition state, B and C bond formation | 
|
(Table 1)
From the table above it was concluded that the E total of the system depends on the momentum. Moreover, it shows a correlation with the kinetic energy of the system. The potential energy is constant and the kinetic energy is changing in response the structural changes. Furthermore, the system's susceptibility to undergo a reaction is also dependent on the momentum (not just on energy). If there is a large momentum difference between the single atom and the H2 molecule - especially when the incoming atom's momentum is marginally lower - than the reaction will not happen.
Q5 Transition State Theory
Transition State theory[1] is a way of describing chemical reactions as such that the reaction consist of atoms and molecules are subjected to a continuous change in the energies and positions. The transition state is being described as the position along the reaction path where the energy is at its maximum. The activation energy corresponding to a specific reaction and to its reactant is the energy necessary to initiate collisions sufficient to reach the transition state. It is calculated as the difference between the reactants and the transition state. The transition state or activated complex is in equilibrium with the reactant and hence its properties can be approximated using Hammond's postulate. Moreover, the rate if reaction - formation of products - can be approximates from the concentration of these activated complexes and their ability to go to completion.
Furthermore, the transition state theory can also be applied to the quasi-equilibrium state. The reactants are in equilibrium with the transition state complex. This means that an equilibrium is always established in between the reactant and the activated complex regardless of the relationship of the reactant and the product (if they are in equilibrium). This part of the theory can be materialised in the form of a mathematical expression through the Van Hoff equation. The equation describes an equilibrium state, which is reversible and temperature dependent.
where, K - eq. constant, T - temperature in K, U - internal energy, R - gas constant
In order to get the temperature dependence of reaction rates, the equation is derived and as a result the Arrhenius equation is being formulated. The Arrhenius equation shows the temperature dependence of reaction rates as well as the activation energy of a corresponding reaction.
where k - rate constant, T - temperature in K, A - exponential factor, Ea - activation energy, R - gas constant
According to the theory, the last reaction - where P1 and P2 were -2.5 and -5.0 respectively - must go to completion. However, the exact opposite was observed. As a conclusion, it is suggested that the rate constant is lower in real life than it is in theory. Therefore, the rate constant prevents the reaction from going to completion. (the energy barrier is sufficient to retain AB as a molecule when is it being subjected to a collision by C)
This is sort of the right idea but a bit confused! Yes, TST states that once a reaction has reached the TS and crossed over to the product side, it will not cross back to the reactant side (the assumption of TST is the idea of no barrier recrossing). However in real life barrier recrossing can occur. Therefore the rate constant will be overpredicted by TST, as you have said. However, the rate constant does not prevent the reaction from going to completion and I cannot quite understand what you mean by this point. The main idea is there though. Rk2918 (talk) 12:14, 28 May 2019 (BST)
System of F-H-H
Q1 Classification of F + H2 and H + HF reactions

Atoms A and B are H-s, whereas C was F. The surface plot (see above) shows that the reactants (on the right hand side) are higher in energy than the product (on the left hand side). Therefore the reaction:
F + H2 → HF + H
is exothermic (negative sign, accompanied by a decrease in energy). Hence the reverse reaction:
H + HF → H2 + F
must be endothermic, as this is the corresponding backward reaction. In that case, the reactants will be lower in energy and the products will be higher. Additional energy is required to pass the activation energy barrier.

The first reaction is exothermic, (bond making is exothermic) which means that the final product will be in a lower energy state than the reactants. Hence, the HF bond is a stronger bond and is lower in energy than the H-H bond. This is due to the ionic nature of the H-F bond due to a large difference in electronegativity. The surface plot of the endothermic reaction is shown above. It can be depicted that the reactant are in a lower energy state than the product. For these calculations p1=p2=0
Really good answer. Rk2918 (talk) 12:16, 28 May 2019 (BST)
Q2 Position of the Transition State


To find the transition state, the surface (above, on the left) and contour (above, on the right) plots were displayed. At a transition state, only a single black dot can been seen on a surface plot as there is no trajectory. Moreover, the contour plot was left blank, as the reaction did not happen, but no oscillation is observed as the vibrational freedom of the complex is being retained. The transition state was obtained at H-H distance: 0.745 Å, and H-F distance: 1.808 Å.
For these calculations p1=p2=0
Q3 Activation Energies
Using the Energy vs Time plots, the following values have been established:
H2 + F → HF + H:
Transition state: -103.687 kcal.mol-1 Reactants: -103.913 kcal.mol-1 Activation energy (difference): 0.226 kcal.mol-1
HF + H → H2 + F:
Transition state: -103.687 kcal.mol-1 Reactants: -132.455 kcal.mol-1 Activation energy (difference): 28.768 kcal.mol-1
You should show the plots as it is not clear how these values were obtained. Rk2918 (talk) 12:17, 28 May 2019 (BST)
Q4 Mechanisms of energy release
A scenario was set up in which the Animation and Momenta vs Time plots show that the H2 - F reaction goes to completion. B and C were the H and A was the F atoms, with distances of A-B 1.5 Å, and B-C 0.878 Å.

When the H2 molecule collides with the F atom, the translational energy of the species (due to the attraction between them) is being transformed into vibrational energy (oscillation being observed). Depending on the nature of the experiment, exothermic reactions release whereas, endothermic reactions absorb energy (in the form of heat) from the environment. When the oscillating H2 (both) atom approaches the F atom (only translational energy), oscillation in the form of vibrational energy is being transmitted to the residual HF molecule. This way, the energy of the system is constant but the vibrational and kinetic energies are being transformed in between species. This can be confirmed experimentally by measuring the vibrational energy of the system via IR spectroscopy or use bomb calorimetry to determine the kinetic energy of the system - which is directly proportional to the translational energy and its momentum.
rHH = 0.74 Å, with a momentum pFH = -0.5, pHH in the range -3 to 3, rHF was set to 1.5 Å
| pHH | Level of Vibration of H-H bond | Reaction |
|---|---|---|
| -3 | medium | transition state |
| -2.9 | medium | transition state |
| -2.8 | medium | transition state |
| -2.7 | medium | transition state |
| -2.6 | medium | no |
| -2.5 | medium | no |
| -2.25 | medium | no |
| -2 | medium | no |
| -1.5 | medium | yes |
| -1 | weak | yes |
| 0 | strong | yes |
| 1 | medium | yes |
| 1.5 | weak | transition state |
| 2 | weak | no |
| 2.25 | medium | no |
| 2.3 | weak | no |
| 2.4 | weak | no |
| 2.5 | medium | yes |
| 2.6 | weak | yes |
| 2.7 | weak | transition state |
| 2.8 | weak | transition state |
| 2.9 | weak | yes |
| 3 | medium | yes |
(Table 1)
The reaction goes to completion between the values -1.5 and 1, 2.5-2.6 and 2.9-3.0. As a conclusion, it was determined that no certain trends can be depicted from the data which would link the momentum, the outcome and the stretch of vibrations together. Moreover, the reactions at 2.9 and 3.0 are against Polanyi's empirical rule.
For a separate calculation, the same initial positions were used, for HF + H → H2 + F with rHH=0.74 A but the momentum of HF was changed to p= -0.8 and the HH momentum was 0.1. The reaction goes to completion and thus the reaction is valid!
If we look at the Momenta vs Time plot, we can see a continuously oscillating path, hence the reaction had reached its end. A large momentum contribution is seen as a a result of a large contribution from the very strong HF bond.
H2 2 Å HF 0.893325 Å Phh - 8 Phf -0,02
It would be best to include figures in the table to show the trajectory being reactive/unreactive. Rk2918 (talk) 12:22, 28 May 2019 (BST)
Q5 Polanyi's Empirical Rule and the Distribution of Energy
Polany's empirical rules[2] are reflecting on the effect of transition states energetically different modes. An exothermic reaction - in which the products are higher in energy - the transition state is described as 'early' as it is closer in energy to the reactants. Hence, the translational energy has a greater impact on the activated complex snd thus the reaction then the vibrational energy. Empirically, for an endothermic reaction - with a corresponding late transition state - the vibrational energy has a greater importance on the reaction.
In this case,
F + H2 → HF + H
is an exothermic reaction. Therefore, as described above it has an early transition state which suggest a greater impact from the translational energy contribution. The vibrational energy can be seen through the oscillating nature of the H2 molecule, where the translational contribution is largely coming from the H-F bond (both can be seen through their momenta). The effect of HH momentum is low. Therefore, larger HF contribution (momentum) would increase the chances of the reaction being completed. The experiment has failed to show a specific trend which would also comply with the theory. The results at 2.9 and 3 violate Polanyi's rules as discussed in the previous question.
Your understanding of Polanyi's rules seems corrects, but it doesn't make sense that there would be a violation of Polanyi's rules in these simulations. However I cannot try to aid your understanding of it without a figure or description of the trajectory. Rk2918 (talk) 12:23, 28 May 2019 (BST)