MRD:MT4618
Molecular Reaction Dynamics Lab 2020
Exercise 1- (H+H2 System).
Transition State
The transition state is defined as the maximum on the minimum energy path linking reactants and the products. This point on the potential energy surface has the special property that ∂V(ri)/∂ri=0 (the gradient of the potential is zero), and the energy goes down steeply along the minimum energy path linking reactants and products.
The 'steepness' of the mep is not a criterion here - there are actually cases where the potential energy surface is very flat, which makes finding the transition states (which still exist!) difficult. Fdp18 (talk) 09:14, 16 May 2020 (BST)
Mathematically, the transition state can be described as the derivative with respect to the reaction coordinate that is equal to zero and the maximum can be distinguished from local minima by taking the second derivative wrt the reaction coordinate that is negative.
The sentence is not very clear, and possibly wrong - how many second derivatives do you have in this system? How many of them are negative? Bear in mind that a transition state is not a maximum in more than one dimension. Fdp18 (talk) 09:14, 16 May 2020 (BST)
Trajectories from r1 = r2: locating the transition state
In the following exercise, A is taken to be the approaching H while B and C are the H atoms in H2.
Table 1- Initial conditions used to test H+ H2 system
| Distance (r) [pm] | Momentum (p) [g.mol-1.pm.fs-1] | |
|---|---|---|
| AB | 230 | -5.2 |
| BC | 74 | 0 |
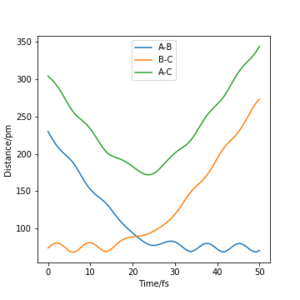
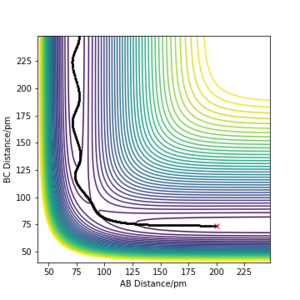
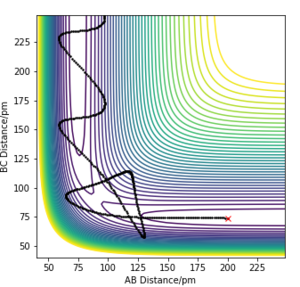
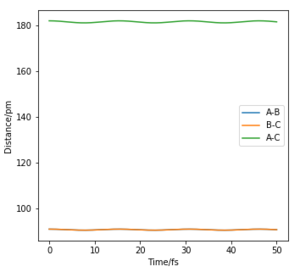
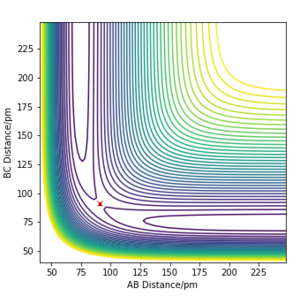
By using the values in Table 1, a plot of intermolecuar distance vs time was generated. As H+H2 is a symmetrical system, the transition state can be assumed to have equal H-H-H bond lengths, which is represented by the intersection of AB and BC on the plot (Fig.1). By setting rAB=rBC and initial momenta to be zero, the transition state was located at rAB=rBC=91pm.
 |
 |
Trajectories from r1 = rts+δ, r2 = rts
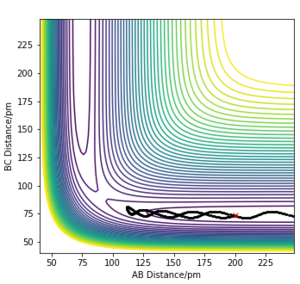
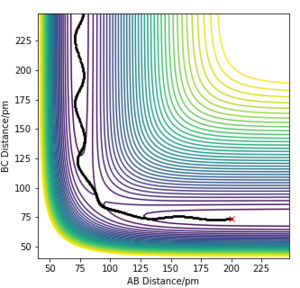
The 'mep' differs from the reaction trajectory of a dynamics calculation. This is because MEP always resets momentum of the reactants to zero after each step in order to simulate an infinitely slow motion. By contrast, the dynamics calculation takes into account the vibronic motion of the system hence, oscillations can be observed on its corresponding contour plot.
It is furthermore instructive to think about conservation of energy. You have total, potential, kinetic energy - what is conserved where? Fdp18 (talk) 09:17, 16 May 2020 (BST)
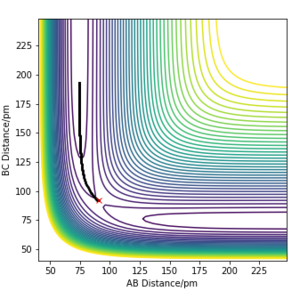 |
 |
Reactive and Unreactive Trajectories
Table 2- Comparing trajectories of systems with initial position of rAB=200 pm and rBC=74 pm and varying values of p1 and p2
Especially the last two entries in Table 2 demonstrate some good understanding of TST and what is going on here in general. Fdp18 (talk) 09:20, 16 May 2020 (BST)
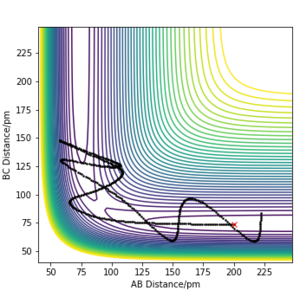
From Table 2, it can be concluded that the total energy of the system does not necessarily determine whether the reaction will proceed. It can also be concluded that high energy systems are prone to return to reactant channels even if they possess enough energy to overcome the transition state maximum. This ilustrates the limitations of transition state theory, which include: not accounting for effects of high temperature and not accounting for the effects of quantum tunnelling.[1]
The concept of 'recrossing' is missing here to make it perfect. Still good though! Fdp18 (talk) 09:21, 16 May 2020 (BST)
Transition State Theory
Transition state theory overestimates the rate of reaction. It assumes every trajectory that rolls over the transition state will proceed to the product which is not the case as evident from Table 2.
... because you implied it here at least. Fdp18 (talk) 09:22, 16 May 2020 (BST)
Exercise 2. (F-H-H System)
PES Inspection
In the following exercise, A is taken to be the approaching atom while B and C represent the initial diatomic molecule.
Table 1- Initial conditions used to test F+ H2 system
 |
 |
|---|
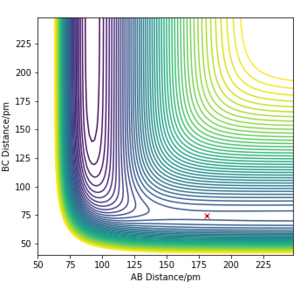
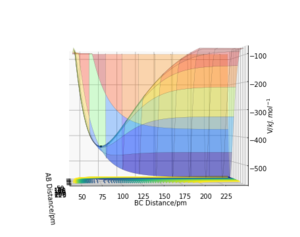
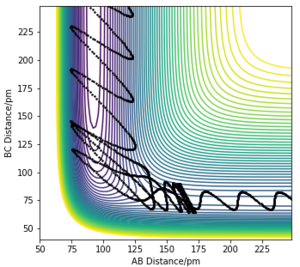
F+H2 is exothermic as it has an early energy barrier. According to Hammond's Postulate, the structure of the transition state is similar to reactants if the reaction is exothermic. The transition state for this reaction was found at rFH=181pm and rHH=74.5pm. The activation energy was calculated to be 686Jmol-1.
 |
 |
|---|
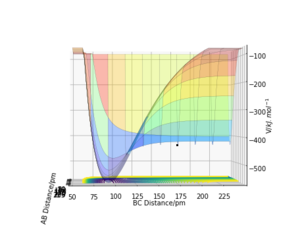
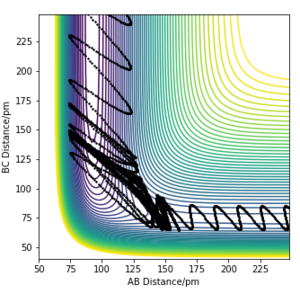
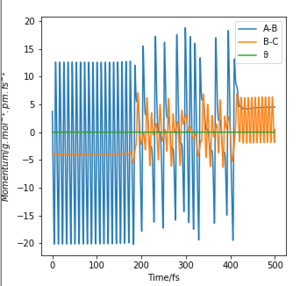
H+HF is endothermic as it has a late energy barrier. According to Hammond's Postulate, the structure of the transition state is similar to products if the reaction is endothermic. The transition state for this reaction was found at rHH=74.5pm and rFH=181pm. The activation energy was calculated to be 126.317kJmol-1.
From what you wrote, I can't see that you understood that there is just one Transition State. Furthermore, with my comment on flatness in mind: this is such a case - you can barely see the TS in the contour plot. Fdp18 (talk) 09:24, 16 May 2020 (BST)
How did you obtain the activation energy values? I cannot reproduce what you did. Although the values are reasonable. Fdp18 (talk) 09:26, 16 May 2020 (BST)
Reaction Dynamics
Table 3- Conditions observed to lead to a reactive trajectory for F+H2
You wrote above that 'A is the approaching atom'. That's ok, you can define your quantities as you like. However, the contour plots below are idential, and with that definition they can't be, because the approaching atoms are different (H vs F). Fdp18 (talk) 09:30, 16 May 2020 (BST)
| Distance/pm | Momentum/ gmol-1.pm.fs-1 | |
|---|---|---|
| FH | 1043.074 | -6.944 |
| HH | 74.216 | -0.254 |
 |
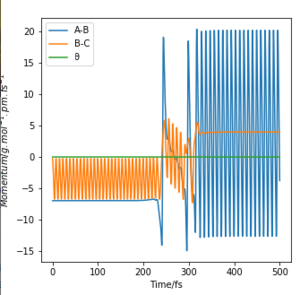 |
From the momenta vs time plot, we can observe that initially the reactants possess a large amount of translational energy and upon reaching the transition state, the energy is converted to vibrational energy. The release of energy from the reaction, which is a combination of energy of translational and vibronic energy changes, can be measured experimentally by using calorimetry and infrared spectroscopy. Calorimetry can be used to measure the heat generated by the reaction thus enabling the calculation of total energy given off by the system. Peaks and their wavenumbers in infrared spectrum can be used to identify the changes in vibrational energy of the IR active H-F molecule.
understandable, concise description. Fdp18 (talk) 09:31, 16 May 2020 (BST)
Table 4- Conditions observed to lead to a reactive trajectory for H+HF
| Distance/pm | Momentum/ gmol-1.pm.fs-1 | |
|---|---|---|
| HH | 868.223 | -3.959 |
| FH | 117.918 | 3.751 |
 |
 |
Translation Vs Vibrational Energy
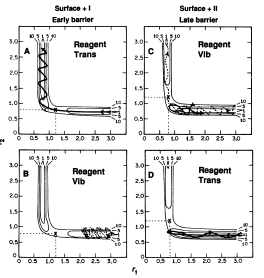
Graph A and B depict an exothermic reaction with an early transition state. It is observed that translational energy is crucial in helping the system surmount the early energy barrier as, when compared between the two graphs, the initial conditions for A possess far more translational energy than vibrational energy, allowing reaction A to reach completion but not B.
Graph C and D depict an endothermic reaction with a late transition state. It is observed that vibrational energy is crucial in helping the system overcome the late energy barrier as, when compared between the two graphs, the initial conditions for C possess more vibrational energy than translational energy, allowing reaction C to reach completion but not D.[2]
You could have explained further using the concept of 'microscopic reversibility'. Apart from that, nice. Fdp18 (talk) 09:34, 16 May 2020 (BST)

