MRD:MS6216
H + H2 System
Differentiating between Saddle Points
In these calculations r1 = 0.74 Å, p1 = 0.0 kg.m/s, r2 = 2.30 Å and p2 = -2.7 kg.m/s
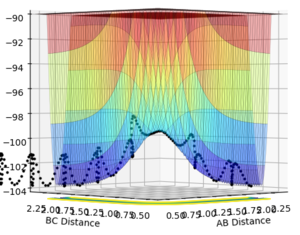

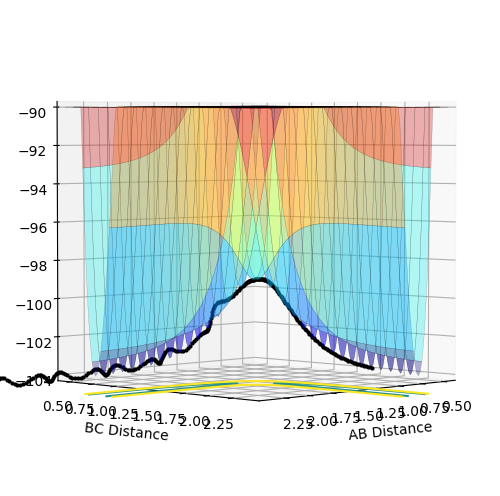
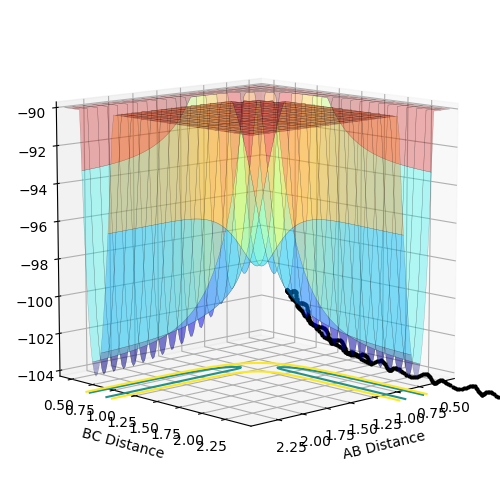
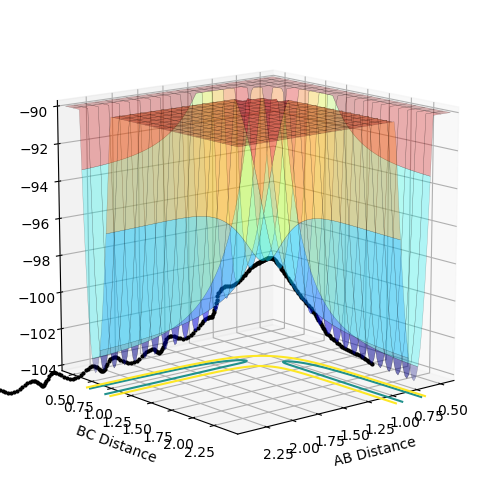
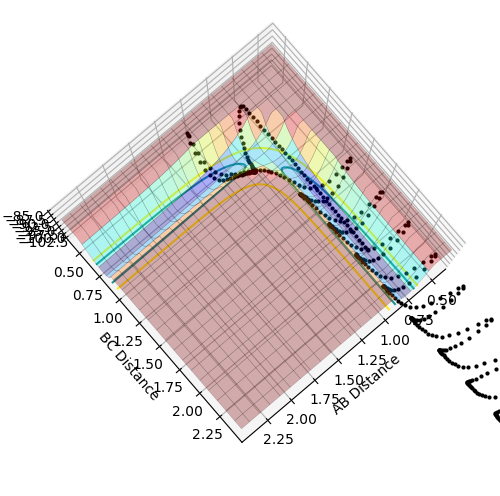
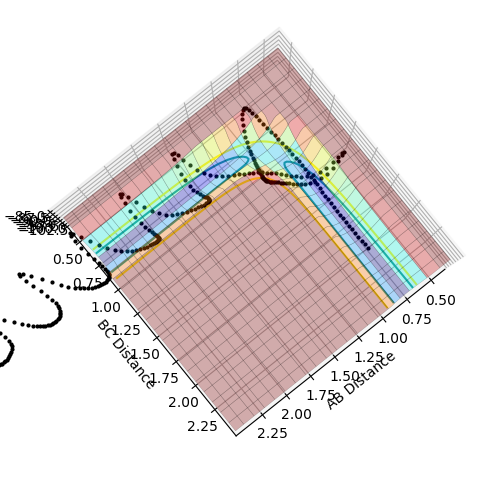
From the two plots above it can be seen that both for the transition state and for the reactants before they react there is no gradient therefore the first derivative of the graph will be equal to 0 with respect to r1 and r2. Then to differentiate between the two you must consider the second derivative of local minima and local maxima of saddle points. For the transition state (a local maxima) the second derivative will yield two values one of which will be negative and one of which will be positive. Whereas for the reactants (a local minima) both of the values will be positive.
(This is a very "wishy washy" answer. The second derivative will not just yield two values. It will give one value when differentiating with respect to one coordinate and another value with respect to another coordinate. This is done by partial differentiation. Fjs113 (talk) 15:06, 28 May 2018 (BST))
Transition State determination
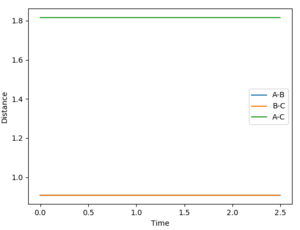
rts=0.90775 Å
This was found by equating AB and BC distances between hydrogen atoms whilst setting the momenta of both AB and BC to 0. When the inter-nuclear distances no longer oscillated this was taken to be the point of transition state as the distance between A-B and B-C did not change with time indicating equal interactions of A-B and B-C.
(Whilst the value is correct, you did not give any reason as to why the transition is found when the inter-nuclear distances no longer oscillate. You need to show understanding as well as give the correct answer! Fjs113 (talk) 15:06, 28 May 2018 (BST))
Reaction Path: MEP vs Dynamics Calculation Type
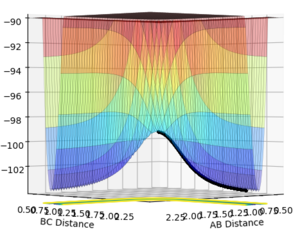
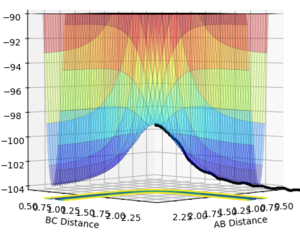
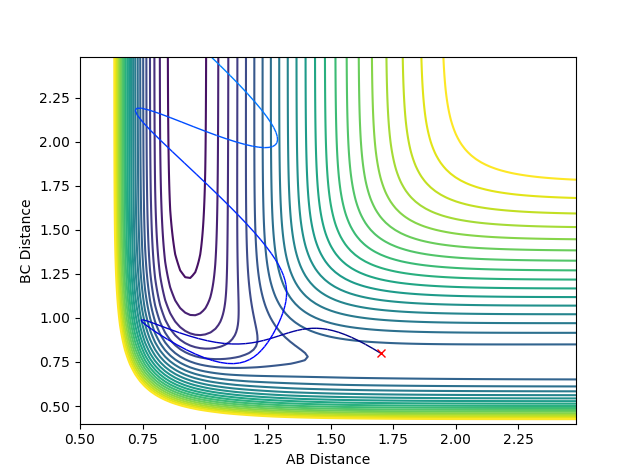
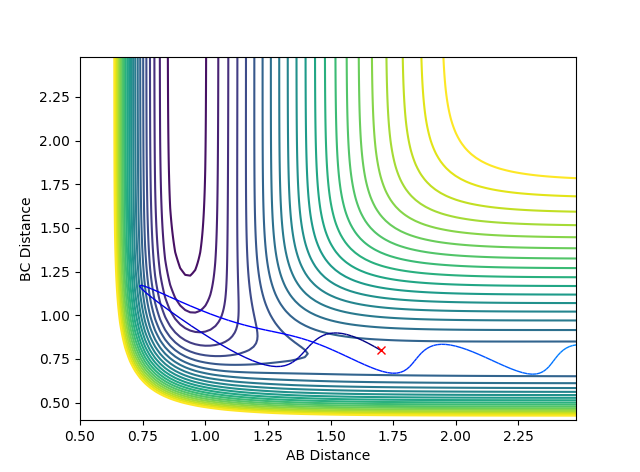
An MEP calculation is a minimum energy path calculation therefore in this method the velocity is always reset to zero in each time step. Whereas in the dynamics calculation type the velocity is not always set to zero hence oscillations are observed for the dynamics calculation type whereas they are not for the MEP calculation as seen in the two diagrams above. Here r1 =0.90775 Å and r2=0.90875 Å.
Reactive and Unreactive Trajectories
(Using the contour plots would've have made this a lot clearer. Fjs113 (talk) 15:06, 28 May 2018 (BST))
Transition State Theory
The main assumptions of the transition state theory are that the reaction rates can be determined by looking at the saddle points of a potential energy surface of a reaction (known as transition state), the activated complexes are in an equilibrium called quasi-equilibrium (different from classical) and that then these activated complexes can form products. Quasi-equilibrium is different from a classical equilibrium as it assumes that the reactants are constantly in equilibrium with the transition state and so at any one point in a mixture there will be a proportion of the transition state configuration present, however, the reactants and products themselves are not equilibrium (i.e. an irreversible reaction).
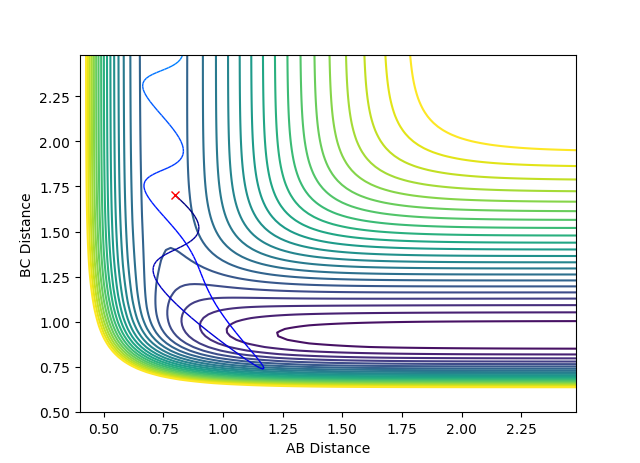
Above the first 3 systems appear to agree with the transition state theory as either the reaction has sufficient energy to go to completion or it does not and the reactants do not form products remaining as reactants. However, the final 2 systems appear to show deviations from this theory as the reaction coordinate appear to cross over the activation energy saddle point contradicting the theory that once you pass over the saddle point to form products you cannot return to reactants. System 4 disagrees as although it does pass over the saddle to form products it then returns back over the saddle to reform reactants. System 5 also initially passes over the saddle to form products before returning over the saddle to form reactants before again passing back over the saddle point to form products.
(Yes, but how does this influence predictions of the reaction rates made by TST as compared to experimental values? Fjs113 (talk) 15:06, 28 May 2018 (BST))
Exercise 2: F-H-H system
Potential energy Inspection

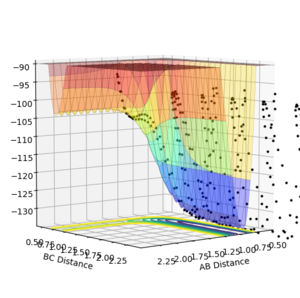
For the reaction H2 + F it was seen that the overall energetics were exothermics with a value of -100.049 kCal/mol. (Where did this value come from?? Fjs113 (talk) 15:06, 28 May 2018 (BST))
This suggests that the H-F bond formed is stronger than the H-H bond broken as the overall energetics of a reaction is equal to the difference in energy of the energy released on bond formation and the energy required on bond breakage. It can be seen in the potential energy surface that energetically the reaction is going downhill in energy showing it is exotherimc.
For the reaction HF + H it can be seen that this is the inverse of the reaction above as it can be seen that in the formation of products energy is required by the reactants indicating an endothermic process.
Transition State Location
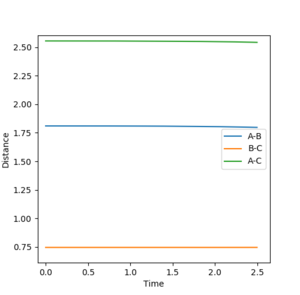
The transition state was found, like before, by setting the HF and HH momentum to zero and altering the bond lengths of H-F and H-H slightly. This was done until the distance no longer oscillated or changed in time and yielded values of 1.811 Å for F-H distance and 0.745 Å. for H-H distance.
Activation Energy
Activation energies were found by equating the 2 momenta at 0 and altering the radii of F-H and H-H atoms as done for H2+H slightly from the transition state lengths in order to push the reaction either towards HF + H or H2 + F.
(You're not altering the radii here! It is the interatomic distances that you're changing. Fjs113 (talk) 15:06, 28 May 2018 (BST))

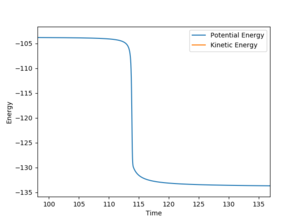
The activation energy of the reaction H2 + F is very small (0.189 kCal/mol). In this calculation r(H-H)= 0.745 Å and r(F-H) = 1.812 Å.
The activation energy of the reaction HF + H is very small (28.719 kCal/mol). In this calculation r(H-H)= 0.745 Å and r(F-H) = 1.805 Å. (Are you sure you meant "very small" here? Fjs113 (talk) 15:06, 28 May 2018 (BST))
Reaction Dynamics
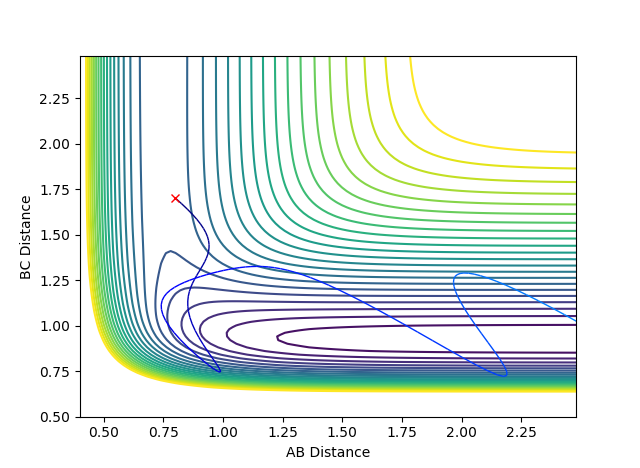
For the following graphs the F-H distance was set to 1.7 Å and the H-H distance was set to 0.8 Å.
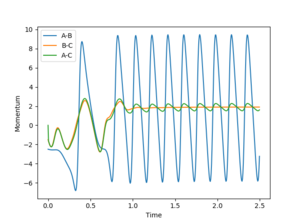
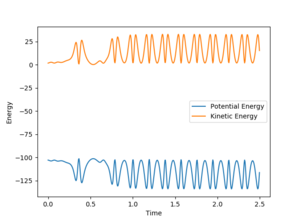
In the mechanism as H2 approaches the F atom initially the H with strong interactions between both the F and H is pulled strongly towards the F atom (due to electrostatics) however this results in a strong oscillation which then results in a slight interaction of the H again with the H atom it was initially bound to before being pulled back towards the F atom again. The release of energy from the reaction then comes from the vibrationally hot state which then oscillates to release the energy. This could be determined experimentally by performing infra-red analysis of the molecule to determine the vibrational relaxation wavenumbers and therefore energies. Rotational spectra (rovibrational) would probably be observed showing rotational excitations and therefore relaxations.
Polanyi's empirical rules
The Polanyi rules are a set of rules that suggest that in a reaction that has a significant energy barrier (transition state) there will be a saddle point which must be overcome to for products. The rules stated that the type of energy which is most efficient in overcoming this barrier would ultimately depend on the position of the barrier. If the transition state was early on (resembling reactants more than products) then the most effective form of energy would be translational energy. Whereas for a late transition state (resembling products more than reactants) the most effective form of energy would be vibrational energy.[1] The following tables demonstrate this as H2+F is exothermic therefore has an early transition state and so translational energy has the dominant effect. Whereas HF+H is endothermic and therefore has a late transition state so vibrational energy has the dominant effect. From table 2 it can be seen that as the percentage of translational:vibrational energy decreases the reaction no longer occurs emphasizing the effect of translational energy. Similarly in table 3 as the percentage of vibrational:translational energy decreases this stops the reaction emphasizing the vibrational energy dependence.
References
- ↑ dx.doi.org/10.1021/jz301649w | J. Phys. Chem. Lett. 2012, 3, 3416−3419

