MRD:MLN
Molecular Reaction Dynamics: Applications to Triatomic Systems
H-H-H System
Consider the following system of three hydrogen atoms, atom A, and molecule BC: 
Dynamics from the transition state region
What value do the different components of the gradient of the potential energy surface have at a minimum and at a transition structure? Briefly explain how minima and transition structures can be distinguished using the curvature of the potential energy surface.
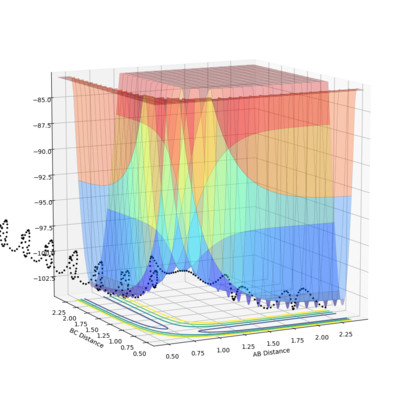
At the minima of the potential plot, the first partial derivative (with respect to either distance), which is the gradient, will be equal to zero:
The second partial derivative, now with respect to both distances, will be positive (greater than zero) as a minimum turning point has a positive curvature:
For a saddle point, the first derivative is again zero, however the second derivative is now also equal to zero, because a saddle point will have no curvature and therefore be completely flat at that point: I don't agree with this--Sw2711 (talk) 17:41, 31 May 2018 (BST)
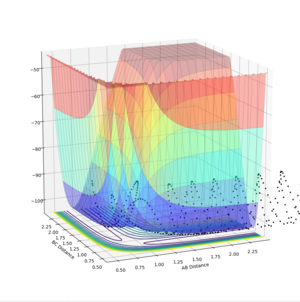
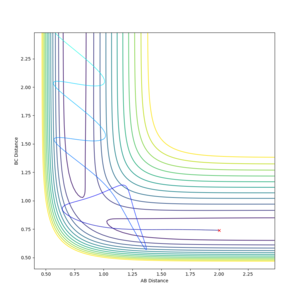
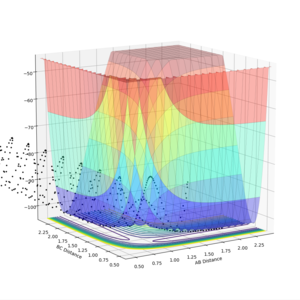
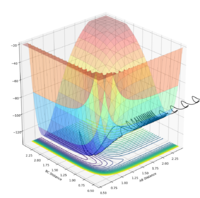
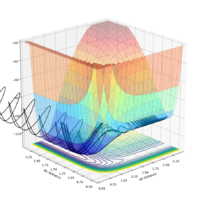
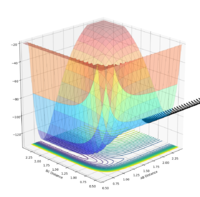
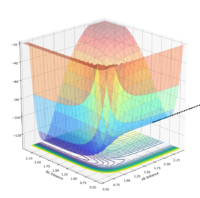
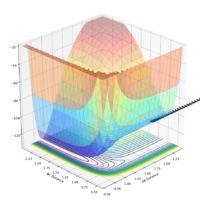
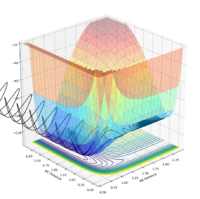
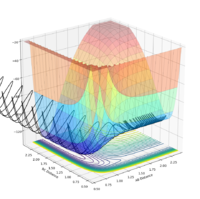
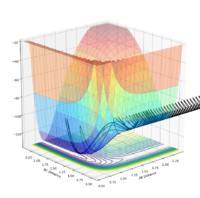
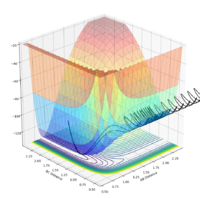
The saddle point can be seen in the surface plot, where the energy of the minima increase to a maximum. But I agree with you this.--Sw2711 (talk) 17:41, 31 May 2018 (BST)It can be seen on the contour plot (the 2D lines at the bottom of the surface plot), where the two contours of the entrance and exit channels come to turning points. Each contour defines a specific energy value, thus these adjacent turning points (saddle point) signify the maximum of this energy path.
Overall, I think you can identify a saddle point generally. As for how to find it by mathematical terms, please watch this video. link --Sw2711 (talk) 17:41, 31 May 2018 (BST)
Report your best estimate of the transition state position (rts) and explain your reasoning illustrating it with a “Internuclear Distances vs Time” plot for a relevant trajectory.
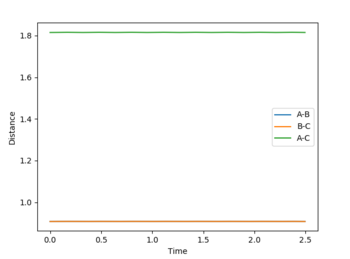
The transition state position is estimated by finding the rBC = rAB at which the Internuclear Distance vs Time plot has a gradient of zero, because if there is no gradient, the trajectory will oscillate at this point will or will not?--Sw2711 (talk) 17:41, 31 May 2018 (BST) and will not move to a different position, or 'fall off' the maximum. The gradient signifies a change in energy, so if there is no gradient, then there is no change in energy at the point which the system is oscillating. Thus it does not oscillate over a lower energy position like it would if the gradient was non-zero and does not fall off. The plot shown is calculated at r = 0.9075 Å. As the gradient is zero, rts = 0.9075 Å. I think you forgot to mention with zero momentum--Sw2711 (talk) 17:41, 31 May 2018 (BST)
Minimum Energy Path (mep)
Comment on how the mep and the trajectory you just calculated differ.
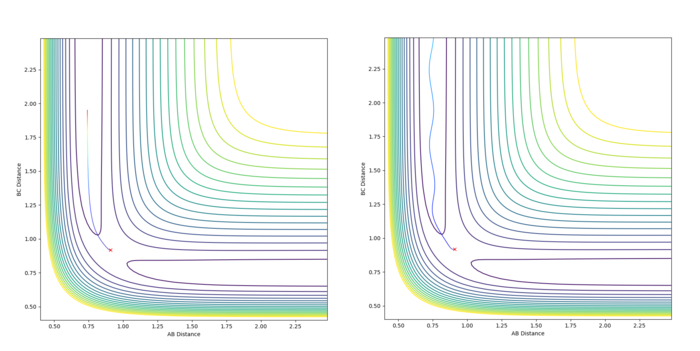
This part is good--Sw2711 (talk) 17:42, 31 May 2018 (BST)
For the mep when all momenta are zero and rBC is slightly displaced by 0.01 Å, the molecule AB will form. When rBC is slightly displaced by -0.01 Å, the molecule BC will form. This is because for mep the system just follows the lowest energy pathway towards the lower potential energy as there is no momentum and therefore no kinetic energy. For the mep calculation the final values were: rBC(t) > 9.00 Å, rAB(t) = 0.74 Å; pBC(t) = 0.0014, pAB(t) = 0.000065.
The dynamic calculation will have oscillations due to the transfer of potential energy to kinetic energy as the molecule is formed and the system moves away from the transition state position. For the mep calculation the final values were: rBC(t) > 9.00 Å, rAB(t) = 0.74 Å; pBC(t) = 2.50, pAB(t) = 1.32.
Setup a calculation where the initial positions correspond to the final positions of the trajectory you calculated above, the same final momenta values but with their signs reversed.
What do you observe?
Distance graphs are a reflection of each other in the y axis and the momentum graph is a reflection in the line y=-x, as the momentum is negative, bringing the atoms together to form the transitions structure at the transition state separation, so the separation decreases and negative momentum increases to zero.
Reactive and Unreactive Trajectories
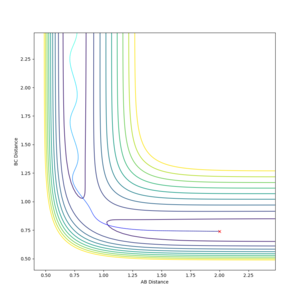
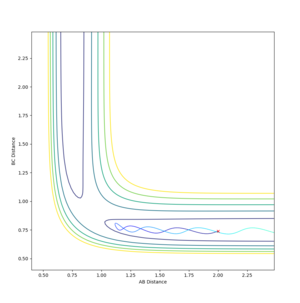
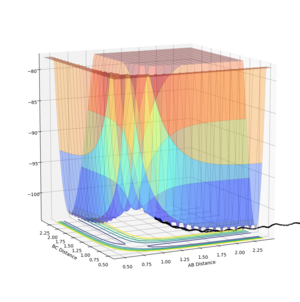
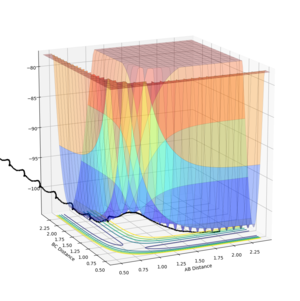
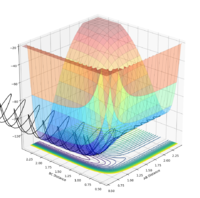
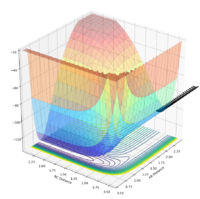
Complete the table by adding a column with the total energy, and another column reporting if the trajectory is reactive or unreactive. For each set of initial conditions, provide a plot of the trajectory and a small description for what happens along the trajectory.
This part is good--Sw2711 (talk) 17:57, 31 May 2018 (BST)
Transition State Theory
State what are the main assumptions of Transition State Theory. Given the results you have obtained, how will Transition State Theory predictions for reaction rate values compare with experimental values?
Transition State Theory is used to explain the reaction rates of chemical reactions by using several assumptions. The main assumptions of TSS assume that:
- Classical mechanics can adequately describe the system [1]
- All trajectories that cross the transitions state will react [2]
- An equilibrium exists between the reactants and the transition state[3]
- The system will follow the lowest energy pathway (over the lowest energy saddle point) on the energy surface [4]
As the theory assumes that all crossings of the transition state are a successful reaction, it neglects any recrossing of the system and would account for the recrossing as multiple successful reactions: An overall unreactive recrossing trajectory will cross the transition state an even number of times, and an overall reactive recrossing trajectory will cross the transition state an odd number of times. Therefore, TSS will overestimate the reaction rate of a system as it assumes that more successful reactions are occurring in a given time frame than will actually occur.
Good--Sw2711 (talk) 17:44, 31 May 2018 (BST)
Furthermore, due to the assumption of lowest energy pathway, any higher energy pathway trajectories that are successful will not be taken into account. Therefore at high temperatures, when higher energy levels will be more occupied and higher energy trajectories are possible, the theory will underestimate the number of successful reactions occurring, thus predicting a lower reaction rate that experimentally seen.
In conclusion, at temperatures where thermal energy is less than the transition barrier, recrossing is less likely to occur so the assumption will be more valid. As the temperature is lowe, higher energy states will not be occupied and so the lowest energy pathway assumption is also valid. Thus, at temperatures where thermal energy is lower than the activation energy of the reaction and the excitation energy of the reactant atoms, TSS is most reliable and will produce the predicted reaction rates that are closest to the experimental reaction rates.
F-H-H System
PES inspection

- Classify the F + H2 and H + HF reactions according to their energetics (endothermic or exothermic). How does this relate to the bond strength of the chemical species involved?
- Locate the approximate position of the transition state.
- Report the activation energy for both reactions.
F + H2 → HF + H
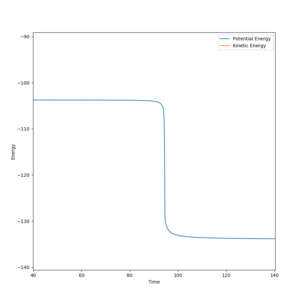
The reaction is exothermic because the products are lower in energy than the reactants, due to the HF bond being stronger (565 kJmol-1) than the HH bond (432 kJmol-1).[5] Because of this, more energy is released when the HF bond forms than is taken in to break the HH bond, thus it is classified as exothermic due to an overall release of energy.
Hammond's postulate can be used to estimate the structure of the TS, as it states that the transition state look most like the structure that it is closest to in energy: i.e. an exothermic reaction TS structure will be more similar to the reactants, an endothermic reaction TS will be more similar to the products structure. Therefore, the TS for this reaction will be more similar to an F atom and an H2 molecule. So the HH bond distance, 0.74 Å[6], can be used as a starting point to find the transition state position.
Using the same methods as for the H-H-H system above, the transition state position is found to be where the gradient of the Distance vs Time plot is zero, as explained above, which is at r1,ts = 1.811 Å, r2,ts = 0.745 Å.
By slightly displacing one distance from the transition state position (1.811 Å → 1.801 Å) and following the mep, the change in potential energy of the transition state to the products can be seen on the Energy vs Time plot. This difference is equal to the activation energy, which is found to be 30 kcalmol-1.
This part is good--Sw2711 (talk) 17:44, 31 May 2018 (BST)
H + HF → F + H2
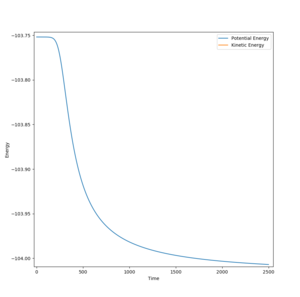
This reaction is endothermic as the products are higher in energy than the reactants, due to the HH bond being weaker than the HF bond. The bond energies can be seen above.
Following the same thought process and using the same methods as the previous reaction, the transition state position and activation energy can be found. The TS position is found to be at r1,ts = 0.745 Å, r2,ts = 1.811 Å, the same as the previous reaction. This is expected as they are the inverse reactions of each other, so will have the same transition state structure.
The activation energy was found (by displacing 1.811 Å → 1.801 Å) to be 0.25 kcalmol-1.
H' + HF → H'F + H
This is the reaction that would occur from the same reactants as the second reaction, but forming different products (which are equivalent to the reactants).
This is a proton transfer reaction and as the bond strengths are the same in both reactants and products, the activation energy will be 0 kcalmol-1, so the system is in equilibrium and the reaction will be constantly occurring in both directions.
Interesting that you discussed this case and you think it is a proton transfer. But I guess that is more because the energy release from forming H-F is the same to break H-F. But it doesn't mean it is zero activation energy.--Sw2711 (talk) 17:51, 31 May 2018 (BST)
Reaction dynamics
Reactive and Unreactive Trajectories
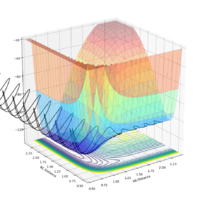
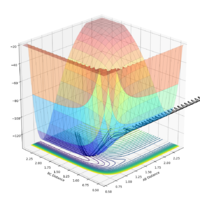
For the initial conditions rAB = 2.3, rBC = 0.74:
| pAB | pBC | Reactive? | Trajectory contour plot | Trajectory surface plot |
|---|---|---|---|---|
| -2.5 | 0 | Yes | 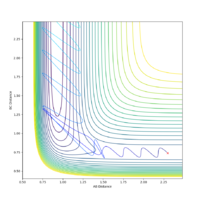 |
 |
| -2.0 | 0 | No |  |
 |
| -2.0 | -1.5 | Yes |  |
 |
| 0 | -1.0 | No | 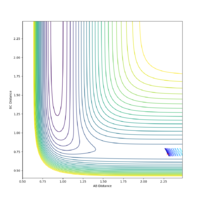 |
 |
| -0.6 | -1.0 | No | 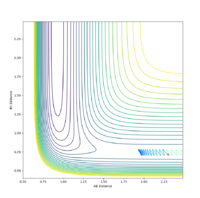 |
 |
| -0.65 | -1.0 | Yes |  |
 |
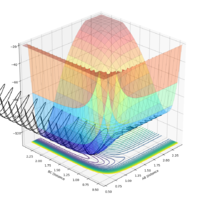
| -1.5 | -1.5 | Yes | 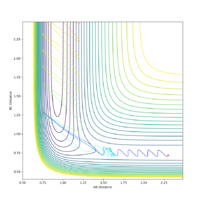 |
 |
Transfer of Reaction Energy
In light of the fact that energy is conserved, discuss the mechanism of release of the reaction energy. How could this be confirmed experimentally?
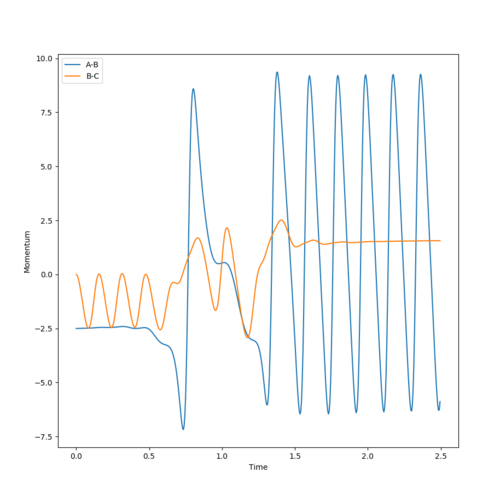
Consider the Internuclear Momenta vs Time plot produced from the reactive trajectory with initial conditions of rAB = 2.3, rBC = 0.74, pAB = -2.5, and pBC = 0. From this, and the animation, we can see that, initially, the H2 molecule (BC) has momentum and it is oscillating as it moves towards the F atom (A). The molecule therefore has kinetic energy in the form of vibrational and translational energy, which is converted to potential energy, due to the Coulombic Forces between the atoms, as it approaches the F atom.
The negative momentum increases to zero (a decrease in absolute momentum), so kinetic energy also decreases, as potential energy increases to a maximum. At the potential energy maximum, where the momentum is zero, the system is in the transition state. As the system passes over the potential maximum, this potential energy is converted to kinetic energy of the products, in the form of translational energy of the H atom and vibrational energy of the HF molecule, so kinetic energy and therefore absolute momentum increases. The internuclear momentum of BC (unbound H H) remains approximately constant as the H atom travels away from the HF atom, and the HF atom is oscillating so its momentum is also oscillating. The oscillations of the final AB momentum (oscillations of the HF produced) is greater than the initial oscillations of BC momentum (H2 reactant), because momentum is a function of mass and the total mass of HF is greater than the total mass of HH.
Overall, translational and vibrational (kinetic) energy of the H2 molecule is converted into translational energy of the unbound H atom and vibrational energy of the HF molecule.
That the reaction is exothermic can be confirmed experimentally by measuring the change in temperature, as the release of energy causes temperature to increase. The greater vibrational energy of the products can be confirmed by IR spectroscopy. As the product is more vibrationally excited, more higher level vibrational energy states are occupied so overtones will begin to appear in the IR spectrum at a lower frequency than the main band (energy spacing decreases for higher energy levels). If the products were further vibrationally excited the intensity of the overtones would increase.
Good--Sw2711 (talk) 17:53, 31 May 2018 (BST)
High Energy Trajectories
F + H2 reaction. Initial conditions: rHH = 0.74, rHF = 2.3, pHF = -0.5:
Initial conditions: rHH = 0.74, rHF = 2.3, pHF = -0.8:
| pHH | Observations | Trajectory surfaceplot |
|---|---|---|
| 0.1 | Reacts | 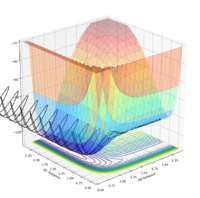 |
Reactant Energy Distribution
Discuss how the distribution of energy between different modes (translation and vibration) affect the efficiency of the reaction, and how this is influenced by the position of the transition state.
Polanyi's empirical rules describe the most efficient way of activating a reaction, by differentiating the trajectories needed for endothermic and exothermic reactions. The trajectories can be made reactive by giving the reactants kinetic energy, however reactions that are energetically different will need to be kinetically excited in different ways. The empirical rules lead to the following conclusions[7]:
- For a late-barrier reaction, i.e. an endothermic reaction, a reaction is most effectively activated by using vibrationally excited reactants. This condition can be simulated by using a greater internuclear momentum of the reactant molecule to increase its initial vibrational energy.
- For an early-barrier reaction, such as an exothermic reaction, the trajectory will be more likely to be reactive if the reactants are translationally excited. This can be simulated by using a greater initial internuclear momentum between the unbound atom and the atom that it collides with in the molecule.
Thus, in the F-H-H system reactions above, the F + H2 reaction is exothermic, therefore it is more likely for a given trajectory to be reactive if it has a large pFH (more translational energy) and smaller pHH. The HF + H reaction is endothermic, so a given trajectory is also more likely to be reactive if it has a larger pHF (more vibrational energy) and smaller pHH.
Good, so what is your opinion of Polayni's Rule? Do you agree or disagree with it by carrying out your own experiments. By the way I have noticed that you tried a series of experiments. But it is not enough to just stick them here. You need to explain what is the key take-away from those experiments. --Sw2711 (talk) 17:56, 31 May 2018 (BST)
References
- ↑ B. H. Mahan J. Chem. Educ. 51(11):709 (1974), http://dx.doi.org/10.1021/ed051p709
- ↑ Pineda, J. R., Schwartz, S. D., "Protein dynamics and catalysis: The problems of transition state theory and the subtlety of dynamic control," Phil. Trans. R. Soc. B. 361(1472):1433–1438 (2006), http://dx.doi.org/10.1098/rstb.2006.1877.
- ↑ Fowler, R., and Guggenheim, E. A., “Statistical Thermodynamics,” Cambridge University Press, London, 1939. Chap. 12.
- ↑ Pineda, J. R., Schwartz, S. D., "Protein dynamics and catalysis: The problems of transition state theory and the subtlety of dynamic control," Phil. Trans. R. Soc. B. 361(1472):1433–1438 (2006), http://dx.doi.org/10.1098/rstb.2006.1877.
- ↑ Huheey, pps. A-21 to A-34; T.L. Cottrell, "The Strengths of Chemical Bonds," 2nd ed., Butterworths, London, 1958
- ↑ Huheey, pps. A-21 to A-34; T.L. Cottrell, "The Strengths of Chemical Bonds," 2nd ed., Butterworths, London, 1958
- ↑ Levine, R. (2005). Molecular Reaction Dynamics. Chap. 5

