
MRD:MH5015
This is a report from the Molecular reaction dynamics computational lab by Martin Holicky.
Introduction
Simulating reactions as paths on a potential energy surface (PES) can provide interesting insights into the elementary reaction rates and mechanisms. From the minima it is possible to calculate the energy difference between the reactants and the products and by finding the saddle point of the PES it is possible to both determine the activation energies and the structure of the transition state (TS). While the simulations in this case allow for any arbitrary initial positions and translational / vibrational momenta to be set, such experiments can be actually done (to some extent, of course) by manipulating the atoms with ultrafast lasers [1].
The minima, maxima and saddle point all satisfy the requirement for zero gradient of the PES:
To distinguish between these three cases, the second derivatives have to be calculated [2], providing a Hessian matrix.
Then, the determinant of the Hessian has to be calculated
If the determinant is negative the point is a saddle point. If the determinant is positive and is also positive, then the point is a local minimum.
Mm10114 (talk) 17:31, 7 June 2018 (BST) Very detailed explanation, well done.
The collisions between three atoms were simulated using the LepsPy software, developed by T. Mackenzie and published under the GPL License. In all cases, a 180-degree collision trajectory was assumed.
Mm10114 (talk) 17:31, 7 June 2018 (BST) I really like that you provide all this information.
H-H-H system

The following reaction between three hydrogen atoms was considered:
H-H + H ⇄ H + H-H
It is clear that since all three atoms are identical the bond lengths are equal and also the potential energy surface symmetrical. As stated in the Introduction, the transition state is located at the maximum of the minimum energy path where the potential energy gradient is zero. This implies an unstable equilibrium, however, since the simulation ignores external factors (such as other atoms) it will be stable forever. By gradually adjusting the internuclear separations while keeping the momenta at zero the transition state position was found at rts = 0.907. The internuclear distance did not change in time which is indeed expected from a transition state. Minor oscillations - stretches of the H-H-H bonds are visible but since these are symmetrical the do not shift the equlibrium.
A more accurate and faster way to find the TS would be by simply computing the determinants of the Hessians throughout the PES. However, after a quick inspection of the LepsPy source code, the modification of the code appeared to be more time consuming than finding it by hand, given the fact only two TS needed to be determined in this work. Nevertheless, it would be a useful feature.
Mm10114 (talk) 17:34, 7 June 2018 (BST) Hard to disagree with your observations. Here, the exercises play only an introductory role into the MRD. However, I am very impressed you've taken the time to inspect the code and make these valid suggestions.
Minimum energy paths

By setting the speed of the atoms to zero in each step, it is possible to calculate the minimum energy path (MEP). In this simulation, the HA-HB-HC distances were set to 0.917 and 0.907 respectively, the former corresponding to a slight displacement from the transition state. This displacement resulted in the transition state collapsing into HA and HB-HC. The H-H distance rBC simply converged to the dihydrogen bond length (0.74) and rAB increased steadily (reaching a minimum at infinity).
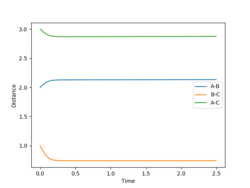
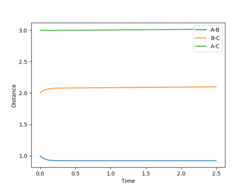
Running the simulation in the Dynamics mode (preserving velocities between steps) produces similar results as the transition state dissociates into HA and HB-HC. However, the reaction is much faster (no surprise here, resetting the speeds in the MEP mode obviously slows the process down significantly). One interesting feature is perhaps the shape of the rAB curve. With the MEP the curve resembles a logarithmic process (an integral of the 1/r potential), in the Dynamics simulation it is approximately linear.

Exchanging the initial distances shifts the reaction towards the other side of the equilibrium (transition state saddle point), resulting in the other set of products.
-
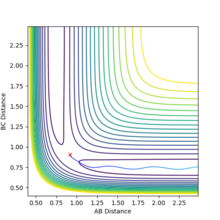 The path towards H + H-H (rAB longer)
 -
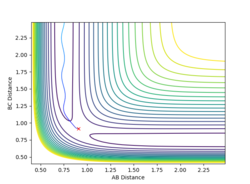 The path towards H-H + H (rBC longer)


By plotting the momenta of the atoms in time, it was found that at the end of the simulation they were pAB = 1.230 and pBC = 2.481 (the transition state potential energy roughly divided in 2:1 ratio and converted into kinetic energy). Running the simulation backwards with these momenta (opposite signs to reverse the process) and the final positions rAB = 0.746 and rBC = 9.006 resulted in the molecule going into the transition state. This demonstrates the conservation of energy in the simulation.

Reactive and unreactive pathways
The dynamics simulations with the initial momenta as defined in the Table below with initial distances of r1 = 0.74 and r2 were used to investigate if simply having a high enough momentum is necessary for a succesful collision to occur.
| p1 | p2 | Total energy | Comment | Reactive? | Contour plot |
|---|---|---|---|---|---|
| -1.25 | -2.5 | -99.018 | A successful collision, reaction proceeds. | yes | 
|
| -1.5 | -2.0 | -100.456 | The reactants don't have a sufficient momentum to overcome the activation barrier and no reaction occurs. | no | 
|
| -1.5 | -2.5 | -98.956 | Similar to the first case. The higher initial momentum reflects in a higher vibrational energy of the product. | yes | 
|
| -2.5 | -5.0 | -84.956 | The reactants cross the TS, form the products then revert back to reactants (barrier recrossing). | no | 
|
| -2.5 | -5.2 | -83.416 | The reactants cross the barrier multiple times and then continue to form the products. | yes | 
|
The Transition State Theory (TST) is used to explain the kinetics of elementary reactions and to determine the thermodynamic parameters of activation. This theory works with an assumed quasi-equilibrium between the reactants and the activated complex in the transition state corresponding to a saddle point [3]. Then, kinetic theory can be used to determine the reaction rate. It also assumes that the nuclei behave according to classical mechanics and the transition state collapses directly into the products (no barrier recrossing). Therefore, due to the last assumption the real reaction rates would be lower than predicted by the TST. It also deviates at higher temperature due to higher vibrational states not passing the saddle point and possibly due to quantum-mechanical effects like tunneling.
F-H-H System

Exchanging one of the hydrogen atoms for a fluorine atom, the following reaction was investigated:
F + H-H ⇄ HF + H
The transition state was found by carefully adjusting the internuclear distances while keeping the momenta to zero. The process was complicated by the fact the potential energy surface is no longer symmetric and also the forward reaction having a too small activation energy. The distances for which the TS complex remained stationary (at the TS saddle point) were rFHa = 1.811 and rHaHb = 0.745. This is an early transition state (with respect to the above reaction) - the H-H bond is almost intact, while the fluorine is at a large distance. Making a reference to Hammond's postulate, the structure strongly resembles the reactants.
Energy considerations
As shown in the table below, the energy for each stage of the reaction was found by computing the potential energy ('Initial Geometry Information') either while in the transition state (with the distances as determined above) or before/after the reaction (large separation between the species, equilibrium bond lengths set to rFH = 0.919 and rHH = 0.740). The equilibrium bond lengths were determined by an MEP simulation where the interatomic separation converged to the bond length value. The reaction in the forward direction required only a very small activation energy and was found to be overall exothermic.
| Stage | Energy |
|---|---|
| F + HH | -104.020 |
| F-H-H (TS) | -103.743 |
| HF + H | -134.025 |
| Forward EA | 0.277 |
| Reverse EA | 30.282 |
| Forward ΔE | -30.005 (an exothermic process) |
-
 MEP determination of the H-H bond length.
 -
 MEP determination of the F-H bond length.


Reaction dynamics
Simulating the reaction with the following parameters rFH = 2.4, rHH = 0.740, pFH = -1 and pHH = -2 provides the data and plots below. Looking at the surface plot below, it is clear that the energy is conserved since the 'vibrational peaks' reach the same levels (potential energy maxima where they have no kinetic energy) before and after the reaction. However, the vibrational energy increased significantly during the reaction, corresponding to the 'release of heat' since the reaction is exothermic. This relates a microscopic simulation to a macroscopic phenomenon, which can be easily measured using, for example, a calorimeter. Also, the excess vibrational energy can be emitted in the form of IR photons, as observed by Polanyi and others (neglected in this simulation) [4]. The amplitudes of the vibrations (stretches) are especially visible on the Momenta in time plot.
-
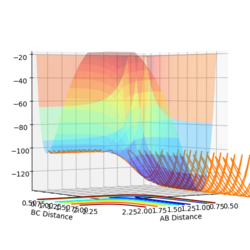 Reaction potential energy surface
 -
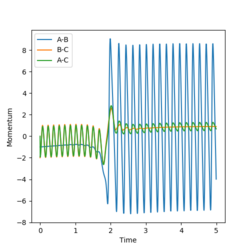 Internuclear momenta over the course of the reaction.


Forward Reaction Reactive and unreactive pathways
The dynamics simulations with the initial momenta as in the Table below with initial parameters of rFH = 2.4, rHH = 0.74 and pFH = -0.5 and a variable initial momentum were used to investigate the reactive pathways for this reaction. The sign of the HH-momentum affects if the first vibration goes 'together' or 'away' and on the contour plots are visible as 'down' and 'up' vibrations, respectively. As it can be seen from the data below, this initial setting can affect the outcome of the reaction. Notice the different vibrational amplitudes for +0.5 and -0.5 setting - this is a result of the anharmonicity of the potential.
| pHH | Comment | Reactive? | Contour plot |
|---|---|---|---|
| -3 | Reaction proceeds, the product has a significant vibrational energy. | yes | 
|
| -2.5 | Reaction proceeds, but the product has a lower vibrational energy than in the first case | yes | 
|
| -2 | The reactants don't have a sufficient momentum to overcome the activation barrier and no reaction occurs. | no | 
|
| -0.5 | The reactants don't have a sufficient momentum to overcome the activation barrier and no reaction occurs. | no | 
|
| +0.5 | The reactants don't have a sufficient momentum to overcome the activation barrier and no reaction occurs. | no | 
|
| +2 | The reaction proceeds, crossing the barrier once. | yes | 
|
| +2.5 | The reaction proceeds. | yes | 
|
| +3 | The products re-crosses the barrier and revert to reactants. | no | 
|
The simulation was also performed with the following parameters: rFH = 2.4, rHH = 0.74, pFH = 0.5 and pFH = -0.8. Initially, the dihydrogen reactant has a relatively small vibrational energy but the product a much higher - this is due to the energy released in the reaction.

Reverse reaction analysis
Running with the following initial values: rFH = 0.91, rHH = 2.4, pFH = 0.1 and pHH = -10 produced a reactive pathway as shown in the Figure below.

Starting from the transition state determined earlier (with a small deviation due to rounding errors), after 2500 steps the final parameters were found to be rFH = 0.89736, rHH = 9.97011, pFH = -5.16018 and pFH = 2.06519. When these values were fed into the software (inverting the momenta), the reactants did not even reach the transition state, even when the inputs were matched to 6 significant figures with the final position from the TS simulation.
The energy for the activation can be supplied as both vibrational and translational momenta. Polanyi's rules state[5]:
For an early barrier (forward reaction in this case) the most effective passage is with translational rather than vibrational energy. Conversely, for a late barrier (the reverse reaction), it's easier passed with vibrational rather than translational energy.
From the results of the forward reaction, it appears that the vibrational energy had a significant effect on enhancing the forward reaction, while a high translational energy has helped with the reverse reaction - exactly the opposite as Polanyi's rules state. The results here are inconclusive and more calculations would be useful - the few calculations ran in this report might not provide a representative data set. In all cases the success of the reaction was sensitive to the initial energy values in a more complex way than simply 'high enough' - in the high energy cases barrier recrossing has often occured.
References
- ↑ Gruebele M., Zewail A. H. Physics Today. May 1990, pp. 24-33.
- ↑ Quirke, N. Maths 2 Lecture Notes. Imperial College (2017).
- ↑ Wikipedia: Transition State Theory. Accessed on 24/05/2018. Available online at https://en.wikipedia.org/wiki/Transition_state_theory
- ↑ J. C. Polanyi, Science 236, 680 (1987).
- ↑ Steinfeld I.J., Francisco J. S., Hase, W. L. Chemical Kinetic and Dynamics. Prentice-Hall (1998).