MRD:MAlberts
Exercise 1

On a potential energy surface diagram, how is the transition state mathematically defined? How can the transition state be identified, and how can it be distinguished from a local minimum of the potential energy surface?
The transition state on a potential energy surface is defined as a first order saddle point.1 A saddle point is mathematically defined in cartesian space as:
with
Condition 1:
Condition 2: and with and being interchangable.
Visually this means that the saddle point is the point where the function F has a minimum along one direction and a maximum along another orthogonal to the first one.
In the context of a potential energy surface diagram, the transition state is the saddle point. It can be thought of as the maximum of the minimum energy path. This, by definition, has to be the saddle point as the minimum energy path runs along the minima of the potential energy surface and thus adheres to the definition of there being a minimum and maximum in the same point. In the case of a local minima or maxima condition, 1 would also be fulfilled. Condition 2 is needed to distinguish between a local minimum or maxima and the saddle point as for a minimum both derivatives would be positive while for a maximum they would both be negative.
Another way to identify a saddle point is to form the Hess matrix. If the Hess matrix is indefinite the point is a saddle point. Good explanation. Better description will refer to the image. Reference wasn't added correctly, information on this was given in the general instructions for wiki's Sf3014 (talk) 16:58, 18 May 2020 (BST)
Report your best estimate of the transition state position (rts) and explain your reasoning illustrating it with a “Internuclear Distances vs Time” plot for a relevant trajectory.
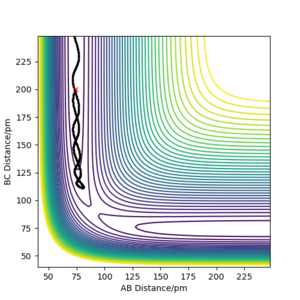
The transition state is defined as a saddle point on the potential energy surface. Thus if the molecule and the atom it collides with have no momentum and they are exactly at the transition state they will remain there forever. The transition state was found by setting the momentums to zero and as this system is symmetric
equal to
. Then the values of
and
were varied while observing the contour plot and the forces along
and
. For the position to be the transition state, no movement can be observed in the contour plot and the forces need to be equal to zero as the atoms are static and don't move. Additionally, verify the position of the transition state the internuclear distance vs time was examined. At the transition state, this plot should show two flat lines as there is no movement at the transition state.


The transition state was found to be at 90.772pm. This is corroborated by the forces along and being zero (see figure 2), the contour plot showing no movement (see figure 3) and the internuclear distance vs time plot showed two flat lines (see Figure 4). Very good explanation Sf3014 (talk) 17:02, 18 May 2020 (BST)
Comment on how the mep and the trajectory you just calculated differ.
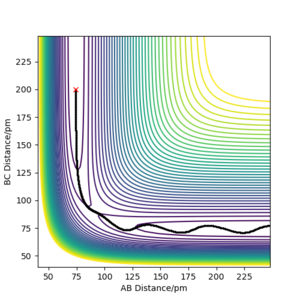
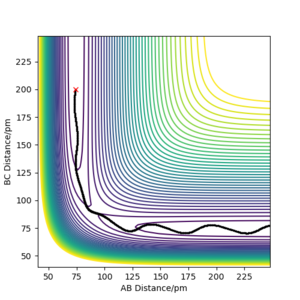
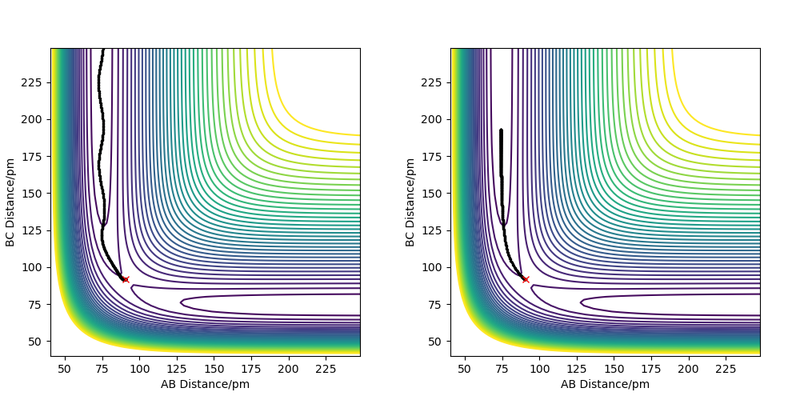
The minimum energy path describes the path that follows all the minima of the potential energy surface. In the simulation with the minimum energy path the molecule follows the minima at a velocity approaching zero (internuclear velocity vs time remains at zero). Additionally, there are no vibrations in this simulation and the total energy decreases. The molecule starts close to the transition state and the moves at a velocity near zero to a position in the product where it seems to stop and remain.
For the dynamic simulation, the molecules do not follow a straight path but as indicated by the oscillatory behaviour of the internuclear distance show vibrations. In addition, the total energy does not decrease as compared to the mep and the velocity is not at zero but the molecule continues at a constant oscillating velocity.
Great but refer to figure in description Sf3014 (talk) 17:05, 18 May 2020 (BST)
Complete the table above by adding the total energy, whether the trajectory is reactive or unreactive, and provide a plot of the trajectory and a small description for what happens along the trajectory. What can you conclude from the table?
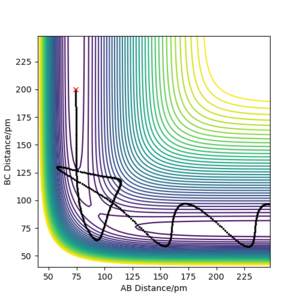
The conclusion that can be drawn from this table is that even if the molecules have enough kinetic energy to overcome the activation energy boundary a reaction does not necessarily have to happen. If one molecule has a high excess of kinetic energy it can happen that the newly formed bond is torn apart by strong vibrations. Very detailed description in table. However, referring to numbered reactions only work if there are clear numbering for each reaction. Good conclusion from table Sf3014 (talk) 17:15, 18 May 2020 (BST)
Given the results you have obtained, how will Transition State Theory predictions for reaction rate values compare with experimental values?
Transition state theory makes four essential assumptions. The first one is that all molecules that move into the transition state are going to form products or if they enter from the product sides that all molecules reform reactants. This means that reactants that e.g move into the transition state but do not cross it are counted as products even though they remain productsSentence unclear Sf3014 (talk) 17:24, 18 May 2020 (BST) . An example of reactants moving into the transition state but not forming products can be seen above in reaction four. Another, assumption of transition state theory is that no quantum effects occur. One of these effects tunnelling where a molecule that according to the theory would not have enough energy to form products still does. This effect is called tunnelling as it travels through the potential energy surface.
In general transition state theory tends to overestimate the reaction rate values compared to experimentally obtained ones. This is mostly due to the fact that it is assumed that all molecules that enter the transition state cross it. Good but more clarity if reactions in table were numbered. Where did this information on TST come from? reference. Also, how would this effect the rate of reaction? Sf3014 (talk) 17:24, 18 May 2020 (BST)
Exercise 2
By inspecting the potential energy surfaces, classify the F + H2 and H + HF reactions according to their energetics (endothermic or exothermic). How does this relate to the bond strength of the chemical species involved?
The energetics of both reactions were evaluated using the surface plot feature of lepsgui as shown below:
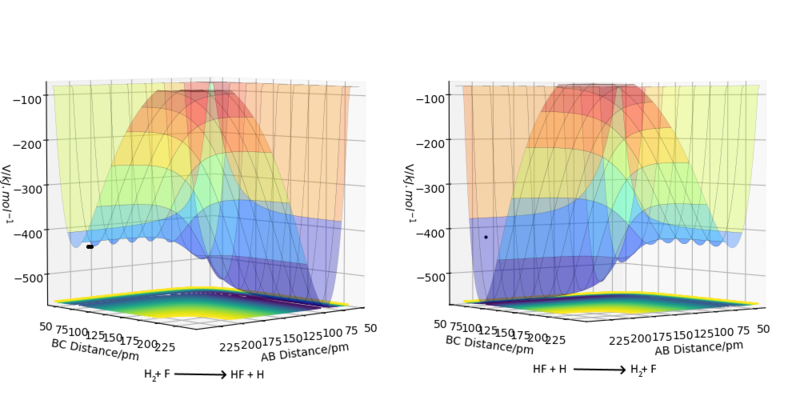
As can be seen in the potential energy surface diagram for the reaction of H2 + F the reactants are higher in energy than the products. Thus the reaction and between H2 and F is exothermic. In this reaction, the bond between H2 is broken and a new one between HF is formed. As the reaction is exothermic the energy required to break the bond in H2 has to be smaller than the energy released by the formation of the HF bond. Thus the HF bond is stronger than the of H2 bond.
The reverse is true in the reaction of HF and H. Here the reactants are higher in energy than the products and the reaction is endothermic. Thus energy released by the formation of the H2 bond is smaller than the energy required to break the bond in HF. Great. Comparison between bond energy values would be a great addition Sf3014 (talk) 17:27, 18 May 2020 (BST)
Locate the approximate position of the transition state.
The transition state was determined using the same methods as in question 1.2. However, as in this reaction, not all atoms are the same, the transition state will not be found at a point where and are equal.
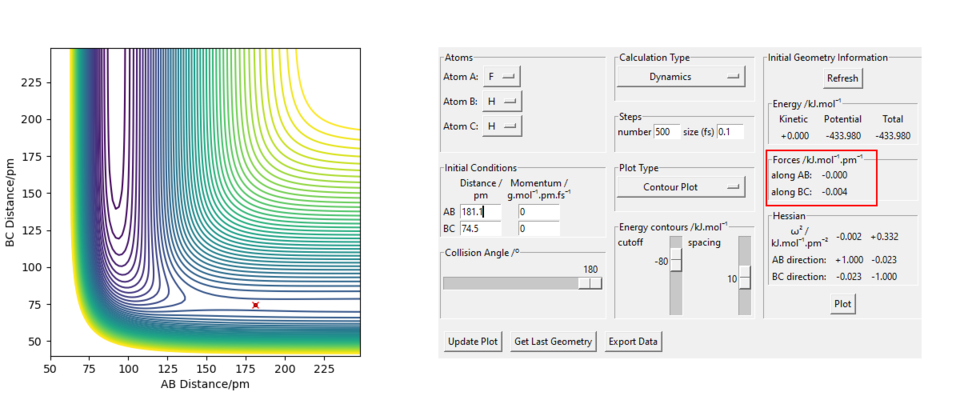
As can be seen above the transition state was found at were and . This is most probably not the exact transition state as the forces along the BC axis are not equal to zero. Good. Refer to figure Sf3014 (talk) 17:31, 18 May 2020 (BST)
Report the activation energy for both reactions.
The activation energy can be interpreted as the energy required to reach the transition state. Thus the energy of the system at the transition state was determined and then compared to the energy of the reactants for both reactions. The energy for the transition state was found to be -433.98 kJ/mol. The energy of the reactants was by setting the momentum to zero and adjusting the bond distances so that the molecule was at a local minimum (the bond length of the H2 or HF molecule) in the potential energy surface and very far removed from the F or H with which it is going to react.
H2 + F: The energy of the reactants was found to be -435.099 kJ/mol with H2 bond distance being 74 pm and 500 pm for the H2-F distance. Thus the activation energy is 1.119 kJ/mol.
HF + H: The energy of the reactants was found to -560.402 kJ/mol with HF bond distance being 91 pm and 500 for the HF-H distance. Thus the activation energy is 126.422 kJ/mol. Good. Answer can be explained further with energy vs time graphs Sf3014 (talk) 17:37, 18 May 2020 (BST)
In light of the fact that energy is conserved, discuss the mechanism of release of the reaction energy. Explain how this could be confirmed experimentally.
For a reactive trajectory, the HF distance was set to 181pm and the HH distance to 74pm. The momentum was set at 0 g.pm/mol.fs. As can be seen below after the products are formed very strong oscillations in the momentum between HF can be observed. Additionally, the HF-H momentum was observed to have a constant momentum after the reaction completed.

As energy needs to be conserved during this reaction and energy is released the products need to show a higher energy after the reaction. In the case of the formed HF molecule, this can be observed in the very strong oscillations in the HF bond momentum. This indicates that a significant part of the released energy is in the form of vibrations in the HF bond. The ejected H atom shows a constant momentum. This indicated that the molecule travels at a constant velocity. Thus, another part of the energy released by the energy was converted into translational energy of the H atom. The energy converted into the forms mentioned above must be equal to the energy released by the reaction as energy must be conserved.
The two above measured energy forms manifest as temperature. Thus the energy released by the reaction can be measured by bomb calometry. Good but more explanation needed on the use of bomb calorimetry Sf3014 (talk) 17:47, 18 May 2020 (BST)
Discuss how the distribution of energy between different modes (translation and vibration) affect the efficiency of the reaction, and how this is influenced by the position of the transition state.
For this question a series of reaction conditions for both H2 + F and HF + F were examined. For H2 + F rHH was set to 74 pm and rHF to 225pm. The momentum pHF was kept constant at - 1.0 g mol-1 pm fs-1 while varying pHH for all reactions except for the last one.
| pHH g mol-1 pm fs-1 | pHF g mol-1 pm fs-1 | Reactive | Etot kJ/mol |
|---|---|---|---|
| -6.1 | -1.0 | No | -402.845 |
| -4.1 | -1.0 | Yes | -421.245 |
| -2.1 | -1.0 | No | -431.645 |
| -0 | -1.0 | No | -433.955 |
| 2.1 | -1.0 | No | -427.445 |
| 4.1 | -1.0 | No | -413.045 |
| 6.1 | -1.0 | No | -390.645 |
| -1.6 | 0.2 | Yes | -432.774 |
As can be seen in the table above relatively few reactions are successful. The only successful reaction with pHF equal to -1 is the second one. However, the last reaction is reactive with a much lower energy (-432 vs -421 kJ/mol). This suggests that for this reaction the energy of the F atom is more important than the energy of the bond. This suggests that for this reaction the translational energy of the F atom is more important than the vibrational energy of the bond.
To evaluate the reaction of HF with H, rHF was set to 91 pm and rHH to 225 pm and reactions with high vibrational energy (high pHF) and with high translational energy (low pHH) were examined.
| pHH g mol-1 pm fs-1 | pHF g mol-1 pm fs-1 | Reactive | Etot kJ/mol |
|---|---|---|---|
| -20 | -0.1 | Yes | -161.696 |
| -18 | -0.1 | No | -237.496 |
| -0.1 | -20 | Yes | -351.165 |
As can be seen in the above table the energy the reaction with high translational energy has a very high energy while the one with a high vibrational energy has a low energy requirement. Thus it can be concluded that for this reaction the vibrational energy is more important. Good observations but answer incomplete. How does compare to the position of the transition state, where one direction is exothermic and the other is endothermic. Lab script gave you a hint with Polanyi's empirical rules Sf3014 (talk) 17:59, 18 May 2020 (BST)
References
1. J. I. Steinfeld, J. S. Fransisco, W. L. Hase; Chemical kinetics and dynamics; Pearson 1989; p. 287-290

