MRD:M4H1M4
EXERCISE 1: H + H2 system
Dynamics from the transition state region

On a potential energy surface diagram, how is the transition state mathematically defined? How can the transition state be identified, and how can it be distinguished from a local minimum of the potential energy surface?
The transition state is defined as the first order saddle point on the potential energy surface (PES) diagram. The derivative of potential energy is equal to the force acting on the atoms/molecules. At this point the gradient is equal to 0 and therefore no force is acting on the particles. This allows us to use a constrained one dimensional optimisation to calculate transition state. In order to verify this stationary point as the saddle transition state the Hessian eigenvectors can be used. Only one of the second derivatives must be negative and the other positive so that (fxxfyy - f2xy) < 0. Therefore the determinent of the Hessian matrix less than 0.
This verifies the point as a saddle rather than a local minimum of the potential energy surface. Good. Mak214 (talk) 18:06, 29 May 2020 (BST)
Trajectories from r1 = r2: locating the transition state
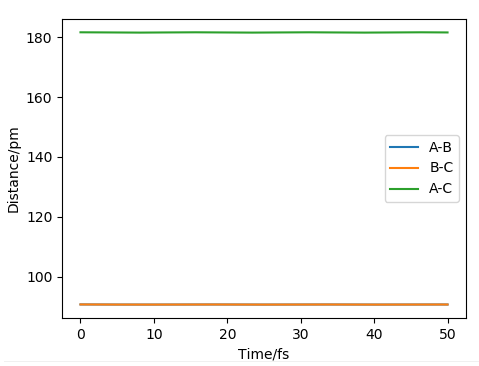
Report your best estimate of the transition state position (rts) and explain your reasoning illustrating it with a “Internuclear Distances vs Time” plot for a relevant trajectory.
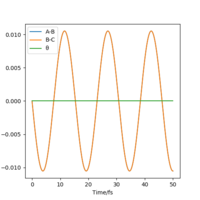
The the H + H2 ---> H2 + H surface is symmetrical, neither H2 or H atom are favoured.Therefore r1 is equal to r2 in the transition state. This restriction allows us to calculate the transition state position through a process of trial and error.
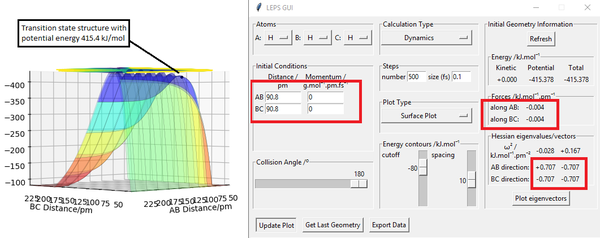

Transition state position r1= r2 = 90.8 pm
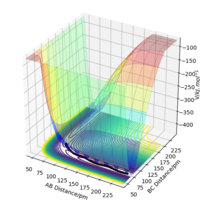
As shown in figure 1, at these positions the forces action along AB and BC are approximately 0 suggesting a stationary point. Figure 3 shows two horizontal lines with gradient 0 which therefore means 0 acceleration and 0 forces acting on the atoms.
Looking at the Hessian matrix we can verify this as a saddle point. To further confirm this, trajectories were calculated with either r1 or r2 being slightly displaced from equilibrium. Figure 4 shows that increasing r2 by 1 pm pushing the reaction to the reactant side figure 5 shows increasing r2 by 1 pm favours the formation of the products. Well done. Mak214 (talk) 18:06, 29 May 2020 (BST)

Trajectories from r1 = rts+δ, r2 = rts
Comment on how the mep and the trajectory you just calculated differ.
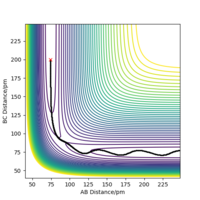
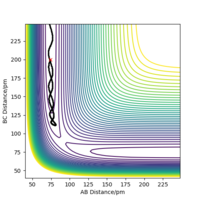
Figure 6 shows a straight line suggesting the velocity and momentum do not change with time. Figure 7, the dynamic trajectory, accounts for the oscillation of the bonds. Why? What are the conditions for the MEP calculation that lead you to see this. More discussion is needed here. MEP calculations involve resetting the momenta to zero at every time step so we end up finding the nearest local minimum.. Mak214 (talk) 18:06, 29 May 2020 (BST)
Final values of the positions r1(t) r2(t) and p1(t) p2(t):
r1=74.0 pm r2= 352.6 pm p1= 3.2 g.mol-1.pm.fs-1 p2= 5.1 g.mol-1.pm.fs-1
- Setup a calculation where the initial positions correspond to the final positions of the trajectory you calculated above, the same final momenta values but with their signs reversed.
What do you observe?
The reaction does not occur atom C reaches a constant velocity and atom B and A vibrate with constant acceleration.

Reactive and unreactive trajectories
Complete the table above by adding the total energy, whether the trajectory is reactive or unreactive, and provide a plot of the trajectory and a small description for what happens along the trajectory. What can you conclude from the table?
From this table we can conclude, trajectories with initial conditions in the range r1 =74 pm, r2 = 200 pm, with -3.1 < p1/ g.mol-1.pm.fs-1 < -1.6 and p2 = -5.1 g.mol-1.pm.fs-1 are always reactive. However trajectories higher momenta and therefore higher kinetic energy does not necessarily mean a successful reaction.This is evident by trajectory set 4 having a kinetic energy of 76.5 kJ/mol and resulting in no reaction and set trajectory 3 having only 19.8 kJ/mol and being successful. Increasing the momentum can lead to barrier crossing which if there isn't sufficient energy to cross back to the product channel can lead to overall no reaction.
Transition State Theory
Given the results you have obtained, how will Transition State Theory predictions for reaction rate values compare with experimental values?
Transition state theory assumes quasi-equilibrium between the reactants and the activated transition state complex and only requires details bout the PES. The Born-Oppenheimer approximation is used and quantum tunnelling affects are assumed to be negligible. The energies of the reactants also follow the Boltzman distribution curve.[1] From the table above we can see that quantum tunneling and barrier recrossing can occur, As TST does not account for that the value of rate calculated would be an overestimate compared to the experimental value. However error due to this is only marginal.[2] Think about this - barrier recrossing we do see in the table of results above and does mean that overall TST overestimates rate. However quantum tunnelling (not visible in your simulations above) leads to an underestimate in the rate predicted by TST because this is when the system can tunnel through an energy barrier - therefore reaching the products faster than we expect... Mak214 (talk) 18:45, 29 May 2020 (BST)
EXERCISE 2: F - H - H system
PES inspection

F + H2 ----> HF + H (1)
Initial conditions: p1= p2= 0 g.mol-1.pm.fs-1, r1=74.1 pm, r2= 400 pm
HF + H -----> H2 + F (2)
Initial conditions: p1=p2=0 g.mol-1.pm.fs-1 r1=400 pm, r2= 91.7 pm
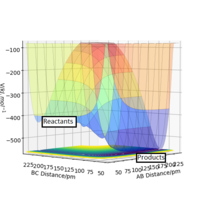

From figure we can conclude this reaction is exothermic as the formation of the H-F bond releases energy greater than the energy required to break the H-H bond. In the PES diagram as p2 decreases p1 increases the trajectory falls into the product channel at a lower energy than the products. This is reflective of the bonds being broken and formed. Reaction 2 is endothermic as the H-H bond being formed releases less energy than required to break the H-F bond. From this we can conclude the H-F bond is stronger that the H-H bond.
H-H bond energy = 435.7799 kJ/mol[3]
H-F bond energy = 569.680 kJ/mol[3]
Locate the approximate position of the transition state.
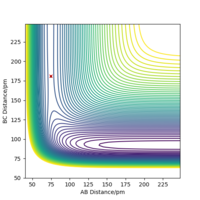
Fluorine is highly electronegative and so attacks the hydrogen early on in the reaction this is fitting of the exothermic characteristic of the reaction. Using the Hammond postulate, this early transition state therefore means that the structure of the transition state resembles that of the reactants. Using the liturature value of H-H bond length, r1 was set to 74.1 pm as an initial estimate.[4] Trial and error was performed in order to calculate the r1 and r2 values that give the closest to 0 kJ/mol.pm of force along the axis.
Transition state position - r1= 74.5 pm r2= 181.1 pm
Report the activation energy for both reactions.
To calculate the activation energy of both reactions the potential energy at transition state was recorded. The energy of the reactants of the forwards reaction was measured by setting r1 as the bond length of H2, 74.1 pm and r2 being set as 500 pm. This allows us to view the energy of the reactants when they are not reacting with each other. The same was repeated for the backward reaction using the bond length of HF, 91.7 pm as r2.[5]
Transition state energy = -434.0 kJ/mol
Energy of Reactants H2 + F = -435.1 kJ/mol Ea1 = 1.1 kJ/mol
Energy of Reactants HF + H = -560.7 kJ/mol Ea2 = 125.6 kJ/mol
Nice work. Well done. Mak214 (talk) 19:22, 29 May 2020 (BST)
Reaction dynamics
Set of initial conditions that results in a reactive trajectory for the F + H2: r1= 74.5 pm, r2= 130 pm, p1= -1g.mol-1.pm.fs-1 p2= -3 g.mol-1.pm.fs-1
Discuss how the distribution of energy between different modes (translation and vibration) affect the efficiency of the reaction, and how this is influenced by the position of the transition state.
Translational energy is required in order for the reactants to collide with one another with enough energy to react. However large amounts of excess translational energy can lead to the reacts rebounding off of each other. There is another question to answer here - look into Polanyis rules which talks about the trade off between translational and vibrational energy coming into a transition state. This can be related to exothermic and endothermic reactions favouring either vibrational or translational kinetic energy of reactants. A good report but not complete. See a couple of my comments. Mak214 (talk) 19:25, 29 May 2020 (BST)
- ↑ T. Bligaard, J.K. Nørskov, in Chemical Bonding at Surfaces and Interfaces, 2008
- ↑ PetersBaron , in Reaction Rate Theory and Rare Events Simulations, 2017
- ↑ 3.0 3.1 Luo, Yu-Ran. Comprehensive handbook of chemical bond energies. CRC press, 2007.
- ↑ Huber, K.P.; Herzberg, G., Molecular Spectra and Molecular Structure. IV. Constants of Diatomic Molecules,, Van Nostrand Reinhold Co., 1979
- ↑ NIST Diatomic Spectral Database (www.physics.nist.gov/PhysRefData/MolSpec/Diatomic/index.html)

