MRD:LUT1235
Physical Modelling Course - Year 2 Chemistry Imperial College London
Exercise 1: H + H2 System
1) What value does the total gradient of the potential energy surface have at a minimum and at a transition structure? Briefly explain how minima and transition structures can be distinguished using the curvature of the potential energy surface.
The total gradient of the potential energy surface at a minimum and at a transition structure is 0[1]. The transition structure can be distinguished as this is the point where maximum potential energy exists on the energy line that links the reactants to the products (Which energy 'line'? There's an infinity of them.) Je714 (talk) 15:58, 22 May 2017 (BST) . The double partial derivative of this point will be negative as it is a maximum on the potential energy line All of them? There's more than one Je714 (talk) 15:58, 22 May 2017 (BST) . The transition state can be further distinguished by the fact the the gradient either side of this maximum is steepest along the line between reactants and products.
The minima can be distinguished as its double partial derivative will be positive. Which one? There's more than one Je714 (talk) 15:58, 22 May 2017 (BST)
dV(ri)/dri =0 where dV(ri)/dri is the partial derivative of r with respect to V.
Small correction: they're called second derivatives, or second order derivatives (never heard of double derivative). Je714 (talk) 15:58, 22 May 2017 (BST)
2) Report your best estimate of the transition state position (rts) and explain your reasoning illustrating it with a “Internuclear Distances vs Time” screenshot for a relevant trajectory.
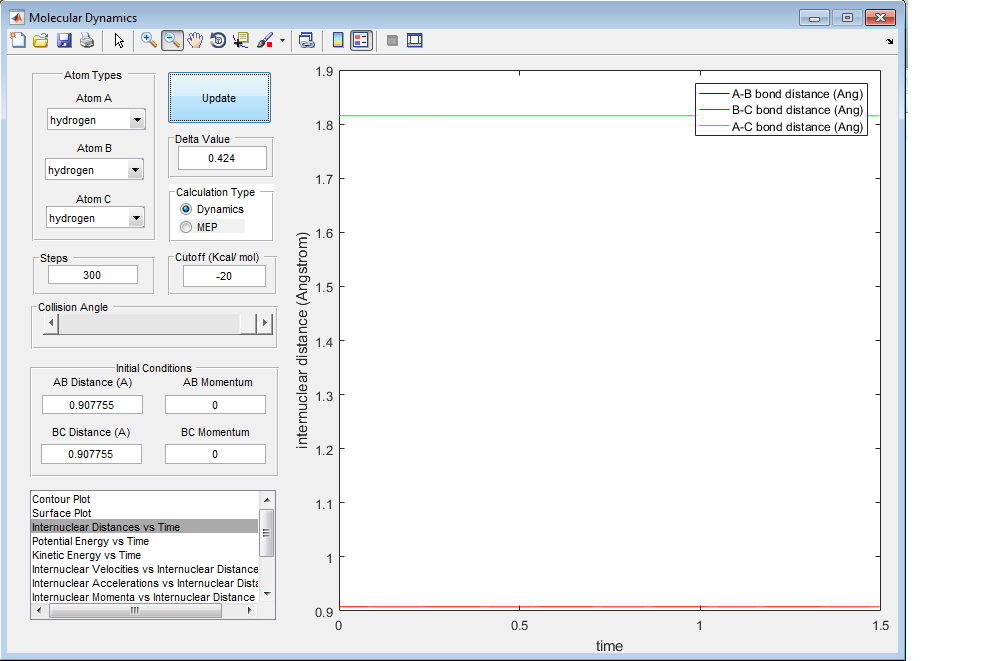
The best estimate given for the transition state position is given by the position where the vibrations are of a negligible proportion and the final momenta of the hydrogen molecules are 0.
rts=0.908 Angstroms
This was found for a trajectory gave the bond lengths to be constant with time as the following screenshot shows:
3) Comment on how the mep and the trajectory you just calculated differ.
The mep has no vibrations after the reaction has taken place. As shown by this surface plot, the molecules move in a straight line along the bottom of the valley once the reaction has taken place. This is due to the fact that the energy resets to 0 upon each calculation and so when the bond lengths reach the equilibrium distance the energy is set to 0 before the next calculation and so no further oscillations will take place Care, the velocities reset to 0, not the energies. The energy follows whatever value lies along the minimum.Je714 (talk) 17:18, 22 May 2017 (BST) . Therefore the momentum of the molecule (p=mv) is also 0 and therefore the molecule can only take the route of minimum energy and not deviate.
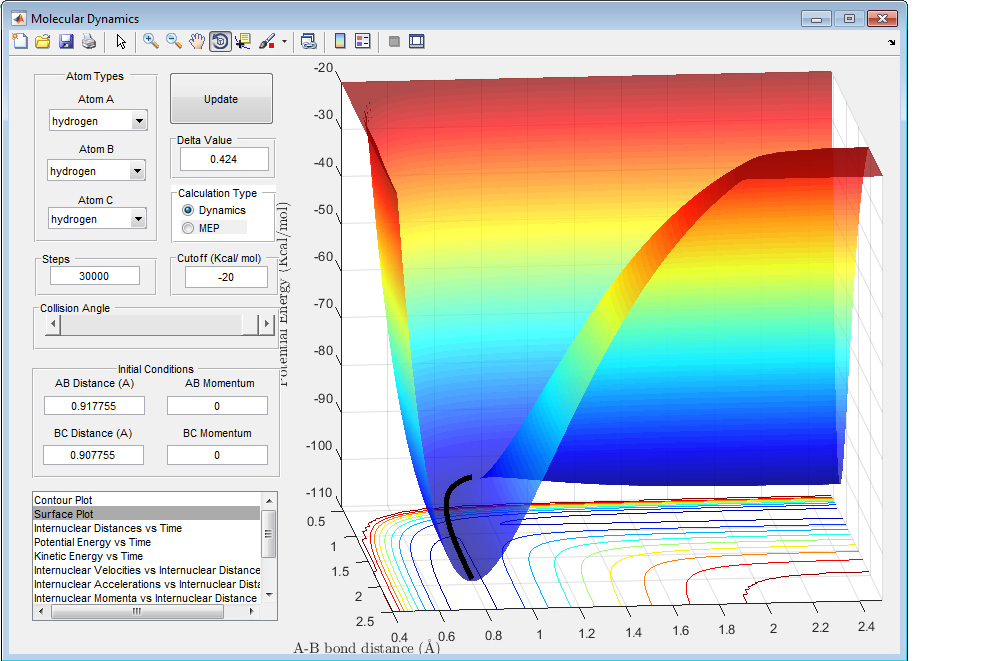
On the other hand, the dynamic trajectory includes some vibrations after the reaction has taken place. This is due to the fact that the programme takes into consideration bond vibrations and so the energy is not 0 and so can deviate from the minimum line, albeit very slightly.

4) What do you observe?
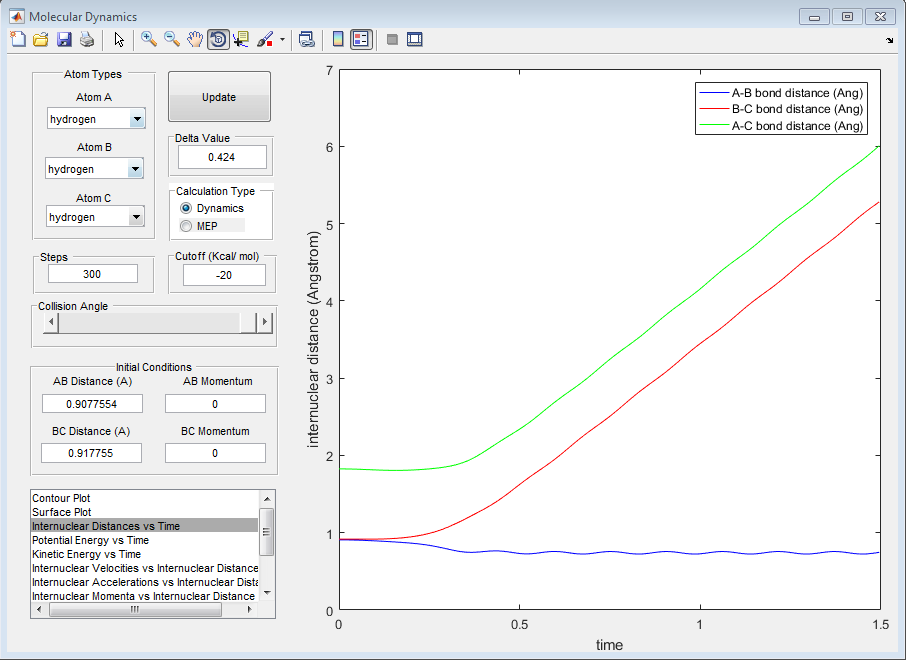
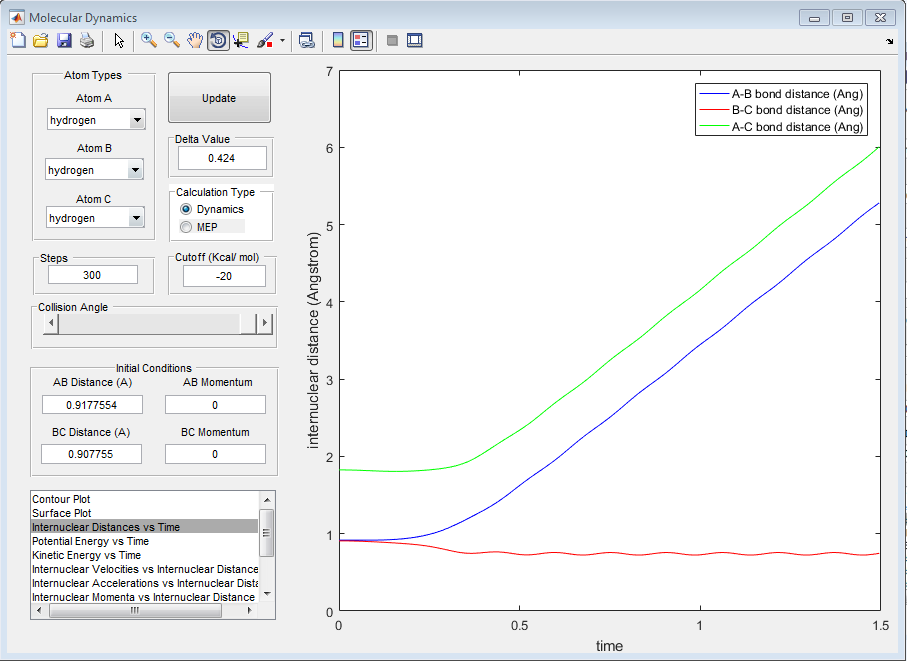
We observe that the momentum of the particles has changed and that their new momentum maps exactly onto the momentum of the particle on the opposite side of the molecule. As the graphs show, the momenta and the internuclear distance behaves exactly the same. This is due to the symmetry of the molecule. The graphs therefore are identical other than the labeling of atoms A, B and C.


5) Complete the table by adding a column reporting if the trajectory is reactive or unreactive. For each set of initial conditions, provide a screenshot of the trajectory and a small description for what happens along the trajectory.
6) State what are the main assumptions of Transition State Theory. Given the results you have obtained, how will Transition State Theory predictions for reaction rate values compare with experimental values?
The main assumptions of Transition state theory are that there are reactants that occupy one energy level and products which occupy a different energy level and these two plateaus are joined by a curve that passes through a maximum. This maximum is known as the transition state, where the energy of the arrangement of the molecules is the highest and therefore the arrangement is the least stable. The gap between the reactant energy level and the energy of the transition state is known as the activation energy. This model assumes that if we give a group of molecules enough energy (in excess of the activation energy), then the molecules will always rearrange into the products.
The limitation of this model is in the fact that as we apply more energy to the system then the results get more chaotic and the results of which become more uncertain - something that is not accommodated in the transition state model. Giving the molecules a lot of energy means that the reaction can cross the activation barrier several times and be effected by several different factors including solvent and other reaction molecules.
Therefore the rate of reaction predicted by the Transition State Theory will be larger than the experimental rate of reaction as the experimental rate will be affected by molecules bouncing over the activation barrier several times.
Good discussion and relation to your observations. If you look up other information sources, you'll see that this is not the only limitation (but it's the one that's apparent in this lab) Je714 (talk) 17:18, 22 May 2017 (BST)
EXERCISE 2: F - H - H system
1) Classify the F + H2 and H + HF reactions according to their energetics (endothermic or exothermic). How does this relate to the bond strength of the chemical species involved?
Locate the approximate position of the transition state.
The reaction plot of H2 + F to form HF +H shows that the energy of the products is lower than the energy of the reactants. This suggests that the reaction is exothermic. The energy of the products is shown in the graph below coming out of the page towards us.
The reverse reaction of HF+ H to form H2 + F is the exact reverse of this reaction and is therefore endothermic.
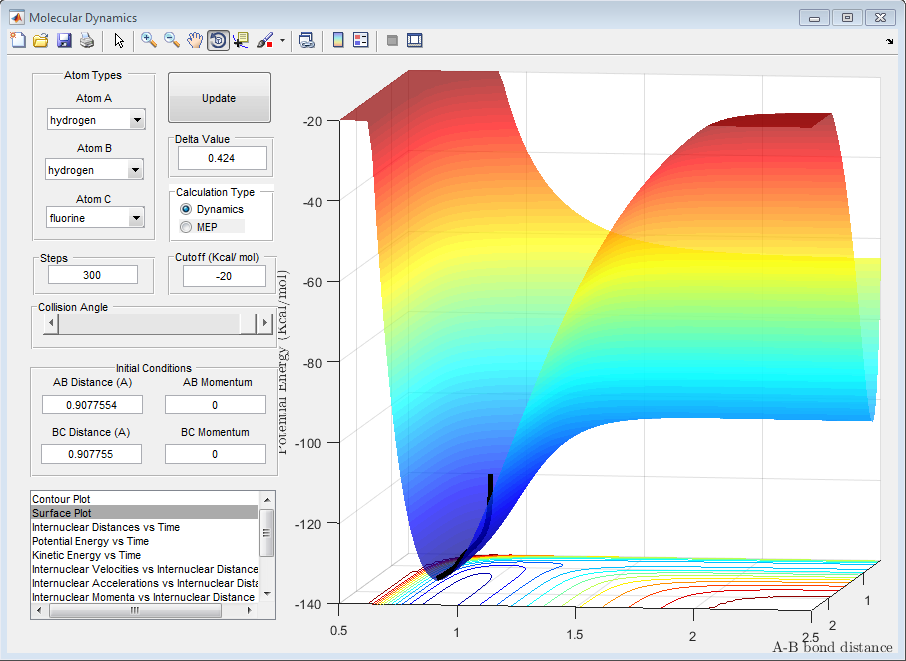
The reaction of H+HF to form HF+H is symmetrical and as the products and reactants are identical, they cannot be distinguished unless they are in a lattice or they are chemically labelled. Therefore, the reaction is neither exothermic nor endothermic.
This fact that a reaction is exothermic or endothermic is a reflection on the stability and the bond strength of the reactants and the products. The side of the reaction with lower energy (whether this is the reactants in the case of an endothermic reaction or the products in the case of an exothermic reaction) is the more stable side. This means that the HF bond formed in the case of the above exothermic reaction is stronger than the H-H bond that is present in the reactants. This means that, taking the transition state (point of highest energy on the minimum energy path from reactants to products) as the point of reference, more energy is released when the stronger HF bond is formed compared to the energy released when the H-H bond is formed.
From Hammonds Postulate which suggests that 'If two states appear in consecutive steps of a reaction and involve only a small difference in energy, then the difference between the two states involves a small rearrangement of molecules'.
This suggests that the transition state appears more like the side of higher energy than the side with lower energy. In this case, The transition state will appear more similar to the reactants than the products and therefore the covalent bond between the hydrogen atoms will probably still exist and therefore r1= 0.745 Angstroms[2] whilst r2 will be much greater than the 0.94 Angstrom[2] bond length of HF.
The approximate transition state was found by setting the momenta to 0 and setting r1= 0.745 Angstroms, and then increasing r2 until the internuclear distance remains constant. During the trials, by starting from a smaller HF bond length than the HF bond length in the transition state, this means that the molecules lay on a gradient that took them towards the HF + H products side of the reaction and so further measurements were required in which the HF bond length was expanded. This can be seen in the graph below, where the HF bond length was still too short for equilibrium.
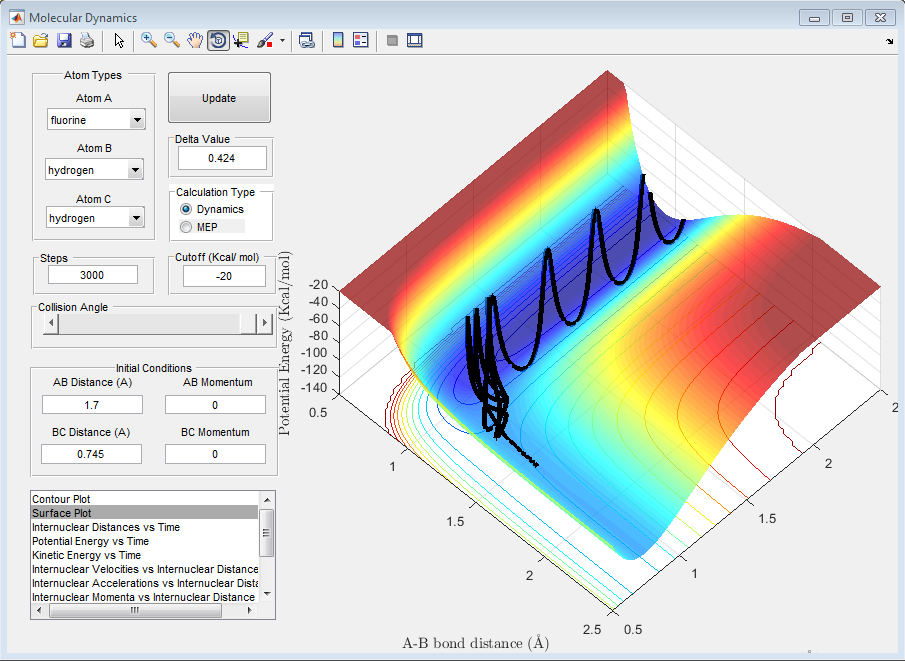
The approximate transition state position was found to be:
r1= 0.745 Angstroms
r2= 1.81 Angstroms
Which to 3 significant figures:
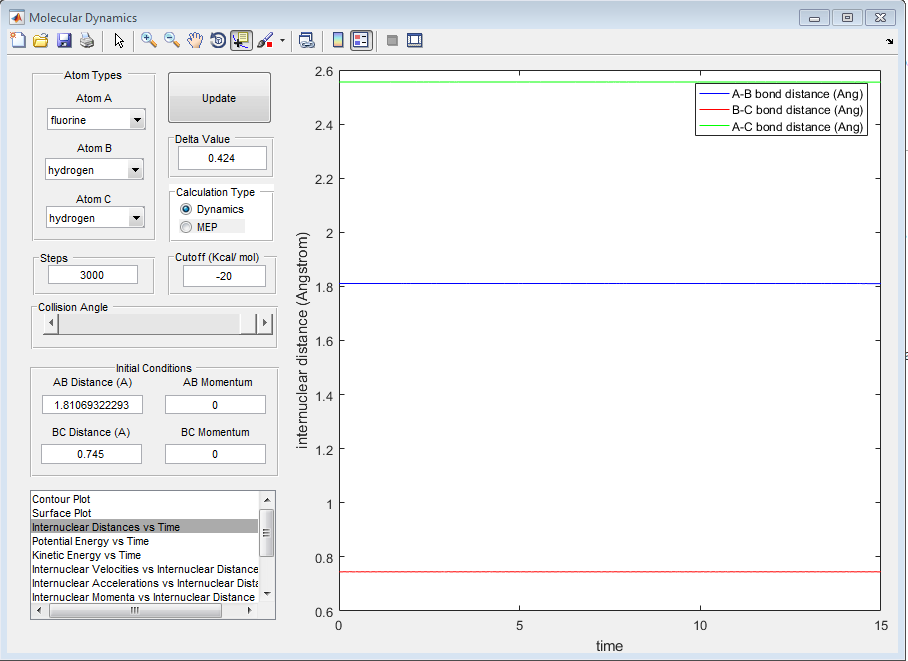
r2= 1.81 Angstroms
This is shown by the internuclear distance graph below:
2) Report the activation energy for both reactions.
The activation energy of this reaction is the energy difference between the energy of the reactants and the energy of the transition state. The energy of each state can be seen as the z co-ordinate of each of the positions in the graph.
This can be measured by using the co-ordinate picker on the surface plot as can be seen when used for the transition state energy point on the graph below
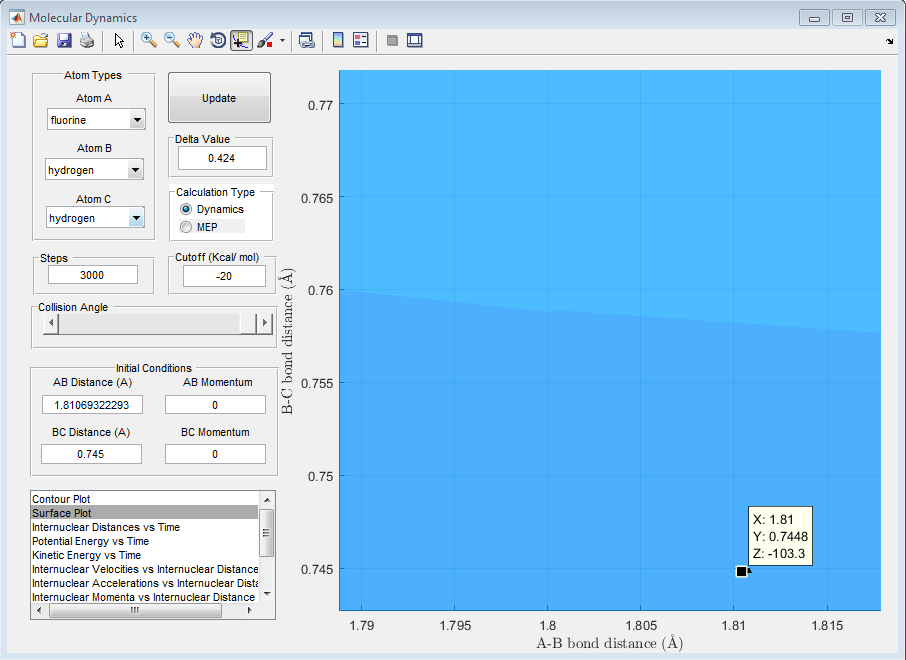
Therefore the energy of the transition state is -103.3 kcal mol-1.
Similar calculations find that for the HF + H system, the energy of the system is found to be -133.9 kcal mol-1 whilst the energy of the H2 + F system is found to be -103.9 kcal mol-1.
i) H2 + F --> HF + H
The activation energy of this reaction is found to be:
-103.3-(-103.9)=0.6 kcal mol-1 = 2510 J mol-1
ii) HF + H -->H2 + F
The activation energy of this reaction is found to be:
-103.3-(-133.9)= 30.6 kcal mol-1 = 128 kJ mol-1
An MEP run reveals that the transition state energy is more accurately found to be -103.75 kcal.
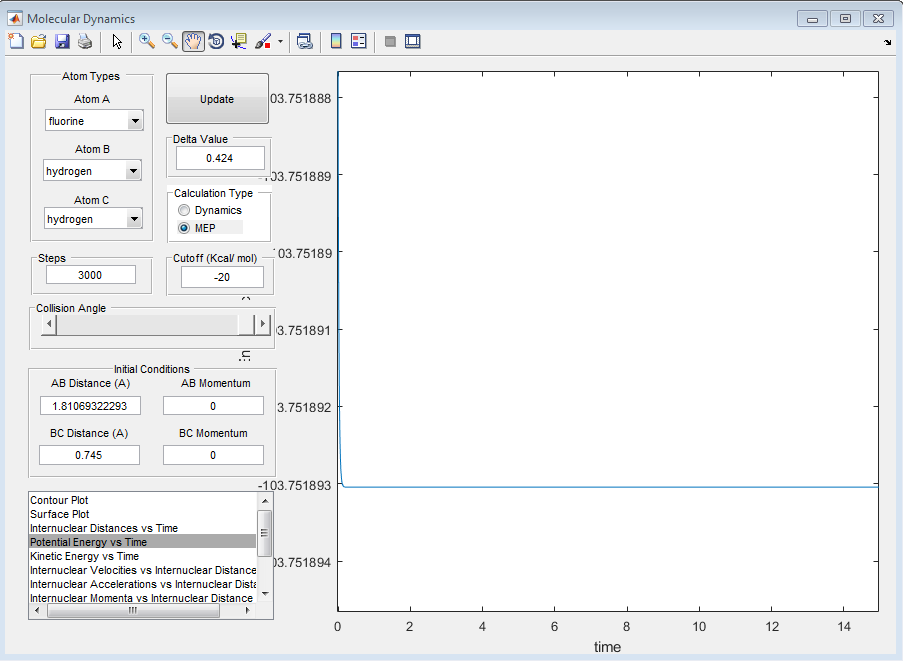
Completing the same calculations for the activation energy gives the following results:
i) H2 + F --> HF + H
The activation energy of this reaction is found to be:
-103.75-(-103.9)=0.15 kcal mol-1 = 627.6 J mol-1 (4 s.f)
ii) HF + H -->H2 + F
The activation energy of this reaction is found to be:
-103.75-(-133.9)= 30.15 kcal mol-1 = 126.1 kJ mol-1 (4 s.f)
3) In light of the fact that energy is conserved, discuss the mechanism of release of the reaction energy. How could this be confirmed experimentally?
The reaction conditions that allow for a successful reaction between F and H2 can be seen in the surface plot below and are as follows:
rHH: 0.74 Angstroms
rHF: 2.30 Angstroms
pHH= -0.5 Ns
pHF= -1 Ns
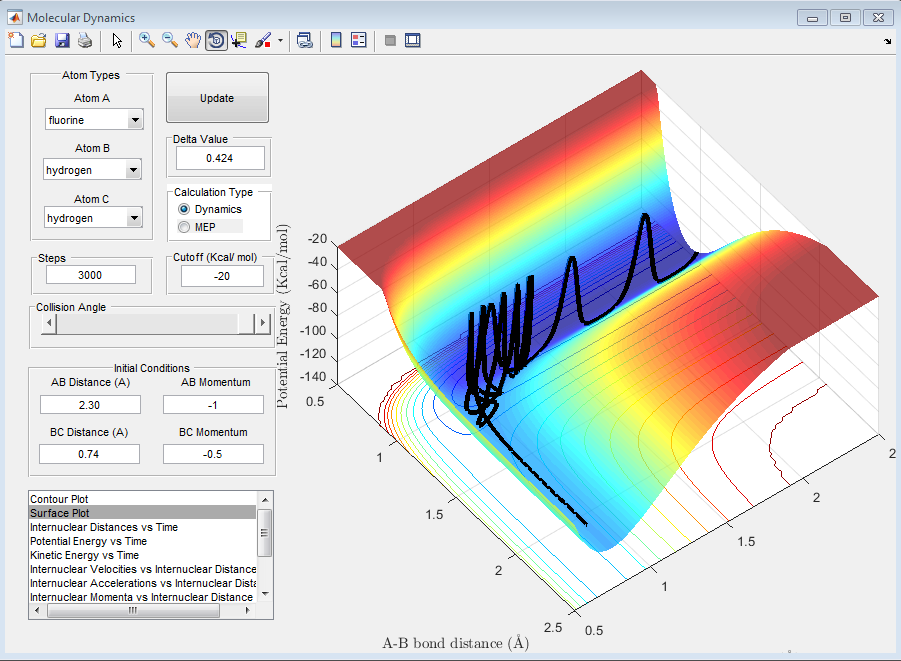
As can be seen, the momentum of the fluorine atom with respect to the the hydrogen molecule has to be high enough in order that the fluorine atom can approach close enough that it can react with the hydrogen molecule. As previously discussed, the reaction is endothermic, the potential energy decreases. From the conservation of energy, this means that some form of kinetic energy must be increased in order to counter the decrease in potential energy. From the graph, this appears to be an increase in vibrational energy, this can be seen due to the increase in oscillations up and down the wall of the potential well as the molecule disappears off into the distance. The bond length has large oscillations which requires kinetic energy. Furthermore, this energy could be dissipated as rotational energy and in the momentum of the products.
This could be confirmed experimentally by calorimetry. This measures the heat released by the reaction - this heat is in effect the kinetic energy of the particles being passed on to other molecules as they bump into each other without reacting.
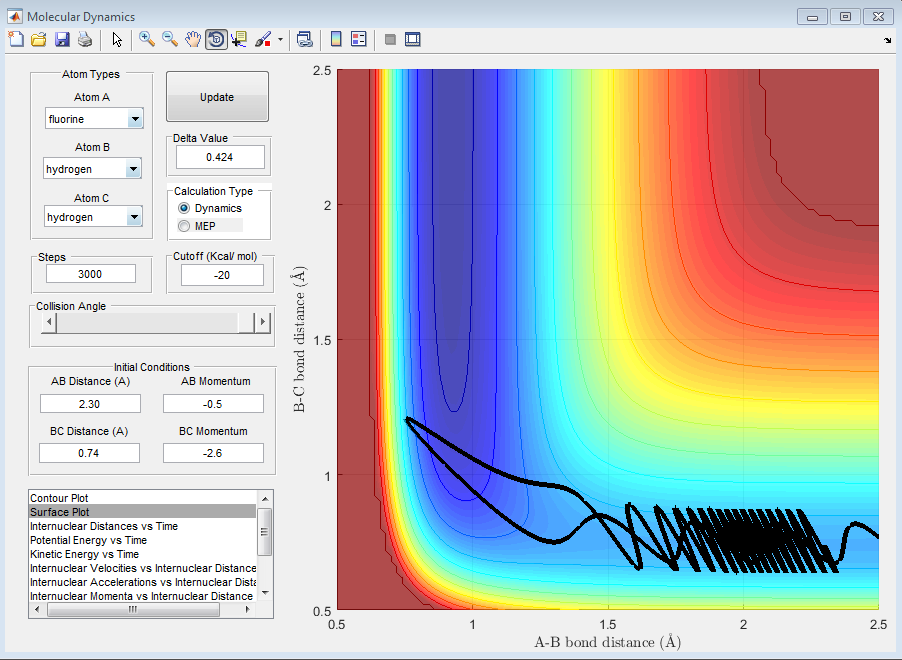
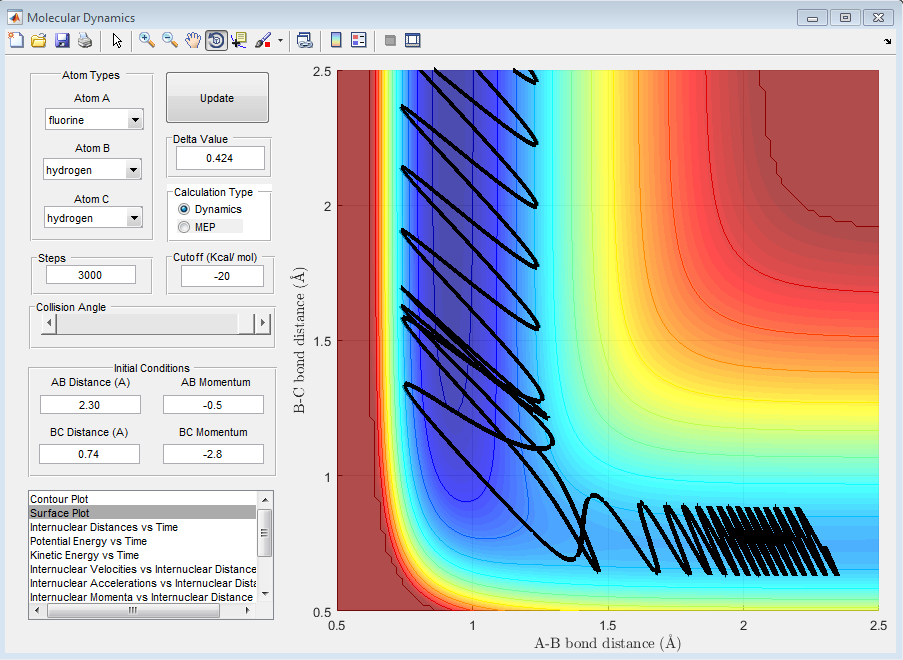
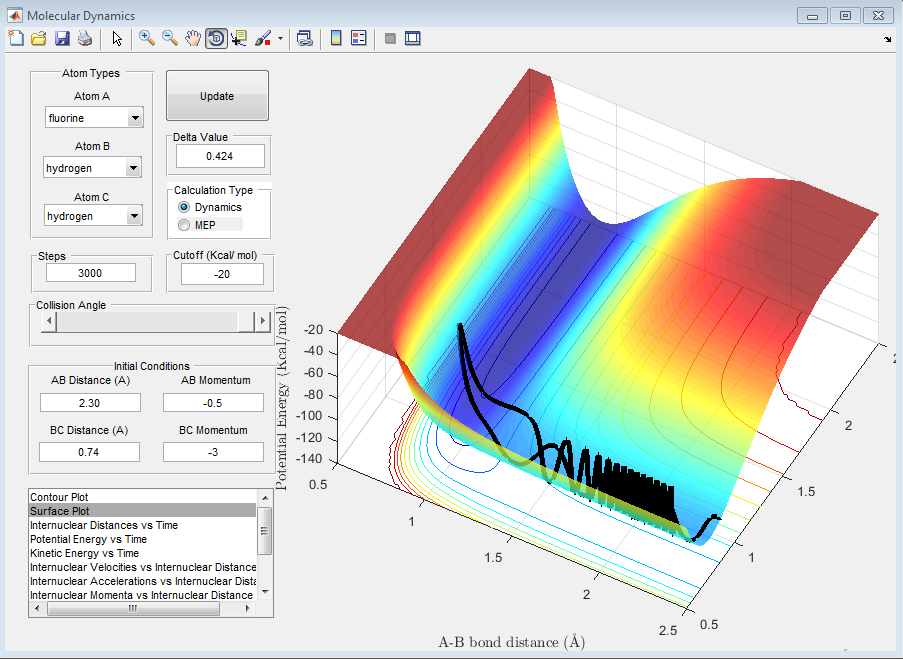
4) Setup a calculation starting on the side of the reactants of F + H2, at the bottom of the well rHH = 0.74, with a momentum pFH = -0.5, and explore several values of pHH in the range -3 to 3 (explore values also close to these limits). What do you observe? Note that we are putting a significant amount of energy (much more than the activation energy) into the system on the H - H vibration.
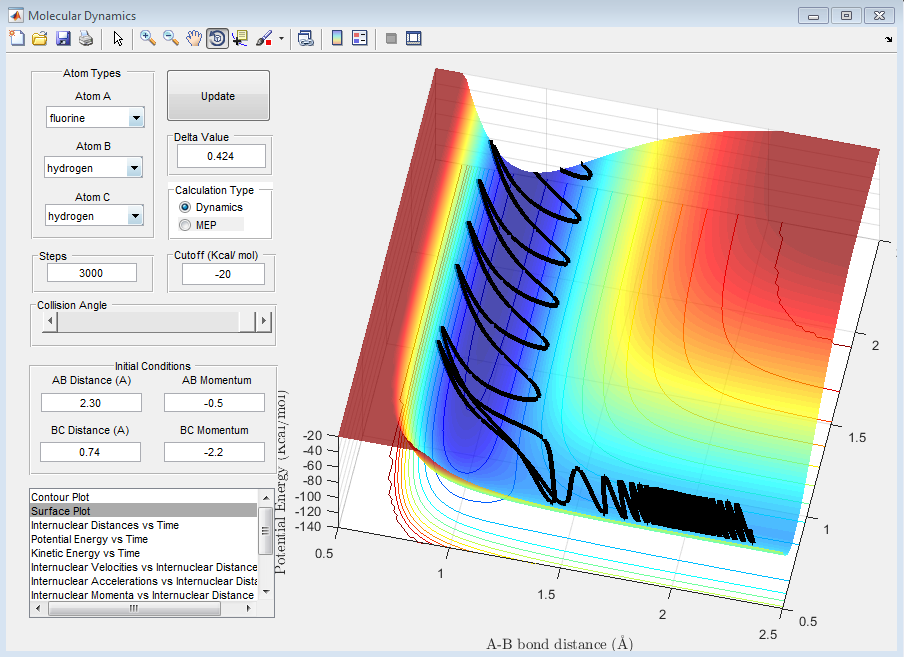
It is noticed that when |3|>PHH>|2|, the reaction goes through stages when the momentum is enough so that the system is reactive but also goes through stages where the system is not reactive as the vibrational energy of the H-F bond that is formed is so great that it breaks itself once formed and the H2 molecule is reformed.
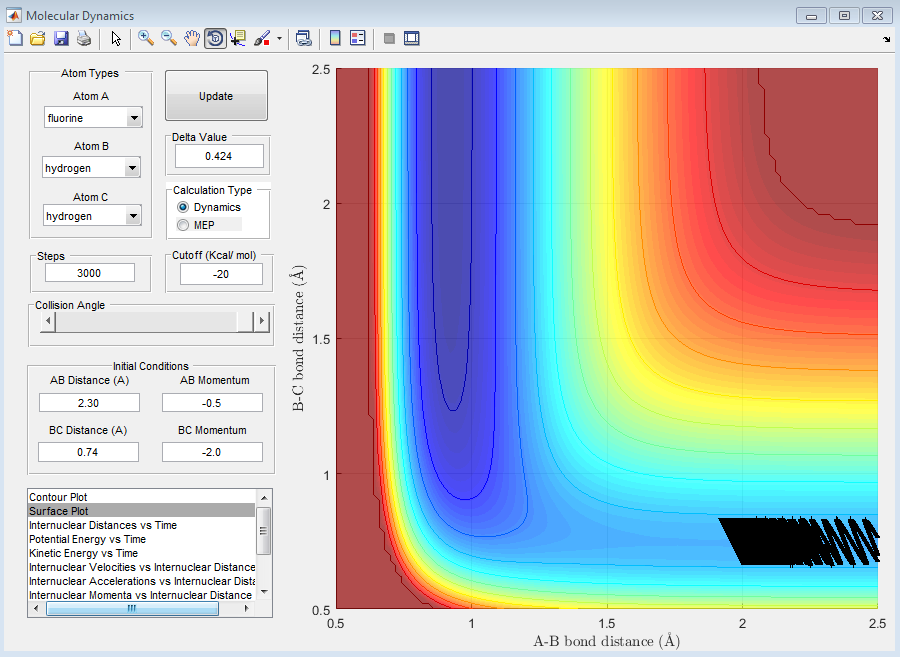
When PHH<|2|, no matter what the value, the reaction is unsuccessful. This is due to the fact that the momentum of the fluorine is not relatively large enough to approach close enough to the molecule to react or even influence the H2 bond length, despite the fact that the oscillations between the to hydrogen atoms are still quite large. This can be seen in the following graphs.
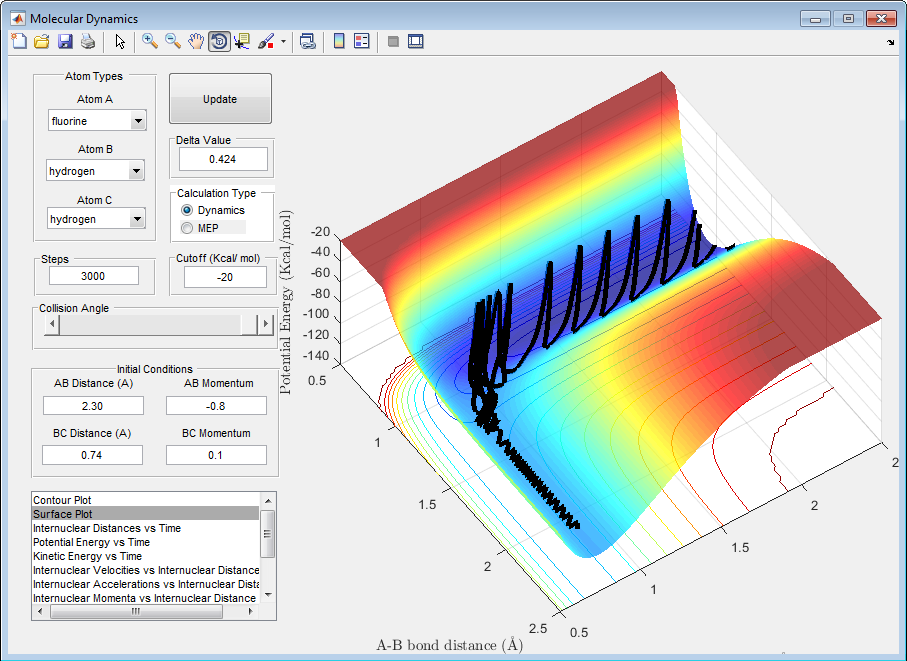
5) For the same initial position, increase slightly the momentum pFH = -0.8, and considerably reduce the overall energy of the system by reducing the momentum pHH = 0.1. What do you observe now?
We observe that the system is now set up to be successful but it takes some time for the final result to be known. This is due to the fact that the reaction is proposed to pass through the transition complex several times as the potential and vibrational energy is such that the molecules of HF and HH are continually breaking apart and reforming as can be seen in the graph below.
6) Discuss how the distribution of energy between different modes (translation and vibration) affect the efficiency of the reaction, and how this is influenced by the position of the transition state.
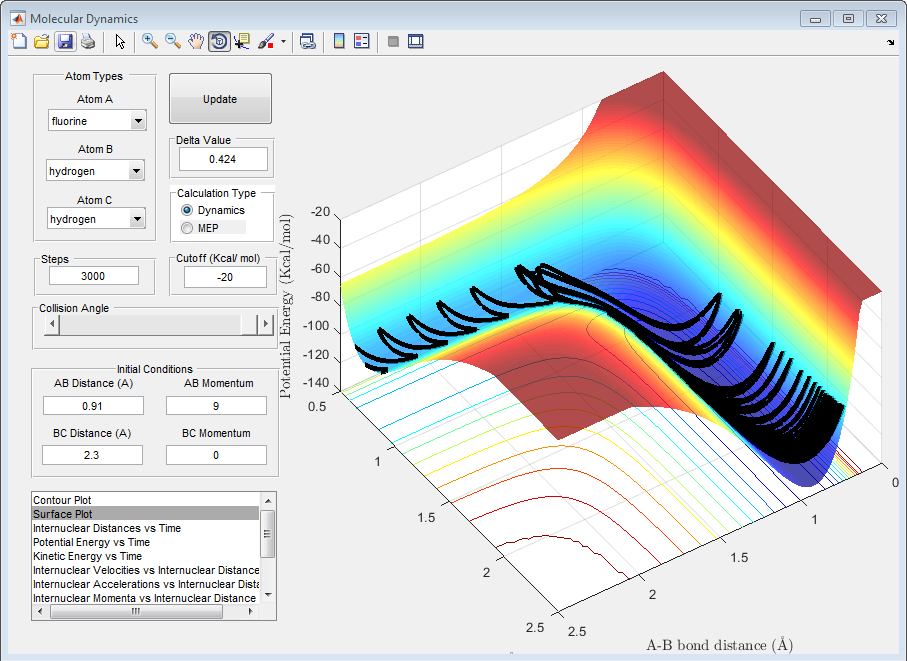
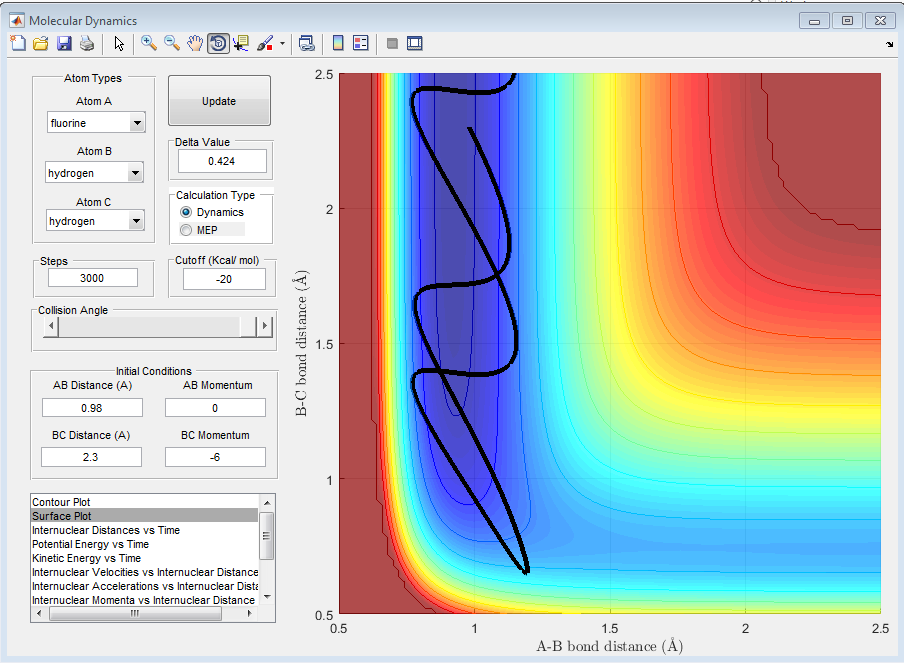
Polanyi Rules state that vibrational energy is more efficient in promoting a transition state resembling the products - a late transition state - than translational energy. The opposite is true for a transition state resembling the reactants. In this case translational energy is more likely to promote the transition state.[3]
Therefore, as the reaction of HF + H has a late transition state, if the value of the translational energy is too high, then the reaction will not work as the products will split up again. This reduces the efficiency of the reaction as, even if the molecules have the required energy to theoretically get over the activation energy and past the transition complex, with too much translational or vibrational energy, the molecule will bounce back to the reactants, meaning it was unsuccessful.
These are empirical rules as they have not been proved and have been bought about to explain the experimental observations.
The following graph shows that when rotational energy is high, and the transition state is late, then the reaction has a greater chance of succeeding.
The following graph shows that when translational energy is high, and the transition state is late, then the reaction has a smaller chance of succeeding.
References
- ↑ Atkins. P, Paula. J, Physical Chemistry, Oxford University Press, 2014
- ↑ 2.0 2.1 T. L. Cottrell, The Strengths of Chemical Bonds, 2d ed., Butterworth, London, 1958; B. deB. Darwent, National Standard Reference Data Series, NationalBureau of Standards, no. 31, Washington, 1970; S. W. Benson, J. Chem. Educ. 42:502 (1965); and J. A. Kerr, Chem. Rev. 66:465 (1966).
- ↑ Theoretical Study of the Validity of the Polanyi Rules for the Late-Barrier Cl + CHD3 Reaction, Zhaojun Zhang, Yong Zhou, Dong H. Zhang, Gábor Czakó, and Joel M. Bowman, 2012 3 (23), 3416-3419, DOI: 10.1021/jz301649w


