MRD:LJ4717 COMPLAB
H + H2 system
Q1: On a potential energy surface diagram, how is the transition state mathematically defined? How can the transition state be identified, and how can it be distinguished from a local minimum of the potential energy surface?
definition A transition state is defined as the maximum on the minimum energy path, which means when we travel in two different directions, it will be the maximum in one direction and minimum in another direction.Let's suppose we have a function of x and y, f(x,y).Mathematically, the transition state must satisfy the condition below. The transition state is also know as the saddle point on a potential energy surface diagram.
| second derivative test discriminant, D | minimum | maximum | saddle point |
|---|---|---|---|
| D=fxx fyy-fxy fyx | D>0,fxx >0 | D>0,fxx <0 | D<0 |
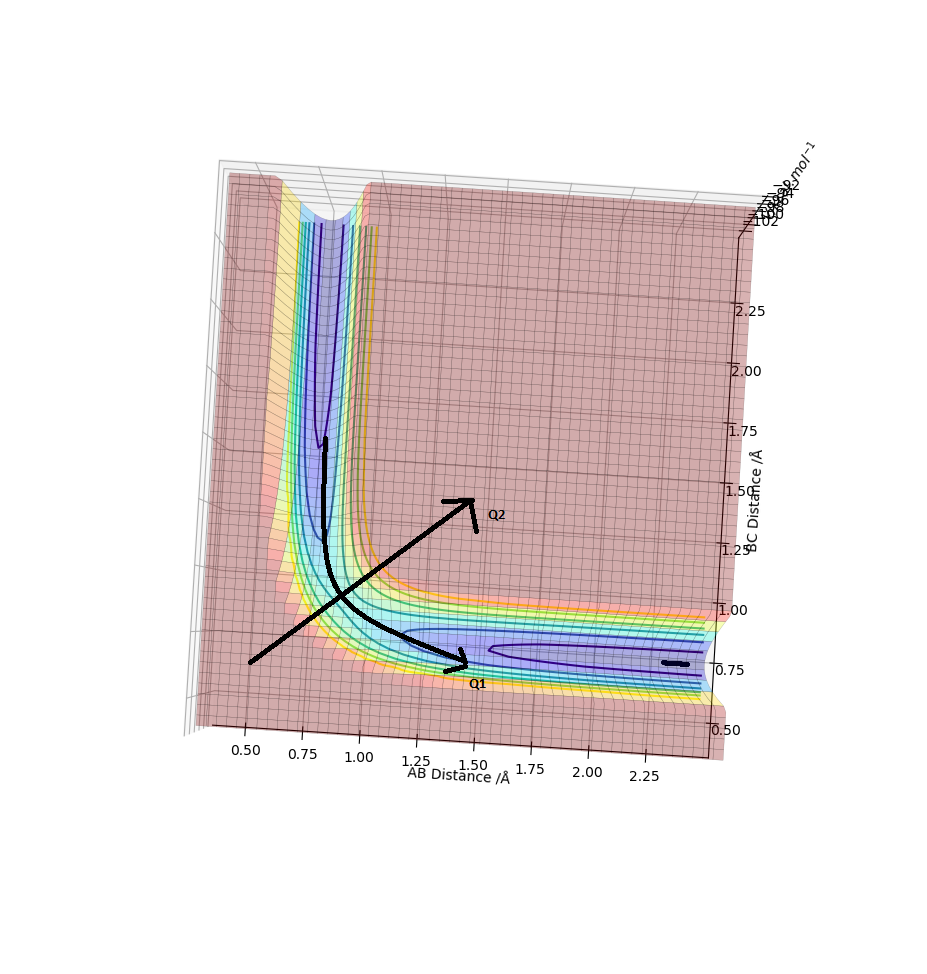
On the surface plot below,red means we have high potential energy while blue means low.As can be seen, when we travel along Q1 direction, the energy increases to a maximum and drop back down. On the other hand, if we travel along Q2 direction the energy decreases to a minimum and intersects with the maximum point of Q1. This intersection of Q1 and Q2 will be the saddle point and i.e. our transition state.
Q2: Report your best estimate of the transition state position (rts) and explain your reasoning illustrating it with a “Internuclear Distances vs Time” plot for a relevant trajectory.

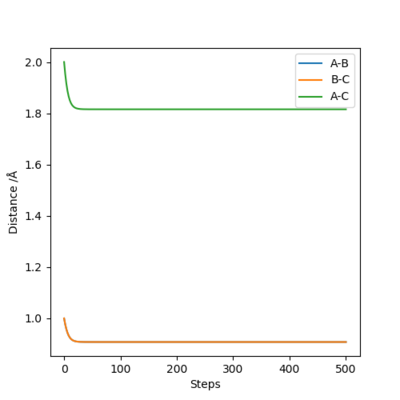
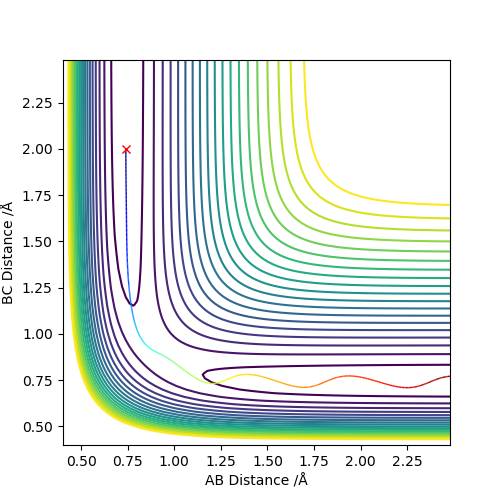
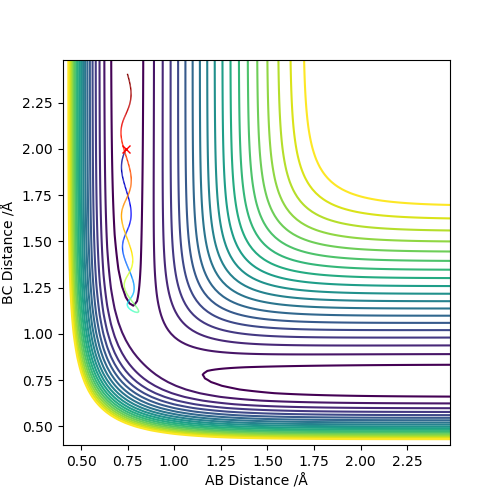
By setting r1=r2=1,and p1=p2=0,using MEP method,the best estimate of transition state position will be r1=r2=0.9996Å.(left) In the “Internuclear Distances vs Time” plot, difference between distances is constant, which explain it is the transition state.(right)
Q3:Calculating the reaction path,comment on how the mep and the trajectory you just calculated differ.
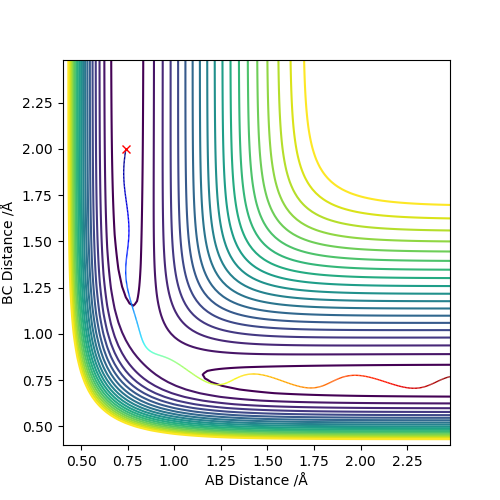
calculate when r1 = rts+0.01, r2 = rts and the momenta p1 = p2 = 0. So r1=1.0096 and r2=0.9996.
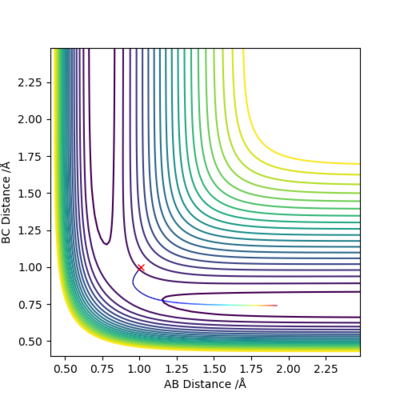
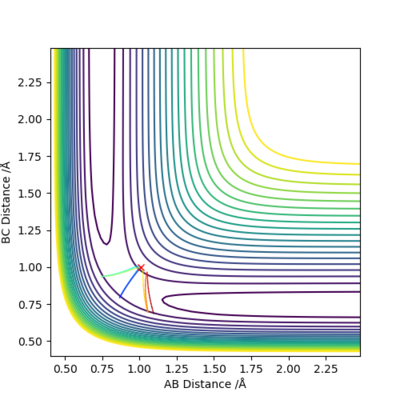
As shown on both graphs, the path in dynamic is vibrating in a region while path in MEP plot just travel smoothly.This is because kinetic energy is conserved in the dynamic contour plot,but not for MEP plot.
I don't really think you've chosen the best plots to illustrate this as we should see the vibrating trajectory of a Dynamics pathway on the potential energy surface (the black line showing oscillations) as well as a MEP pathway on a potential energy surface (smooth black line from reactants to products). Your description is brief yet it is correct. Rk2918 (talk) 12:01, 20 May 2019 (BST)
If we using r1 = rts, r2 = rts+0.01 instead, the path will travel on BC distance direction rather than AB distance on both graphs.
Q4:Complete the table above by adding the total energy, whether the trajectory is reactive or unreactive, and provide a plot of the trajectory and a small description for what happens along the trajectory. What can you conclude from the table?
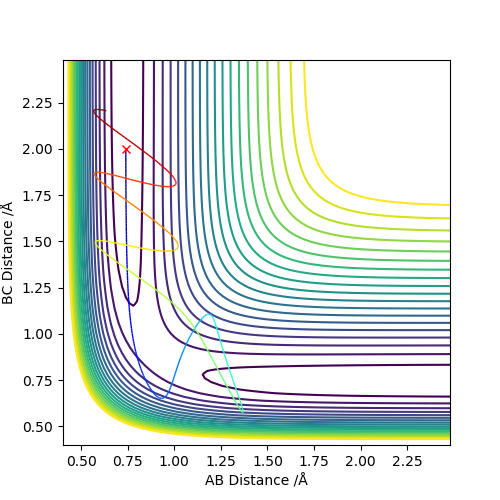
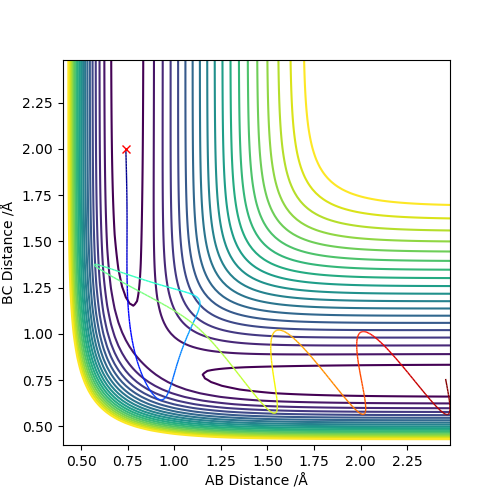
From the previous calculations we can conclude that trajectories with initial conditions in the range r1 = 0.74, r2 = 2.0, with -1.5 < p1 < -0.8 and p2 = -2.5 are reactive
- For the initial positions r1 = 0.74 and r2 = 2.0, run trajectories with the following momenta combination and complete the table.
Conclusion:
- reactant start with same potential energy,but different momentum, Kinetic energy=p2/2m, which means kinetic energy is different.
- reactant with higher kinetic energy will be more reactive,i.e. higher chance for successful reaction
- However,higher energy is not guaranteed for successful reaction,as reactant would be reformed sometimes
Q5:State what are the main assumptions of Transition State Theory. Given the results you have obtained, how will Transition State Theory predictions for reaction rate values compare with experimental values?
- Barrier can not be recrossed once it crossed the transition state position.
- Reactants are in constant equilibrium with the transition state structure.
I vaguely see that you understand but you need to do a bit more in terms of explaining in depth to demonstrate your thorough understanding of your observations. It is probably helpful to write in full sentences as you will need to write a full descriptive explanation. Rk2918 (talk) 12:04, 20 May 2019 (BST)
- Seen experimental data 4 in Q4 above, the reactant is reformed so that the rate of reaction will decreases.
EXERCISE 2: F - H - H system
Q6:By inspecting the potential energy surfaces, classify the F + H2 and H + HF reactions according to their energetics (endothermic or exothermic). How does this relate to the bond strength of the chemical species involved?Locate the approximate position of the transition state.
| reaction | Energetic | Bond Strength | Position of Transition State |
|---|---|---|---|
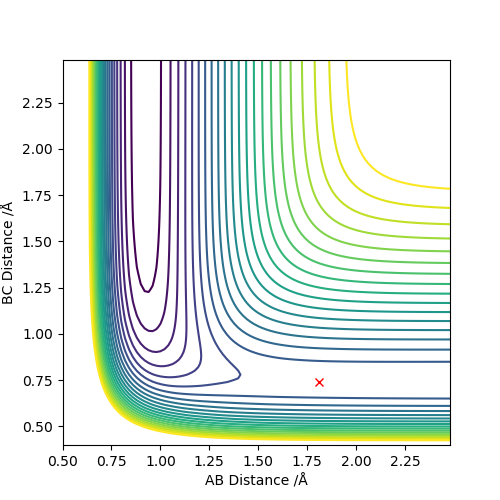
| F + H2 → HF + H | Exothermic | HF Bond formation (-565 KJ/mol) and Breaking H2 Bond (+436KJ/mol) | r1 = 1.81 , r2 = 0.74 |
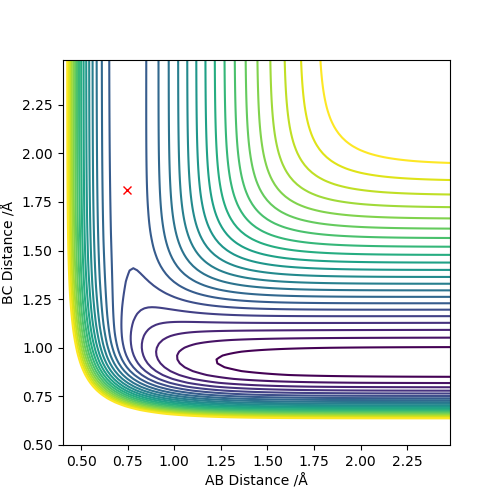
| H + HF → F + H2 | Endothermic | H2 Bond formation (-436KJ/mol) and Breaking HF Bond (+565 KJ/mol) | r2 = 1.81 , r1 = 0.74 |
exothermic if bond strength formation > bond strength broken endothermic if bond strength formation < bond strength broken
Do try to make your answers clear and well structured. This is not a complete explanation which is a shame as you clearly understand what is going on. Also, you shouldn't just stick figures in and let the reader figure out which is which and why you have included them. Don't include a figure if you're not going to discuss it in full in the text, explaining what it shows and how this supports your argument/observations. Rk2918 (talk) 13:20, 20 May 2019 (BST)
Q7:Report the activation energy for both reactions.

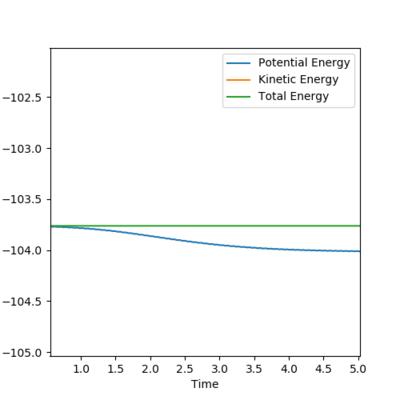
activation energy is shown in both graphs
Q8:In light of the fact that energy is conserved, discuss the mechanism of release of the reaction energy. Explain how this could be confirmed experimentally.
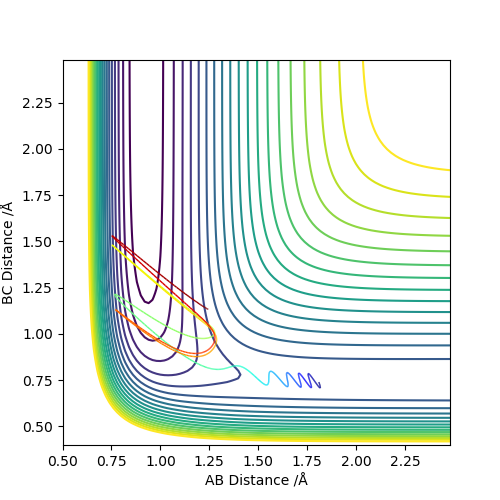
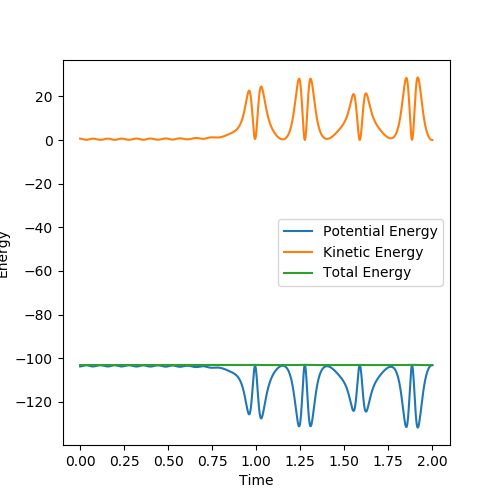
initial conditions:r1=1.81,r2=0.74,p1=-0.5,p2=-1 Potential energy decreases and kinetic energy increases as reaction proceeds,total energy stay the same justify the energy is conserved.In the contour plot on the left,the H-H bond is vibrating but once F-H bond formed,the hydrogen left and F-H bond continued to vibratiing.
You haven't answered the question. You have not said what the mechanism of energy release is and you have not commented on how this could be confirmed experimentally. Rk2918 (talk) 13:24, 20 May 2019 (BST)
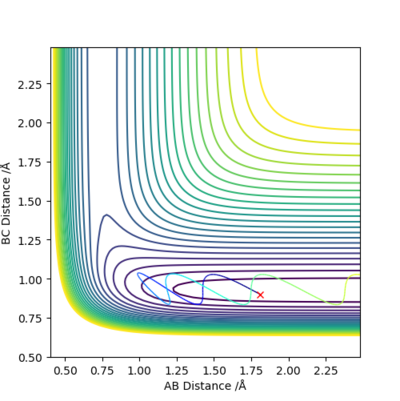
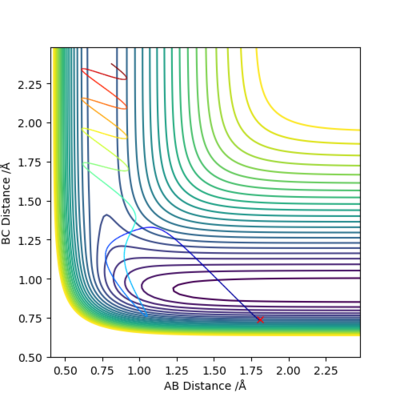
Q9:Discuss how the distribution of energy between different modes (translation and vibration) affect the efficiency of the reaction, and how this is influenced by the position of the transition state
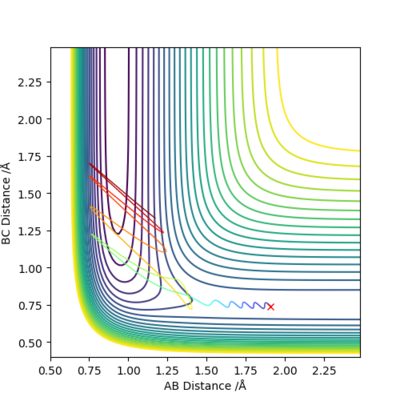
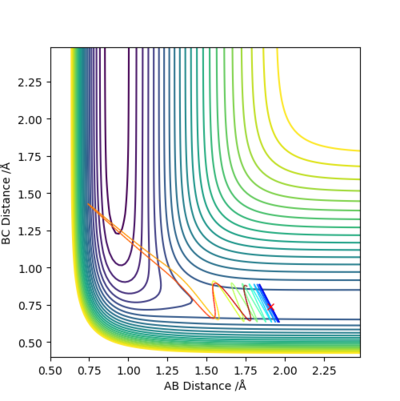
Conclusion:
- In +F + H2 → HF+H reaction,it is early transition state.
- Thus higher in vibration energy would make it more reactive.
- In H + HF → F + H2 reaction, it is late transition state.
- Higher in transition energy would make it more reactive
Based on what? Why is vibrational energy better for an early transition state? Where does this theory come from? You can't make statements like this without supporting them with theory and associated literature references. Rk2918 (talk) 13:26, 20 May 2019 (BST)

