MRD:LH31152ndyear
Computational physical laboratory
Exercise 1: H2 + H
for this Wiki r1 = rab in Matlab and r2 = rbc in Matlab. The initial bond is A-B and the final bond is B-C.
Transition states and minimum energy
The total gradient at the transition state is 0 as it is the highest energy structure in the reaction thus the second derivative is negative as it is the local maximum. The minimum structure has a total gradient of zero as well, as it is the minimum point in the plot and therefore has a positive second derivative as it is the local minimum.
On the potential energy surface these two points are simply the highest point for the transition state and the lowest energy state.
(Fv611 (talk) 11:44, 25 May 2017 (BST) Should have included a discussion on the directions of the second derivatives: for the TS, the second derivative is negative only in the same direction as the reaction coordinate. Why?)
Determining Transition state distance
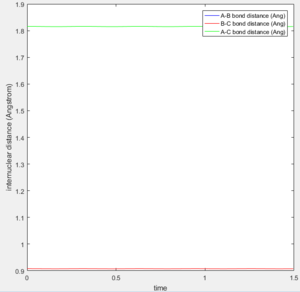
The transition state distance was determined to be 0.908 Armstrong. This was determined as at the transition state r1= r2= rts. At the transition state the distances don't change as there is no force acting on the particle if the distance is set to be the transition state distance. This is because force is the negative first derivative of potential energy and as explained above at the transition state that is 0, therefore the force is 0. So no change in position.
(Fv611 (talk) 11:44, 25 May 2017 (BST) "as there is no force" is not the best wording.)
Trajectories for r1 = rts + 0.01 and r2 = rts
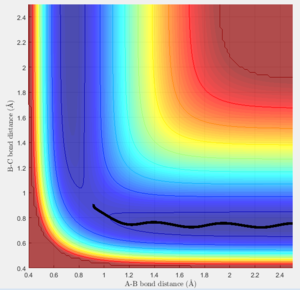
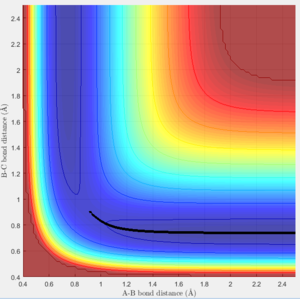
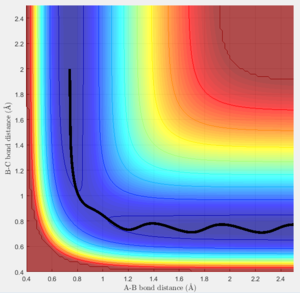
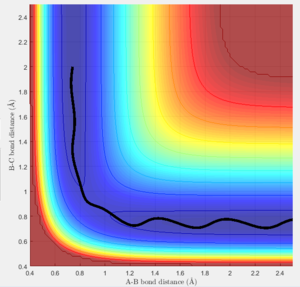
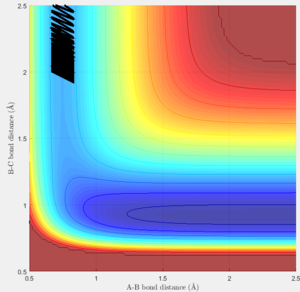
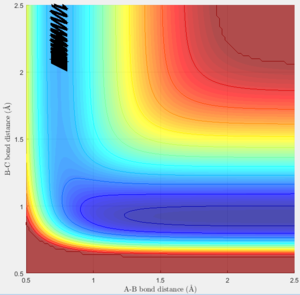
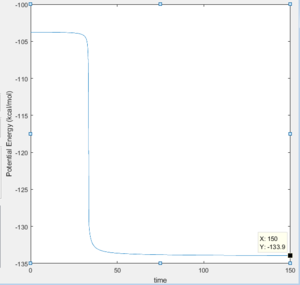
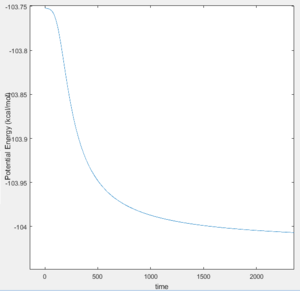
The trajectories of the two graphs (Figure 2 and 3) were calculated using two different calculation types: Dynamic and minimum energy path (mep).
For the trajectories one can see that both increase constantly for r1, while for r2 they reach a minimum and either stay on it or oscillate around it. This occurs as initially r1 is slightly greater than rts and r2 is equal to rts. So the overall potential energy is lower than transition state and as the distance r2 is smaller it collapses to bond B-C.
For the dynamic graph (Figure 2) one can observe oscillation around the bond length while the mep doesn't. This is because the in mep (figure 3)the velocity is reset to 0 on each step, which causes the kinetic energy to be 0 at each step. So once the potential minimum is reached the bond length will not change. While for the dynamic due to energy conservation oscillation will be observed.


As seen in the graphs for the internuclear distance against time, the time varies depending on whether mep or dynamic is used. In the minimum energy path (mep) the change is much slower due to the velocity always resetting to 0, while for the dynamic one the same picture is seen but it proceeds at a much faster pace. In the mep the start of the reaction can be observed and In the dynamic one it can be observed that r2 oscillates once it reaches the bond length while r1 increases steadily.

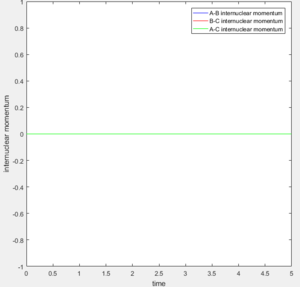
From Figure 6 and 7 one can see that for the dynamic calculation type the momentum oscillates, while in the mep due to the velocity resetting to 0 on every step the momentum is 0.
In this case changing r1 or r2 doesn't matter as both reactants and products are the same.
Reactive and unreactive trajectories
Transition state theory
Assumptions [1]:
- Atomic nuclei behave according to classical mechanics
- Unless molecules or atoms collide with sufficient energy the reaction won't occur (excludes tunneling)
- Reaction will occur via saddle point
- Once it passes the transition state it cannot come back
Transition theory results will have lower rates compared to experimental results, especially at high temperatures and for low activation energies.
As both the tunneling probability and the higher vibrational states can lead to the reaction occurring via different pathways.
(Fv611 (talk) 11:44, 25 May 2017 (BST) Good, but could have expanded the discussion a bit more.)
Exercise 2: F-H-H system
Note that bond length A-B for the graphs is F-H and B-C is H-H.
The F + H2 reaction is exothermic while the H + HF reaction is not favored. In the surface plot of the energies of the F-H-H system (Figure 13) one can see that the H-H bond is higher in energy compared to the H-F bond.
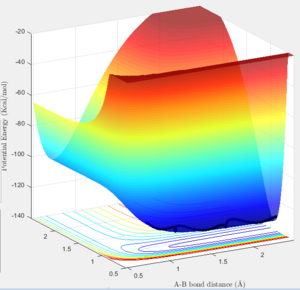
This suggests that H-F bonds are stronger than H-H bonds as the energy for H-F bond is lower thus more energy required to break bond
This is also right according to literature values indicated by bond strength. Energy needed to break H-H bond 432 KJ/mol [2]and Energy needed to break H-H bond 565 KJ/mol [2].
Location of transition state
According to Hammond postulate [3] the Transition state resembles the structure to which it is closest in energy. So in this case it resemble the bond lengths of the H-H bond as this is higher in energy therefore closer to the Transition state energy.
By using this theory and the energies on the surface plot the transition state position is at rHH = 0.745 and rHF = 1.810. It was determined as at these locations the positions of the particles do not change, which as stated above is requirement for the saddlepoint as the first derivative in any direction is 0.
Activation energy for both reactions
The activation energy for the reaction F + H2 is equal to 30 kcal/mol with 100000 steps for an mep calculation.
This shows that the formation of HF is very much favored and that the transition state looks very much like the H-H atom.
The activation energy of the formation of H-H is much smaller at 0.2 kcal/mol with 500000 steps for an mep calculation.
This suggests that the transition state looks a lot like the H-H structure due to the energy difference being much smaller compared to H-F bond.
Reaction dynamics
The conditions used for the reaction were rHF = 2.3 and rHH = 0.74, with momenta pHF = -6 and pHH = 0.
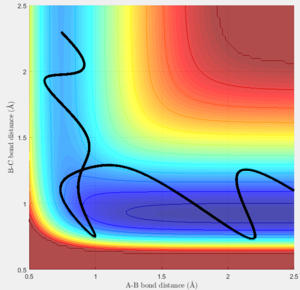
From the animation and the surface plot the trajectory of F is observed. As F approaches H-H oscillates. F passes the transition state and gets very close to Hb. It then increases in distance again and starts oscillating as Hc moves further and further away.
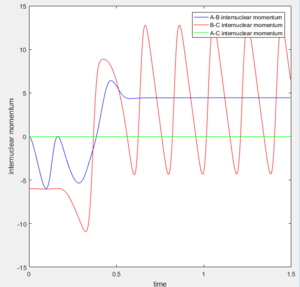
From the plot in figure 17 one can tell that initially the oscillation of the H-H bond is smaller than the final oscillation of the H-F bond. This is due to the fact that the F atom comes with a high momentum and that the bond gains kinetic energy as it goes to a lower energy. This can all be said because of energy conservation.
Due to the fact that the potential energy is converted to heat calorimetry can be used to measure the change and it could be confirmed. However it does not give the kinetic energy contribution of the system.
(Fv611 (talk) 11:44, 25 May 2017 (BST) Ok, but a more in depth discussion would have been better.)
Polanyi's empirical rules
Polanyi's rule states that the further the energy of the transition state is the smaller the translational energy required for the reaction to occur. On the other hand vibrational energy becomes more important [4].
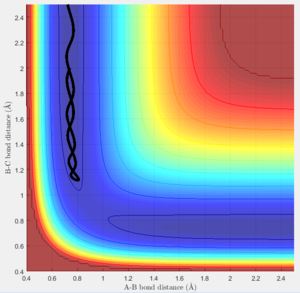
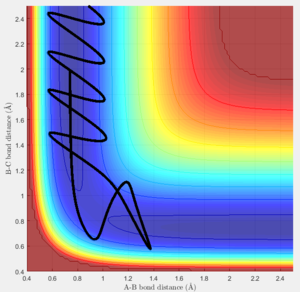
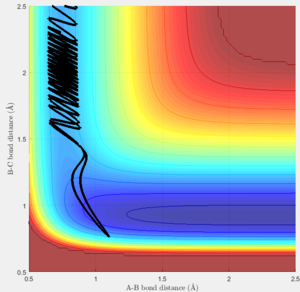
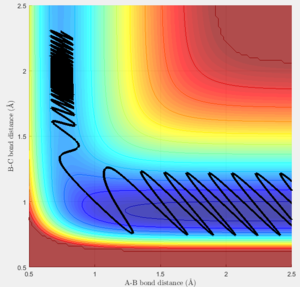
Of the plots above only figure 24 leads to a completed reaction while the rest didn't react. This shows that whether a certain set of conditions leads to a reactions has to be calculated or tested even if the activation energy is fulfilled.
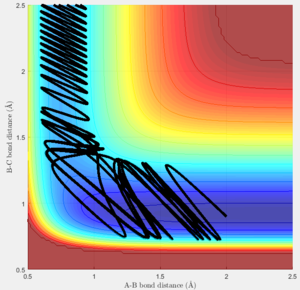

The last 2 plots (figure 28 and 29) show that the simulation follows Polyani's rule, as in the endothermic reaction, the vibrational part of the energy plays a more important role than the translational part. This is seen as lowering the translational energy (lowering PHH) and increasing the vibrational energy contribution (increasing PHF) leads to a smoother and faster reaction.
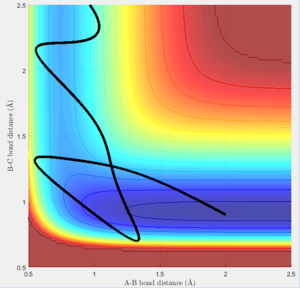
However the rules break down as the figure figure 30 shows where the translational energy contribution is very high and vibrational very low. But the reaction still proceeds.
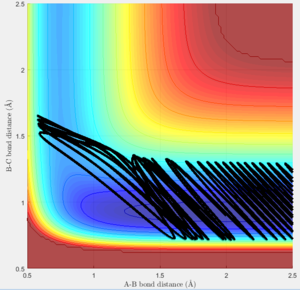
Another point where the rules break down is in the case figure 31 where the conditions of the energy contributions are met as they are in between the 2 successful runs of figure 28 and figure 29.
This shows that Polyani's rules can be helpful in limiting possibilities of reaction paths and determining whether or not something reacts at all, but they are not consitstent.
(Fv611 (talk) 11:44, 25 May 2017 (BST) You clearly have looked into a lot of cases, but there isn't much point in listing very similar points without describing them in detail. Also, "the further the energy of the TS" is a very unclear sentence. Well done on mentioning limitations of Polany's rules, but you could have tried making a guess on why they don't always work.)
References
- ↑ 1.0 1.1 IUPAC, Compendium of Chemical Terminology, 2nd ed. (the "Gold Book") (1997). Online corrected version: (2006–) "transition state theory"
- ↑ 2.0 2.1 2.2 http://www.wiredchemist.com/chemistry/data/bond_energies_lengths.html accessed on 12/may/2017
- ↑ 3.0 3.1 Fox and Whiteshell, Marye Anne and James K. (2004). Organic Chemistry. Sudbury, Massachusetts: Jones and Bartlett Publishers. pp. 355–357.
- ↑ 4.0 4.1 Polanyi, John C. "Concepts in reaction dynamics." Accounts of Chemical Research 5.5 (1972): 161-168.

