MRD:LH1216
Molecular Reaction Dynamics Computing Lab
Lucy Haggerty
EXERCISE 1: H + H2 system
Dynamics from the transition state region
The H + H2 potential energy surface has minima at both the reactants and products as at these points the molecules are stable. The gradients, δV/δr2 and δV/δr1, for reactants and products respectively are equal to zero. As they are both minima, the second order derivative will be greater than zero (positive).
The transition state is the saddle point on the potential energy surface at which the molecules have no momentum so their trajectories will not appear to 'roll' along the minimum energy pathways towards the products or reactants. The minimax point is shown in Figure 1 below. The gradient at this point is also equal to zero so in order to distinguish it from the local minima, the second partial derivative test has to be carried out. A Hessian matrix can be calculated by taking the second order derivatives of the energy with respect to the atomic coordinates. The following determinant can then be used where a value less than zero indicates a saddle point and a value greater than zero indicates a minima point. [1]
where D is a critical point of f and f{r1r1}(r1r2) is the second derivative with respect to r1r1
Trajectories from r1 = r2: locating the transition state
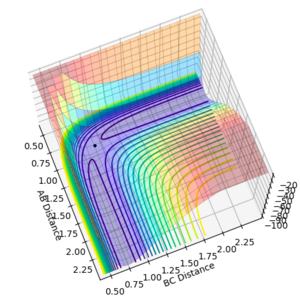
The transition state position is the specific point where the momentum is zero and the trajectories do not appear to move to either reactants or products. In order to estimate an accurate value for rts, a range of r1=r2 values were tested, ranging between 0.9 and 1.00 Å. This range was decided by analysing the point of intersection during a reaction on the internuclear distance vs time plot. Equal values of r1 and r2 were used as the triatomic system is symmetric. It was found that at 0.91 the pathway appeared to be just a point. However, the internuclear distances vs time graph portrayed a large curve and with an increase of steps to 1000, it was shown that the point in fact 'rolled' towards the products.
What reaction are you looking at? Good that you justified equal distances with a symmetric reaction.
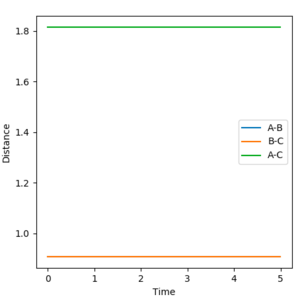
With further modifications of r, the number of steps was increased to 1000 and MEP calculation type was used. This allowed a far more accurate value of 0.9077 Å for both r1 and r2, to be calculated. On the surface plot, an apparent single spot is seen, shown in Figure 2. The forces of AB and BC are near zero meaning that the gradient of the potential energy surface is also zero at this point. The Internuclear Distance vs Time graph for this value of rts is shown in Figure 3. Three non-intersecting straight parallel lines (B-C and A-B overlapping) are seen indicating that the molecules are not oscillating (little/no kinetic energy) and do not come into direct contact with each other. This evidence suggests that a value of 0.9077 Å is a good estimate for rts.
 |
 |
Good that you give two plots to prove that you found a TS.
Trajectories from r1 = rts+δ, r2 = rts
The difference between the minimum path energy (mep) and Dynamics calculation is that MEP equals velocity to zero so effectively takes screenshots of the molecules after each time interval, each side of the transition state. This does not happen when a calculation is carried out using Dynamics calculation type meaning that when the same initial conditions are used, the calculation methods produce very different trajectories.
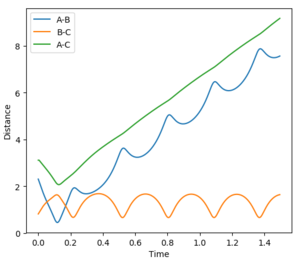
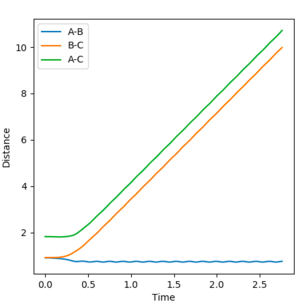
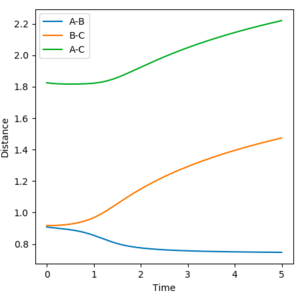
The initial conditions were set at r1 = 0.9177 Å (rts+0.01) and r2 = 0.9077 Å (rts). The Dynamic and MEP distance vs time graphs are shown in Figure 4 and 5 respectively. When using the mep calculation type, there is no oscillation seen in the trajectory however in the Dynamics calculation there is oscillation due to the bond being able to freely accelerate and decelerate. Other differences seen are the shapes of the trajectories and the size of the distances measured. In the mep plot the bond lengths begin at constant values but then the B-C and A-C distances show a gradual increase which begin to plateau after 5 seconds. A-B decreases and plateaus after 3 seconds indicating that this static bond has formed. However in the dynamic plot, the B-C and A-C distances increase exponentially.
 |
 |
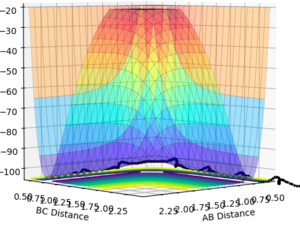
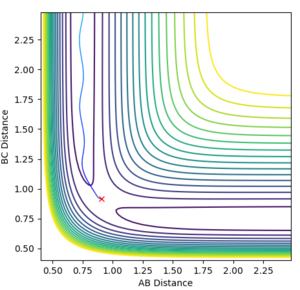
The surface plots for dynamic and mep are shown in Figure 6 and 7 respectively. The MEP plot shows the energy path to start at the transition point and 'roll' towards the products, by only a small distance. Again, there is no oscillation seen due to zero velocity. The dynamic plot also begins at the transition state position and 'rolls' towards the products, however now the reaction continues leading to product formation. Oscillations are also seen as the molecule now has velocity.
 |
 |
Reactive and unreactive trajectories
In order for a reaction to successfully proceed, there needs to be a high kinetic energy to overcome the activation barrier. This activation barrier corresponds to the transition point so if an energy path is seen to pass from the reactants, over the transition state and through to the products, you can assume it is reactive. It can be assumed that all trajectories starting with the same positions but with higher values of momenta would be reactive due to its excess kinetic energy that can overcome this activation barrier. The constant initial distances used were r1= 0.74 Å and r2= 2.0 Å.
Very good that you provide an introduction to what you are doing and state the initial conditions.
Very good that you stated kinetic energies as well and clearly explained what was going on. You could have mentioned the term "re-crossing". An overall concluding comment of what you learned from this table would have been expected.
A number of assumptions are made in deriving the Transition State Theory (TST) rate expression. The main assumptions are as follows:[2]
1) Electronic and nuclear motions and separated, equivalent to the Born-Oppenheimer approximation in quantum mechanics. Nuclei behave according to classical mechanics
2) In order for the reaction to proceed, the reactants must pass over the lowest energy saddle point (transition state). The products cannot turn around and reform the reactants.
3) The system is in Quasi-equilibrium where the reactants and transition state are in equilibrium with each other however the products and transition state are not.
However, these assumptions do not apply to every possible system in reality. Evidence for this is portrayed in some of the reactions shown above in Table 1. The fourth reaction shows the reactants having enough energy to reach the transition state, which when applying the TST assumptions, should then form the products. However, barrier crossing is seen and the reactants are reformed instead. Another scenario includes the quantum mechanical effect of tunneling where reactions can occur despite no collisions between reactants occurring. It is likely that the TST overestimates the rate of reactions as the assumptions do not take into account that reactants can be reformed and that collisions between reactants does not always result in product formation.
EXERCISE 2: F - H - H system
PES inspection
The F + H2 reaction is exothermic as the products are more stable than the reactants, shown in the surface plot in Figure 8. The formation of a H-F bond is more favourable over a H-H bond due to the large electronegativity difference between H and F which in turn makes this bond very strong. Therefore, the reverse reaction between H + HF, where the strong H-F bond is broken, has to be endothermic. It will require a large input of energy to initially break this bond and will not be compensated by the formation of the weaker H-H bond, resulting in an endothermic reaction.
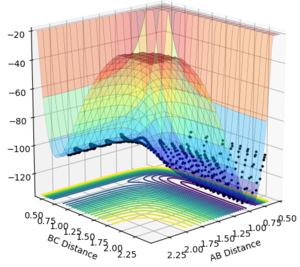
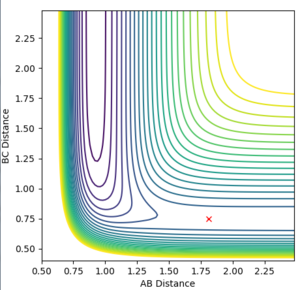
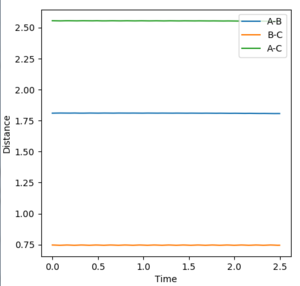
In order to identify an approximate position of transition state, Hammonds postulate was applied which states that the transition state resembles either the reactants or products, depending on which ever it is closest to in energy. Endothermic reactions have a late transition state so the transition state resembles the products.[3] The reaction between F and H2 is an exothermic reaction meaning that there is an early transition state so the transition state will resemble the reactants. This means that the H-H bond distance will be smaller than the HF bond distance. After modification of the H-F and H-H bond lengths, it was found that a good approximation for the position of the transition state is at distances of 0.810 Å for H-F and 0.746 Å for H-H. The transition state in the reverse endothermic reaction, H + HF, will also be at this position as both reactions produce the same activated complex. Figure 9 shows the single point of the contour plot that corresponds to this position. Figure 10 shows three non-intersecting lines that are not oscillating indicating that the approximate values are good approximations for the transition state position.
 |
 |
The activation energy is equal to the transition state maximum energy minus the reactant minima energy. The potential energy of the transition state was calculated to be -103.751 kcal/mol. By using appropriate bond lengths that would best resemble the reactants, the potential energy minima was calculated to be -104.020 kcal/mol. The overall activation energy for the reaction between F and H2 is:
- -103.751 - (-104.020) = 0.269 kcal/mol
For the reverse reaction between H + HF, the potential energy minima for the reactants was calculated to be -134.025 kcal/mol. Therefore, the overall activation energy is:
- -134.025 - (-104.020) = 30.274 kcal/mol
Reaction dynamics
Reactive trajectory
The initial conditions chosen that results in a reactive trajectory for F + H2 are as follows:
- H-F distance: 2.3
- H-H distance: 0.74
- H-F momentum: -2.5
- H-H momentum: -1.5
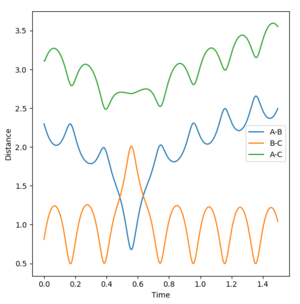
The reaction between F and H2 is exothermic meaning that energy is released to the surroundings. The internuclear distance vs time graph is shown in Figure 11. The product H-F has a greater vibrational energy than the reactant H-H due to the surplus of energy in the system from the favourable formation of the H-F bond. The energy vs time graph is shown in Figure 12. The reaction obeys the First Law of Thermodynamics as all potential energy is converted to kinetic energy. Therefore, overall energy is conserved not destroyed.
 |
 |
In order to confirm this experimentally, a calorimetry experiment could be carried out. The increase in kinetic energy will results in an increase in the surrounding temperature which can be monitored with a thermometer. This will indicate that an exothermic reaction has taken place.
Polanyi's empirical rules
The Polanyi rules state that vibrational energy is more effective in promoting a late-barrier reaction than translational energy and vice versa for an early-barrier reaction.[4] The translational energy corresponds to AB momenta and vibrational energy corresponds to the BC for both reactions.
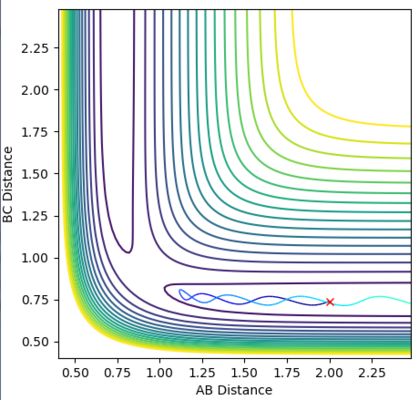
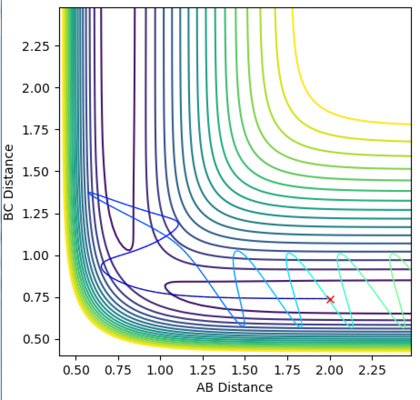
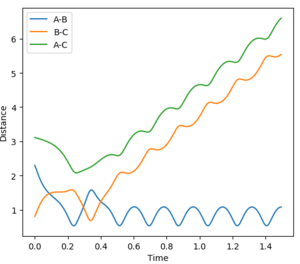
The reaction between F + H2 is exothermic so will be an early-barrier reaction, as discussed previously. Therefore a higher translational energy over vibrational energy should be favoured, assuming Polanyi's rules. The initial conditions used were rHF=2.3 Å and rHH=0.81 Å. Figure 13 shows a contour plot where a high translational energy (pHF= -5.75) and a low vibrational energy (PHH=1.25) has been applied. The reaction path shows little oscillation indicating little vibrational energy. This is further supported with the internuclear distance vs time graph showed in Figure 15. A-C shows to have only translational energy and B-C shows to have only little vibrational energy. A-B plateaus at a constant distance meaning that the slightly vibrating product has been formed. From this, it is clear that these conditions are favourable as it is reactive and products are formed.
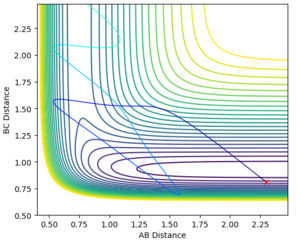
On the other hand, Figure 14 shows a contour plot where there is a high vibrational energy (PHH = 5.5 ) and a low translational energy (PHF= -1.5). An increase in oscillation is seen indicating a higher vibrational energy and less translational energy. The reaction path does not pass over the transition state into the products channel meaning that this trajectory is unreactive. This is further supported by the distance vs time graph shown in Figure 16. A-B and B-C continue together meaning that the product is not formed. Greater vibrational energy is seen between all bonds, with minimal translational energy.
Therefore, these two different cases appear to support Polanyi's rules.
 |
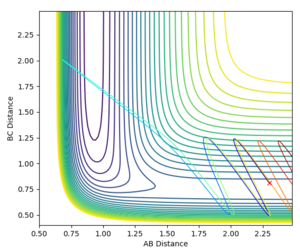 |
The reaction between H + HF is endothermic so will have a late transition state meaning that a higher vibrational energy over translational energy should be favoured. Figure 17 shows a contour plot where a higher vibrational energy (pHF=8.6) and lower translational energy (pHH=-2.0) is applied. High amplitude oscillations are seen indicating a high vibrational energy and smaller translational energy. The trajectory is reactive as products are formed. This is further supported by the distance vs time graph in Figure 19 where A-B plateaus indicating the product has formed. Both A-B and B-C have vibrational energy after the reaction has occurred with only a small amount of translational energy.
On the other hand, Figure 18 shows a contour plot with a higher translational energy (pHH=-8.6) over vibrational energy (pHF=2.0). Little oscillation is seen meaning there is little vibrational energy and much higher translational energy. The trajectory is unreactive as products are not formed. This is supported by the distance vs time graph shown in Figure 20 where B-C shows little change in distance meaning no product has formed. A-C has purely translational energy and A-B has majority translational with a small amount of vibrational after the reaction has occurred.
Therefore, these two cases also provide further evidence for Polanyi's rules.
 |
 |
Bibliography
- ↑ J. Stewart, Multivariable Calculus: Concepts & Contexts, Brooks/Cole, 2005
- ↑ J. I. Steinfeld, J. S. Francisco, W. L. Hase, Chemical Kinetics and Dynamics,2nd edition, 1989, Chp. 10 p. 311
- ↑ Clayden,J. Greeves, N & Warren, S. Organic Chemistry, 2nd edition, 2012
- ↑ Z.Zhang, Y.Zhou, D.H. Zhang, G. Czakó and J. M. Bowman, J. Phys. Chem. Lett. 2012 3 (23), 3416-3419


