MRD:Kemicompwiki
Exercise 1
What value do the different components of the gradient of the potential energy surface have at a minimum and at a transition structure? Briefly explain how minima and transition structures can be distinguished using the curvature of the potential energy surface.
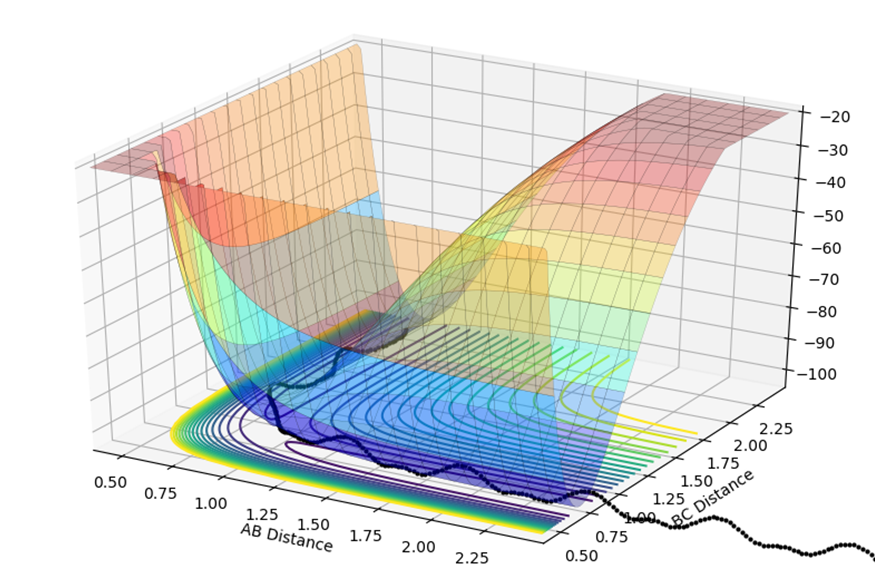
The potential energy surface plot shown below is composed of both the AB distance and the BC distance, and the relative energy of each state. At the start of the reaction, on the left of the graph the AB distance is short, and the black dotted line shows small fluctuations in energy are due to the vibrations.
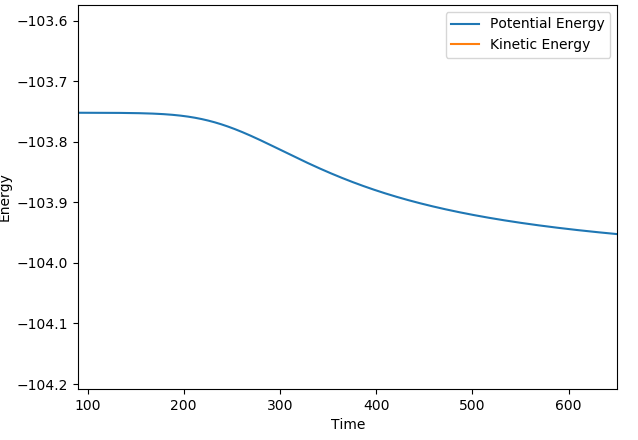
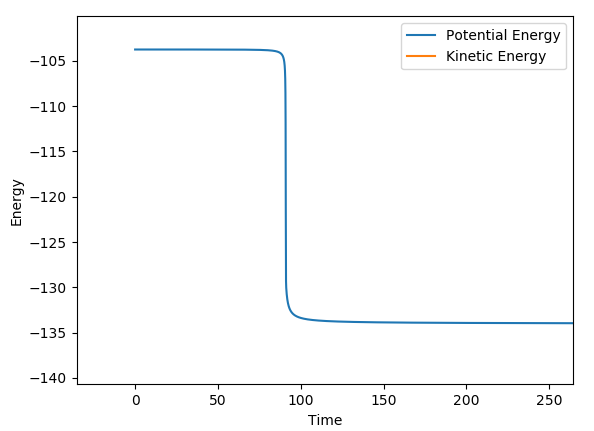
The transition state is shown by where the potential energy reaches a maxima and the kinetic energy reaches a minima. This is known as the saddle point, at approximately 0.75,0.75. To find the transition state, you need to differentiate both the potential energy and the kinetic energy and find out where both values are stationary. You then need to partially differentiate both to see where they cross, and this is known to be the saddle point.
Jas213 (talk) 22:09, 28 May 2018 (BST) Don't just give a visual answer of where it is, but what mathematical equations are valid for the TS on a 3D surface?
A-C=B-C Trajectories
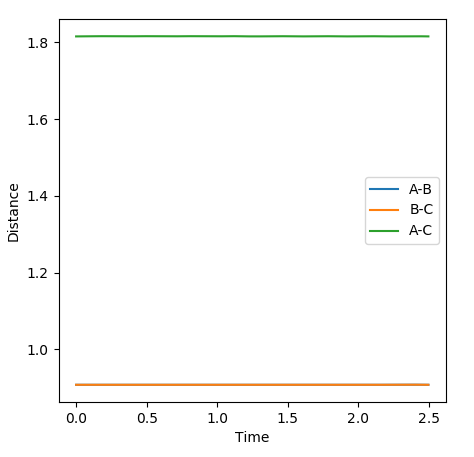
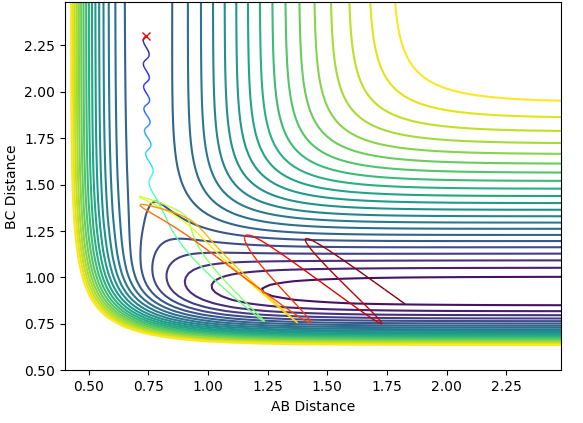
Below is the closest estimate I could find for locating the transition state. The AB distance is equal to the BC at 0.9076Ǎ. In the internuclear distance vs Time graph below, both lines are close to flat and any oscillations have been minimised. By setting the momentum to zero, the parameters were optimised as in the transition state there is no oscillation so this is the best way to model it theoretically, both the kinetic and potential energy are at a stationary point and the atoms do not oscillate.
Calculating the reaction path
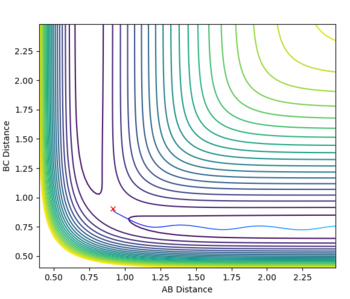
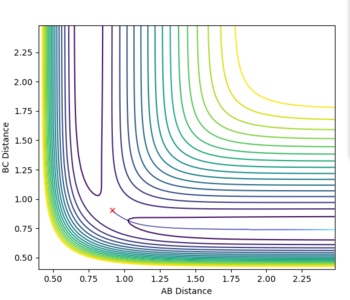
| r2=rts and r1=rts+δ, dynamics vs mep | ||
 |
 |

|
|

|

|
There are some clear differences between the MEP and dynamics plots. On the contour plots with the dynamics graph the energy shows oscillation in the energy well while in MEP the line is a smooth curve. Similar trends are observed when looking at the internuclear distance and the internulcear momentum plots. In the MEP by resetting the velocity to zero, you lose all information about the vibrational energy. In the dynamic plots no information is lost and as a result the oscillations are only seen in the dynamic plots. The MEP just shows the lowest energy path taken in the reaction.
If you were to change the r1=rts and the r2=rts + δ then the graphs would simply be a reflection of what is shown above. All plots would go in the opposite direction to the one that they are going in currently.
Reactive and Unreactive Trajectories
Jas213 (talk) 22:21, 28 May 2018 (BST) Stating the initial conditions and method before the table and an overall concluding comment after your table would have been expected.
| P1 | P2 | reactive or unreactive? | Contour plot | Total Energy(kcalories) | Comments |
| -1.25 | -2.5 | Reactive | 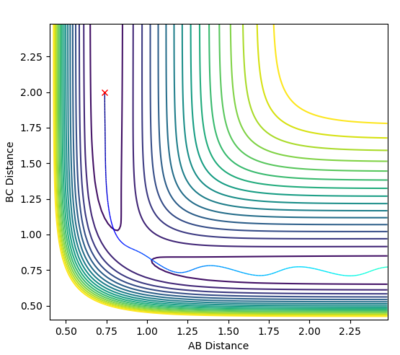 |
-99.018 | With this specified momentum the reaction proceeds smoothly. |
| -1.5 | -2.0 | Unreactive | 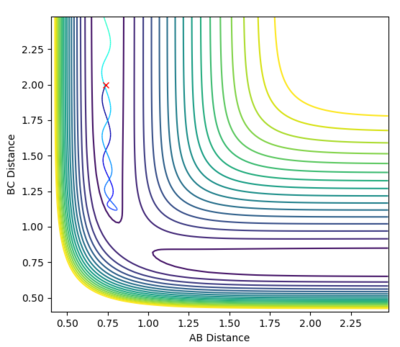 |
-100.455 | With these specified parameters the reaction does not occur. The reaction approaches the transition state then drops down as when the particles collide they do not have enough energy to react. |
| -1.5 | -2.5 | Reactive | 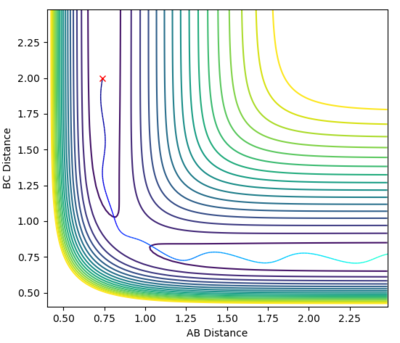 |
-98.995 | The reaction occurs less smoothly that in the first reaction as the particles oscillate however they are still able to pass through the transition state and form the products. |
| -2.5 | -5.0 | Uneactive | 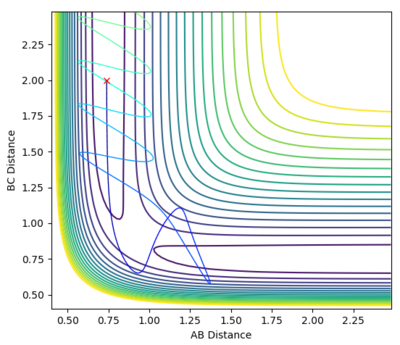 |
-84.954 | The particles collide and are close to the activation energy however do not have enough to surpass is, meaning they go back to the reactants. Jas213 (talk) 22:23, 28 May 2018 (BST) This is an example of recrossing. The TS is crossed more than once. |
| -2.5 | -5.2 | Reactive | 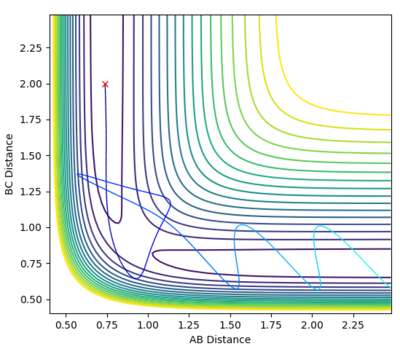 |
-83.414 | With the momenta stated the particles are now able to surpass the activation energy and form the products, as shown by the plot. The molecules collide once without enough energy to surpass the transition state however the cross again, in a process called recrossing and form the products. |
State what are the main assumptions of Transition State Theory. Given the results you have obtained, how will Transition State Theory predictions for reaction rate values compare with experimental values?
The transition state theory suggests[1] that in order to reach the the products the reactants must first overcome an energy barrier that aligns with the saddle point. The products must align in a specific configuration in order to be converted into the products. From the data above it is clear that this is not the case, as the reactants were able to overcome the energy barrier using more than one graph, as shown by the first third and fifth contour plots that were all able to react with the correct momentum, even if they had different geometries when passing through the transition state.
Transition state theory[2] is based solely upon a classical approach, therefore cannot account for effects like tunneling and recrossing. It can be used to obtain a good estimate for whether or not a reaction has enough energy to react however once the activation energy is reached it becomes less accurate as you drift further from the classical picture.
Jas213 (talk) 22:09, 28 May 2018 (BST) Correct, but what are the other assumptions of TST?
Exercise 2
When colliding a flourine atome with a H2 molecule the reaction is exothermic. As shown in the surface plot below the transition state is passed through easily and the product channel has a lower energy than the reactant channel, which is evidence that it is an exothermic reaction. If the reaction were done in reverse it should be endothermic as the reactants would be at a lower energy than the products, making it an energy consuming process. From this it can also be deduced that the H-F bond is much stronger than the H-H bond as more energy is required to break it. The bond dissociation energy is in fact 432 kj/mol for a H2 atom and 562 kj/mol in a HF molecule.[3]
When HF and another hydrogen atom collide with each other the only possible reaction is a proton transfer, technically no chemical reaction takes place as the reactants are equivalent to the products. If the momentum is high enough this can take place, as shown in the surface plot below. both the reactants and products are the same energy, as they are effectively the same.

Locating the transition state
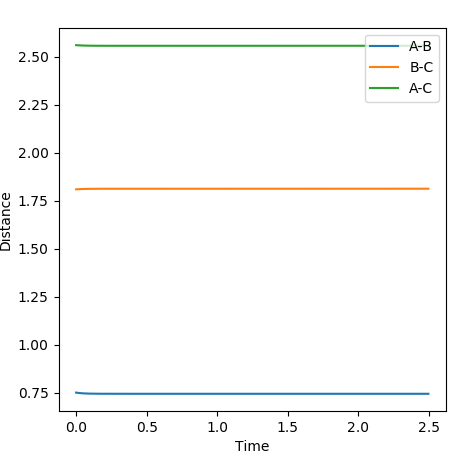
In the transition state it was determined that the H-H distance was 0.747Å the H-F distance was 1.810Å. The H-H distance is very close to that of the H-H bond, and the H-F distance is similar to that of the original one. This shows that the transition state energy lies closer to the reactants than the products.
Jas213 (talk) 22:12, 28 May 2018 (BST) Which postulate are you referring to here? What was your method for finding the TS?
Reporting the activation energy for the reaction
To calculate the activation energy an MEP plot was taken around the transition state calculated previously, and the change in energy has been assumed to be the activation energy.
The activation energy for the reaction of H2 reacting with a fluorine atom was measured to be approximately 0.2 kcal/mol.
The activation energy for the reaction of HF with H was calculated to be approximately 30kcal/mol.
The activation energy for the reaction between the fluorine and hydrogen is much lower than that between hydrogen fluoride and the hydrogen atom, which seems logical as the H-F bond is stronger than that of the H-H bond so more energy is required.
Jas213 (talk) 22:13, 28 May 2018 (BST) MEPs could have been stated alongside.
In Light of the Fact that energy is conserved, discuss the mechanism of the release of the reaction energy. How could this be confirmed experimentally?
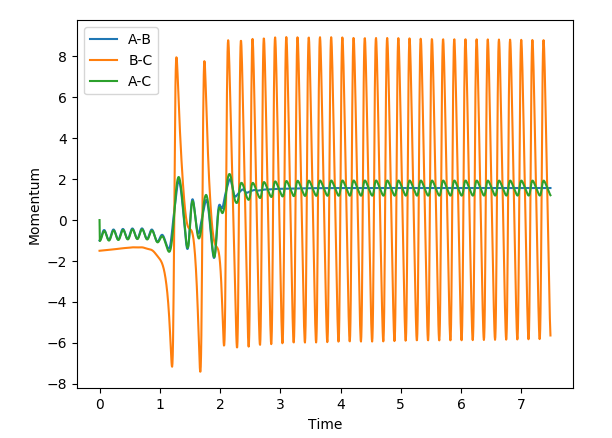
The set of initial conditions that resulted in a reactive trajectory were: A=H, B=H, C=F, AB distance = 0.74, BC distance = 2.3, AB momentum = -1.0, BC momentum = -1.5, shown in the contour plot and internuclear momenta vs time plot below.
In the Internuclear momenta vs time graph, after 1 nanosecond there is a significant increase in momenta which is representative of the release of kinetic energy. This is an example of the first law on thermodynamics, where energy cannot be gained or lost only transferred. This energy has been released by breaking the H-H bond. The high oscillations could be a result of the H-F bond formation being very high energy. To investigate this experimentally you could measure the temperature change observed as the reaction proceeds.
Discuss how the distribution of energy between different modes (translation and vibration) affect the efficiency of the reaction, and how this is influenced by the position of the transition state.
A calculation was set up to analyse the reaction of an F atom with a H2 molecule, with the H2 distance set to be 0.74 and a momentum between FH to be -0.5. The momentum between the H2 molecules was varied between -3.0 to 3.0 at 0.5 intervals, for which the contour plots are shown below.
| P:FH ! | P:HH! | Contour plot |
| -0.5 | -3.0 | 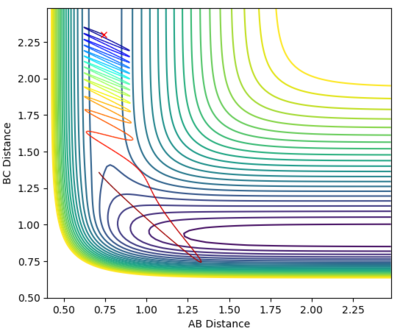
|
| -0.5 | -2.0 | 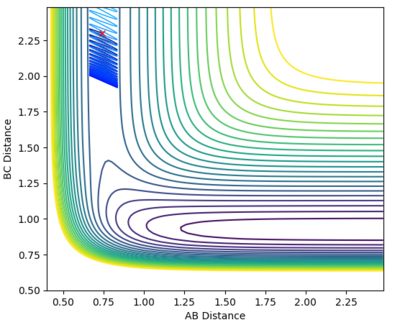
|
| -0.5 | -1.0 | 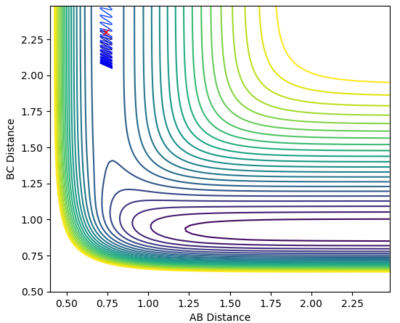
|
| -0.5 | 0.0 | 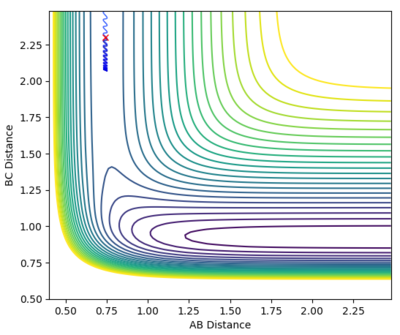
|
| -0.5 | 1.0 | 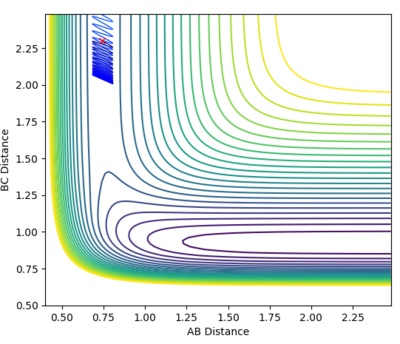
|
| -0.5 | 2.0 | 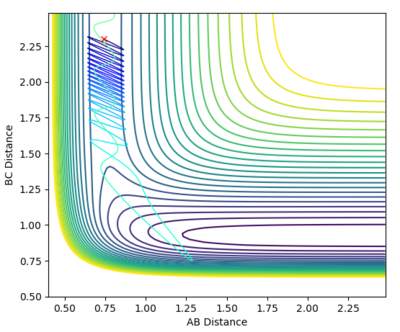
|
| -0.5 | 3.0 | 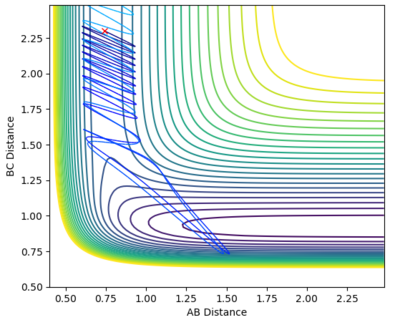
|
| -0.8 | 0.1 | 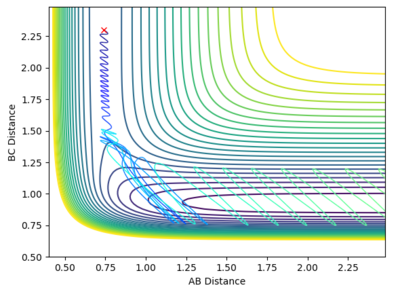
|
From the graphs it can be seen that by increasing the H-H momentum the reaction does eventually start to become more feasible. Jas213 (talk) 22:18, 28 May 2018 (BST) How are they more feasible if they are all unreactive, except for the last one with low p(HH) In the final plot however, with a very low H-H momentum but a only slightly increased F-H momentum the reaction progresses easily. By increasing the translational energy when increasing the F-H momentum it is much easier to reach the transition state, suggesting that for the reaction to take place the translational energy plays a greater role in the reaction taking place than the vibrational energy within the hydrogen molecule.
Jas213 (talk) 22:18, 28 May 2018 (BST) conclusion correct, whose rules does this agree with??
Looking at momenta in HF + H
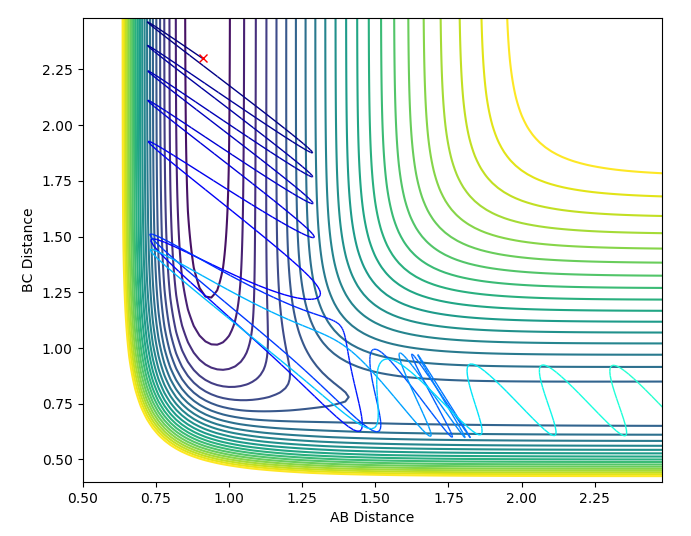
When Looking at the reverse reaction of HF with H there is a much higher dependence on the vibrational energy. The reactants are able to surpass the transition state when the H-F momentum is set to -9.5 and the H-H momentum is set to -0.5, with a H-F distance set to 0.91Å with the H-H distance set to 2.3Å. The transition state being reached in this case was dependent upon the vibrational energy in the H-F bond moreso than the translational energy.
This agrees with Polyani's rules[4] as they state that achieving an early transition state is more dependent upon obtaining the correct translational energy while reaching later transition state it is more important that you have exceeded the vibrational energy barrier, as shown by the plots above.
Jas213 (talk) 22:19, 28 May 2018 (BST) Overall correct observations, why did you not provide more examples for this reaction? An overall conclusion would have been nice.
References
- ↑ Atkins de Paula, 9th edition
- ↑ Atkins de Paula, 9th edition
- ↑ https://chem.libretexts.org/Core/Physical_and_Theoretical_Chemistry/Chemical_Bonding/Fundamentals_of_Chemical_Bonding/Bond_Energies, accessed 25/05/2018
- ↑ https://pubs.acs.org/doi/abs/10.1021/jz301649w, accessed 25/05/2018

