MRD:KZ1015PC
Molecular Reaction Dynamics: Applications to Triatomic systems
Introduction
In this experiment, the triatomic system was introduced to determine the motion of reactants. When a single atom A collides with a diatomic molecule BC, a new single atom C and diatomic molecule AB would be generated. The reaction trajectory was plotted by the MATLAB. Different initial conditions (distances and momenta) would give out different shapes of trajectories. The activation barriers and the position of transition states could be identified through these trajectories.
In addition, if a reaction wants to proceed, the molecules should have enough energy to overcome the activation barrier, otherwise, the reaction would be unreactive. Also, the early-barrier reaction and late-barrier reaction could be promoted by translational energy and vibrational energy respectively.
Part 1: H atom + H2 molecule system
In this reactoin, HA collides with HB-HC and then form a new diatomic molecule HA-HB and a detached atom HC.
Dynamics of transition state
For this reaction, its potential energy vs time diagram suggested that the gradients of maximum and minimum points on the minimum energy path were both zero.
Therefore, the total gradients would be zero as well.
However, we could distinguish these two points through the second derivatives. Since the minima was always at the lowest point on potential energy surface, the
value of its second derivative would be positive while the maximum represented the transition state and have a negative second derivative.
The position of the transition state
Since HA, HB and HC were three identical hydrogen atoms, they would have the same reaction path. As a result, when rAB=rBC, we could find the transition state
on the minimum energy path. In addition, we kept momentums equal to zero to maintain the transition state.
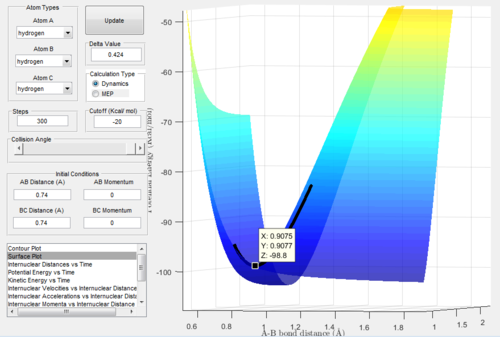
Figure.1 showed an approximate position of the transition state.
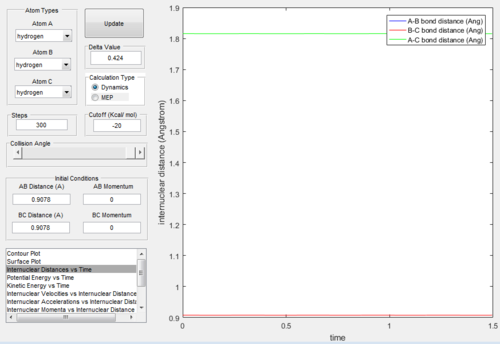
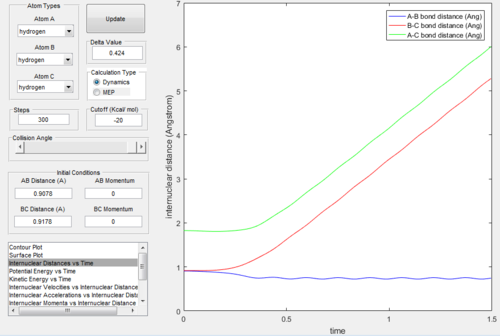
From Figure. 2 (distance vs time plot) we knew that the best estimate position of the transition state was 0.9078Å because the two straight lines on the graph suggested
that the internuclear distances was not oscillating and almost in constant.
MEP mode VS Dynamics mode
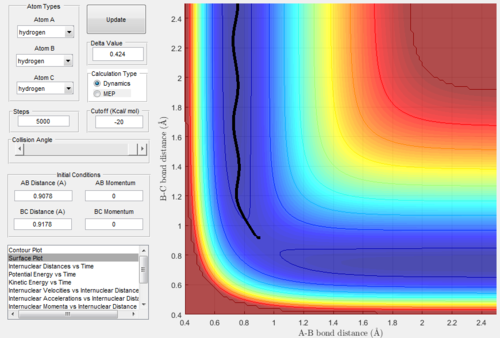
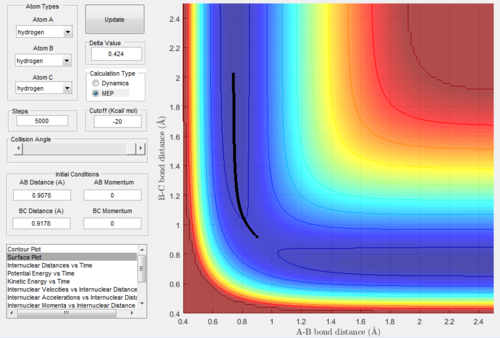
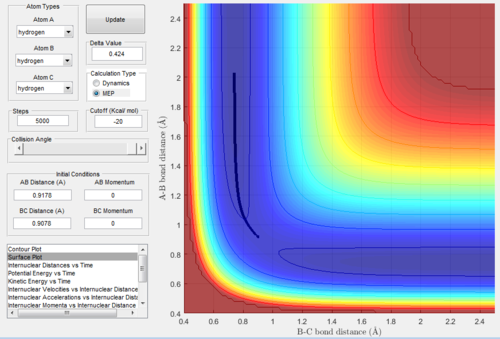
As we set the initial conditions of the positions at rBC=rts+0.01=0.9178Å, rAB=rts=0.9078Å and pAB=pBC=0, the reaction trajectories of MEP mode (Figure. 3) and dynamics
mode (Figure. 4) are different.
The surface plot under the dynamic mode gave a fluctuating wave because the molecule vibration was accounted, while under the MEP mode, realistic motion of molecules
was not included and then gave a smooth line.
The “Internuclear Distances vs Time” and “Internuclear Momenta vs Time” graphs of dynamic mode and MEP mode were showed below:
 |
 |
 |
 |
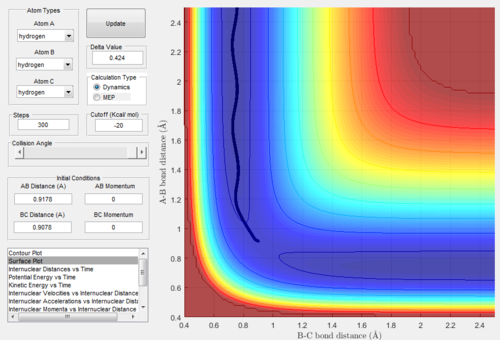
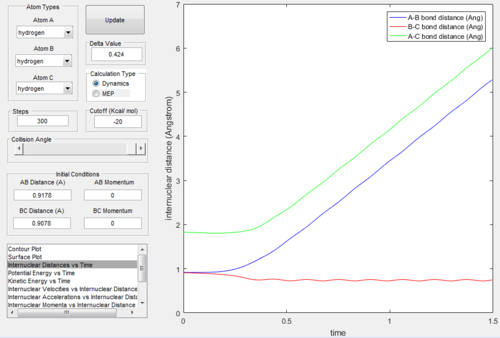
When we exchanged values of rBC and rAB, the conditions became: rAB=rts+0.01=0.9178Å, rBC=rts=0.9078Å and pAB=pBC=0. All the relative graphs (surface plot,
Internuclear Distances vs Time and Internuclear Momenta vs Time) were showed below:
 |
 |
 |
 |
 |
 |
After comparing figure 9-13 with figure 3-8, we found that the shapes of the graphs did not change but the axis AB and BC inverse. In graph.9, the trajectories went to
the reactant, which means the bond A-B was going to form.
Reactive and unreactive trajectories
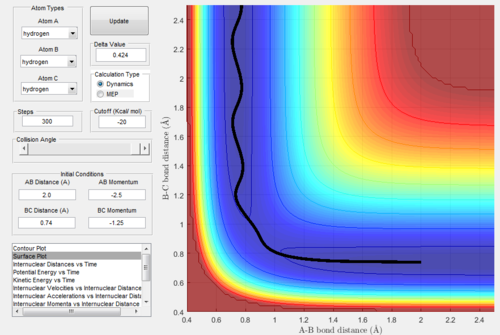
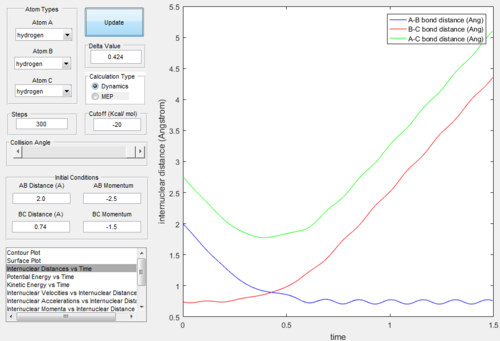
According to the previous calculation, the trajectories would be active when rAB = 2.0 Å, rBC = 0.74 Å, -1.5 < pBC < -0.8 and pAB = -2.5.
Usually, larger momentum means more sufficient energy to overcome the activation barrier, however, if the K.E. was much larger than the activation energy, the activation
barrier might be recross and lead the reaction to unreactive.
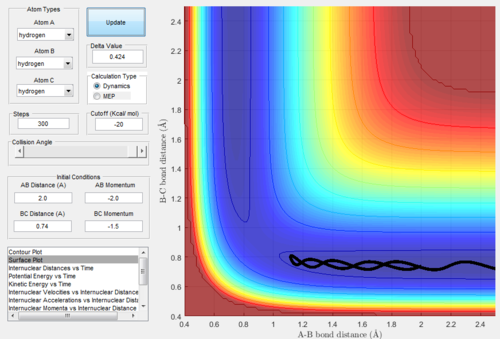
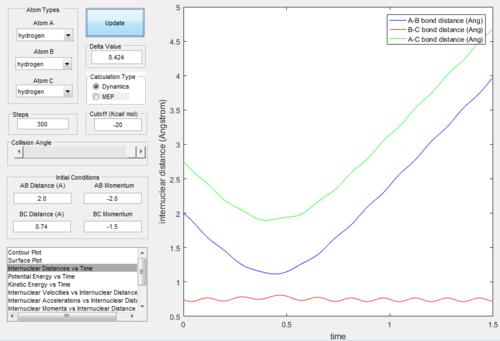
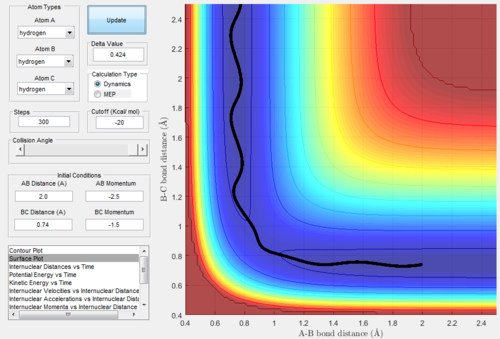
There were 5 combinations of momenta when rAB = 2.0 Å and rBC = 0.74 Å. All the trajectories (Figure.14 - Figure.23) were given below.
| p1 | p2 | Reactivity | Comments |
|---|---|---|---|
| -1.25 | -2.5 | Reactive | Large momentum and energy to cross the T.S. and form product. |
| -1.5 | -2.0 | Unreactive | No enough energy to overcome the activation barrier. |
| -1.5 | -2.5 | Reactive | Enough energy to overcome the activation barrier. |
| -2.5 | -5.0 | Unreactive | Recross happened and reform the reactants. |
| -2.5 | -5.2 | Reactive | Recross happened but energy was enough for the second cross to form product. |
 |
 |
 |
 |
 |
 |
 |
 |
 |
 |
Transition State Theory
Transition state theory assumed that a reaction would only pass through the transition state once. Recrossing the transition state would not happen and the reactants
would not be regenerate either. However, the previous data and graphs suggested that the molecules, which had reactive trajectories, had some probabilities to recross
the transition state and went back to form the reactants. Also, in some situations, although there was a recrossing of transition state, the products could still be formed.
As a result, the transition state theory predictions for reaction rate values are always larger than the experimental ones.
Part 2: F - H - H system
In F-H-H system, the atoms could react in two ways:
(1) H2 reacted with F atom to form a diatomic molecule HF and H atom.
(2) H-F reacted with H atom to form H2 and F atom.
Reaction 1: H2 + F
Since there was a large electronegativity difference between H atom and F atom, the H-F bond was stronger than the H-H bond. Therefore, less energy was absorbed
to break the H-H bond while more energy was released when the H-F bond formed. This situation suggested that reaction was an exothermic reaction.
According to the Hammond postulate, if the reaction was exothermic, it would have a early transition state, which was near to the starting materials rather than the
products and had a small activation energy. As a result, the position of the T.S. should locate at a position, where when the p=0 and the internuclear distance remained
constant.
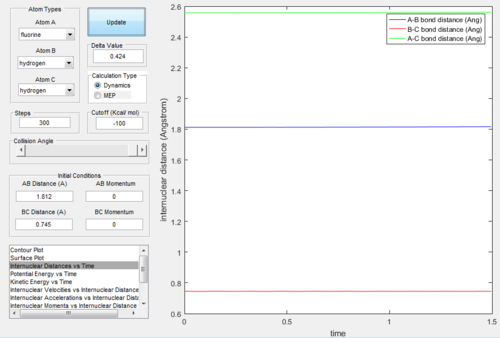
Figure.24 and Figure.25 showed that the position of T.S. was located at rAB = 1.812 Å, rBC = 0.745 Å and pAB= pBC= 0.0.
 |
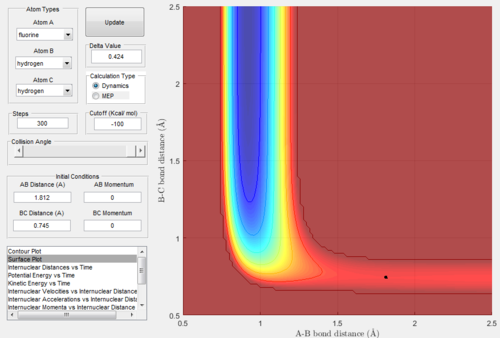 |
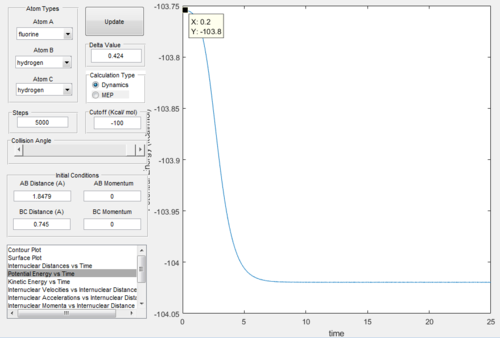
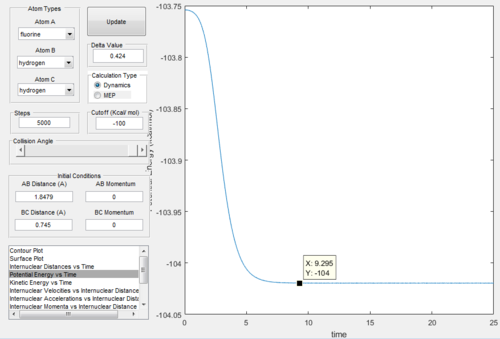
Comparing Figure.26 and Figure.27 we got that the activation energy = 104 - 103.8 = 0.2 kcal/mol.
 |
 |
Reaction 2: HF + H
In this reaction, H atom collided with H-F and formed H2 molecule and F atom. Since the bond energy of H-F was greater than H-H, more energy was absorbed to break
the H-F and less energy was released. Therefore, this reaction was endothermic, the T.S. located near to the product and the value of activation energy was relatively large.
Figure.28 showed that the position of T.S. was located at rAB = 0.745 Å, rBC = 1.812 Å and pAB= pBC= 0.
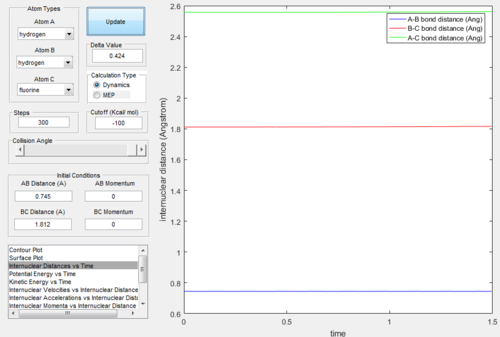
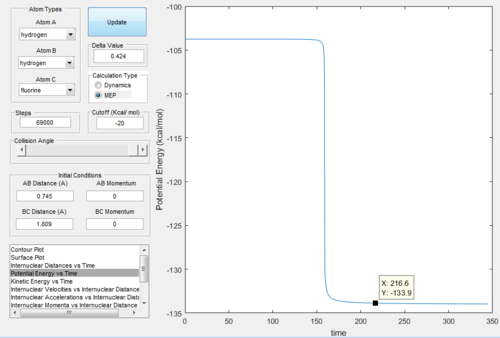
Comparing Figure.29 and Figure.30 we got that the activation energy = 133.9 - 103.8 = 30.1 kcal/mol.
 |
 |
Reaction Dynamics
Reaction of H2 + F
Set the conditions as following: rHF>= 2.28 Å, pHF= -2.7 rHH= 0.7583 Å, pHH= 0.0
 |
 |
Figure.31 and 32 presented that there were two steps involved in this reaction:
Firstly, F atom approanced to the H2 and decreased the distance between atom B and C. Secondly, H-H dissociated, and H-F bond formed due to the reapproaching
of F atom to H2. The vibration of H-F was greater than the H-H.
 |
 |
Figure.33 and 34 suggested that the kinetic energy and potential energy were converted during this reaction. Also, at the beginning, both of the kinetic and potential
energies were small because the low energy part was H-H bond. When the H-H bond broke, H-F bond formed, potential energy and kinetic energy increased a lot.
(The total energy of the system must remain constant. Here you're saying that both kinetic and potential energy are increasing. Tam10 (talk) 10:13, 13 June 2017 (BST))
Reaction of HF + H
The initial conditions were set as rHH=2.2 Å, rHF=0.908 Å pHH=-2.2 and pHF=-2.0. Therefore, the reactants would have low vibrational kinetic energy:
Figure.35 showed that the trajectory of this reaction was unreactive.

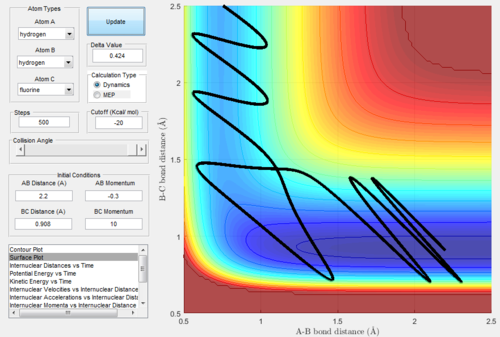
When we decreasing the momentum of incoming H atom, the trajectory became reactive when rHH=2.2 Å, rHF=0.908 Å, pHH=-0.3, pHF=10. The trajectory showed below:
 |
 |
Reaction efficiency and Polanyi's Empirical Rule
The reaction efficiency was related to the Polanyi's Empirical Rule. This rule suggested that in a triatomic system, the position of the transition state would determine how efficiency the vibrational and translational energy could be to promote the reaction.
Since H2 + HF reaction was exothermic, its transition state energy was closer to the starting materials. As a result, it was an early-barrier reaction. In this situation, the Polanyi's Empirical Rule suggested that the translational energy would promote reaction more than vibrational energy.
(Be careful with the typo "H2 + HF" Tam10 (talk) 10:13, 13 June 2017 (BST))
On the other hand, an endothermic reaction was also a late-barrier reaction and the vibrational energy was more efficient.
