MRD:KM816
Molecular Reaction Dynamics
Overview of Reaction Dynamics with a atom-diatomic system
The collision of two particles can cause a chemical reaction. The conditions for this reaction to take place is that the energy of the molecules must be greater than the activation energy, this allows the reaction to proceed past the transition state. The transition state is the highest energy between reactants and products when the reaction follows the minimum energy pathway. The potential energy of the molecules in the system, consisting of all the interactions between the molecules, can be plotted on a 3D graph. On the potential energy path a trajectory of the molecules can be plotted. This can help calculates whether the molecules will react as the distance between the molecules show how the bonding between the atoms. The further away the atoms are the less interaction so less bonding whereas closer atoms have a greater interaction so can bond.
H2 + H

Distinguishing a Transition State by Potential Energy Curvature
A transition state will be at a saddle point on the potential energy surface, this is the point at which there is a stationary point but not at an extreme point such as a minimum or maximum. Saddle points are calculates by taking the second derivative of the graph. The point at which the second derivative equals zero is the saddle point. At a minimum the second derivative will be greater than zero, this is due to the positive increase in gradient on either side of the minimum.
Ng611 (talk) 13:15, 8 May 2018 (BST) This explanation is not completely correct. When you have a second derivative equal to 0, that means that you could have either a maximum, a minimum, or an inflection point. The signature for a saddle point is that it will give you a positive second derivative in one direction, and a negative second derivative in another direction. In this sense, saddle points are both minima and maxima at the same time.
Estimating the Transition State of H2 + H
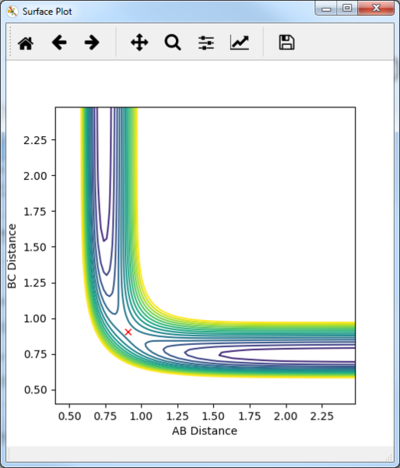
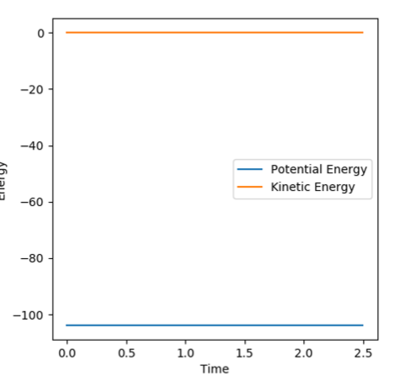
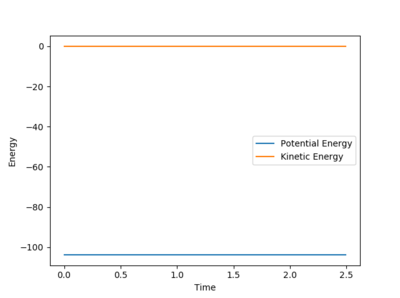
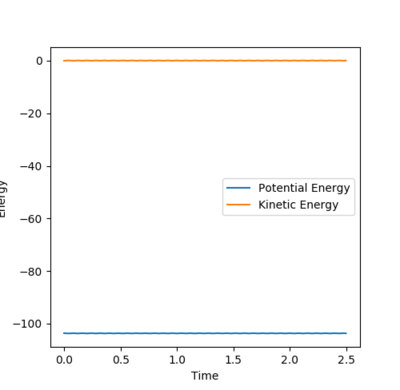
The Trajectory of the reaction at the transition state will be stationary. This is because at the transition state the molecule has the potential to go from either products or reactants but does not have enough energy to go one way or the other. Consequently the molecule will remain at the transition state without moving. From the contour plot (see figure 1) the transition is around 0.9A for both HC-HB distance and HB-HA. A process of trial and error was then done to determine the transition state distance with no potential energy, this was 0.9075A for both distances. This distance was shown to be at the transition state as there was no change in the energy vs time which would indicate the molecules were not at the exact transition state, see figure 2.
Comparison of Reaction Dynamics to the Minimum Energy Path
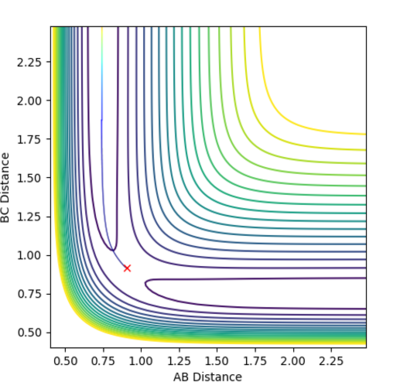
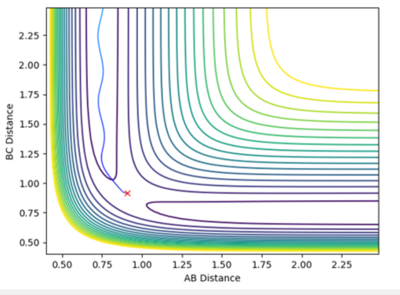
The minimum energy path (MEP) was compared to the reaction dynamics at a slight displacement of r1 from the transition state while r2 was at the transition state distance. The MEP, calculated using 25000 steps, followed the bottom of the well for HC-HB +HA. The trajectory shown by MEP does not oscillate whereas the trajectory seen in the reaction dynamics does. This shows how the dynamic gives a more realistic idea of the reaction as the molecules will be oscillating constantly.
The MEP compared to the dynamics in both the internuclear distance and internuclear momentum took much longer to show a completed reaction. For internuclear momentum it took around 60 seconds for the momentum to plateau for MEP whereas it only took ca. 0.75 secs for the dynamic momentum to plateau. In the plot of internuclear momentum vs time the momentum of distances changed for MEP compared to dynamics. In dynamics HC-HB had the highest momentum followed by HC-HA whereas in the MEP HC-HA had the highest momentum with HC-HB having the second highest. This shows how the MEP does not provide a realistic guide to how a reaction proceeds. Ng611 (talk) 13:18, 8 May 2018 (BST) True, but it is useful for certain tasks like finding equlibrium geometries etc.
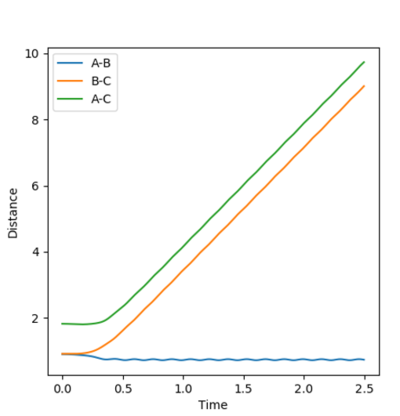

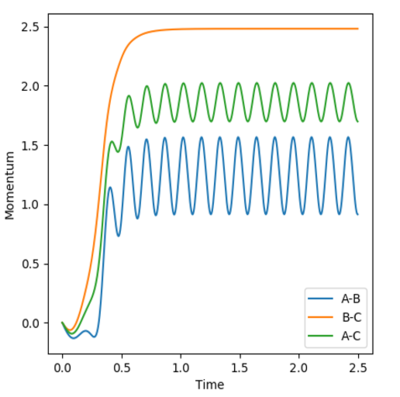

The final momenta and final positions were used to see what would happen when initial and final values were switches, see figure 9. The reverse of the previous reactions occur. In that the products HAHB + HC go towards the transition state but do not react as they do not go over the transition state.
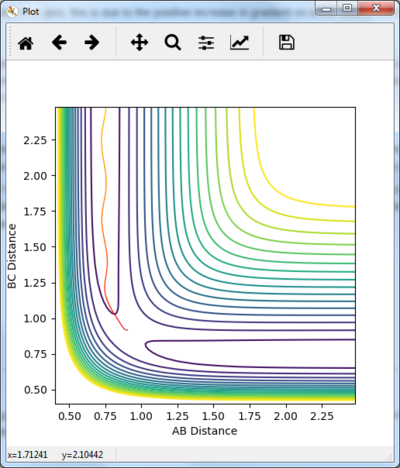
The r1 and r2 distances were switched round. This lead to no difference in the values produced just the distances were swapped round as seen in figure 10.

Comparison of different trajectories reactivity
A variety of different momentum values for r1 and r2 were tested keeping r1 at 0.74A and r2 at 2.0A. The total energy of the reaction and whether the reaction trajectory was reactive or not was recorded.
| p1 | p2 | Total Energy | Trajectory |
|---|---|---|---|
| -1.25 | -2.5 | -99.018 | reactive |
| -1.5 | -2.0 | -100.456 | unreactive |
| -1.5 | -2.5 | -98.956 | reactive |
| -2.5 | -5.0 | -83.956 | unreactive |
| -2.5 | -5.2 | -83.416 | reactive |

It can be seen that the trajectory of this reaction passes over the reaction state and into the products.
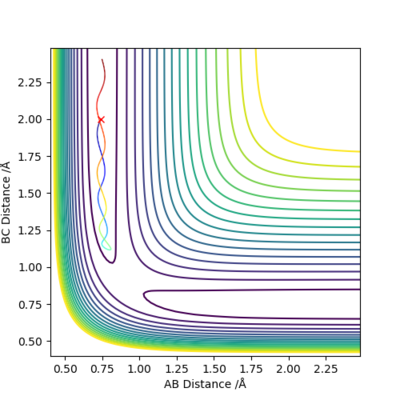
It can be seen that this reaction trajectory doesn't go to completion as the trajectory does not pass over the transition state instead going back towards the reactants.
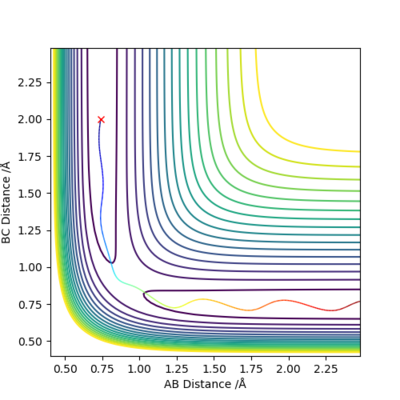
This trajectory is seen to be reactive as the trajectory passes over the transition state so the reaction goes to completion.
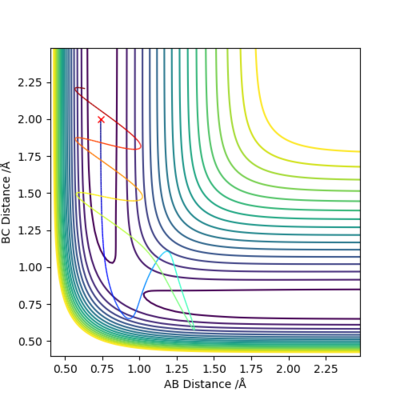
This trajectory is unreactive as although the trajectory goes over the transition state it loops back around to go back to the reactants.
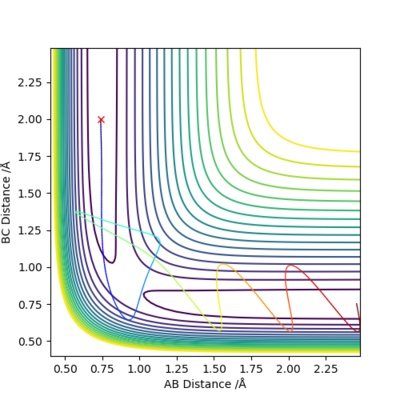
This trajectory is seen to be reactive as ever though the trajectory passes through the transition state 3 times the end trajectory is over the activation barrier therefore forming the products.
Transition State Theory
The main assumptions of transition state theory is that the reaction rate can be studied by calculating the saddle point of a potential graph. This is because all molecules must have enough energy to overcome this so it determines the rate of reaction. However, this is not always an accurate assumption to make as not all reactions go directly through the transition state. This can be seen in the figures above, many reactions may take a course over a higher activation barrier, not at the transition state energy, therefore, they will have a lower reaction rate than predicted. Transition state theory also assumes that the activated complex at the transition state will be converted into products via kinetics. However, this ignores quantum mechanical contributions to reaction rates such as tunneling.
F-H-H System
Reaction of the system
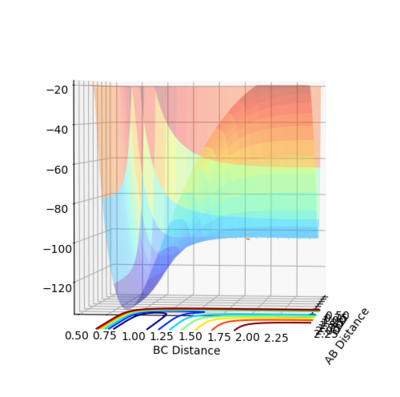
The reaction of H-F + H is an endothermic reaction which is seen by the increase in energy with the decreasing H-H (BC) distance. This is due to the very strong H-F bond which requires a large amount of energy to break. The reaction of H2 +F is exothermic seen by the large drop in energy to produce HF + H. This is due to the formation of the strong H-F bond.

Transition State
The transition state was found to be H-F=1.8112A and H-H=0.7452A, see figure 18 and 19 for H2 + F and HF+F TS respectively. This was calculated by trial and error with the starting point at 1.8A and 0.7A seen by the contour plot as a reasonable guess for the saddle point of the reaction. The large H-F distance is due to the Hammond postulate, in which the transition state resembles the molecules closest to it in energy. The reaction of HF + H is endothermic so the transition point will be closer in energy to the products of H2 + F. Therefore, the transition state will resemble the products more so the H-H distance will be smaller than the H-F distance.


Activation Energy
The activation energy was calculated by subtracting the potential energy of the reactants where r2 was large from the transition state potential energy. This was found to be 17.134kcal/mol for HF+F and 0.23kcal/mol for H2+F. This shows some inaccuracy in the modelling as literature values for H2+F is between 0.7-3.4 kcal/mol (http://science.sciencemag.org/content/311/5766/1440.full), this can be related to the inaccuracies of transition state theory.
Ng611 (talk) 13:22, 8 May 2018 (BST) TS theory doesn't actually result in the discrepancy here. Rather it's the quantum chemical method used to compute the transition state energy.
Reaction Dynamics
H2+F
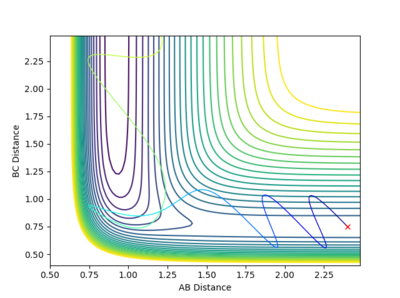
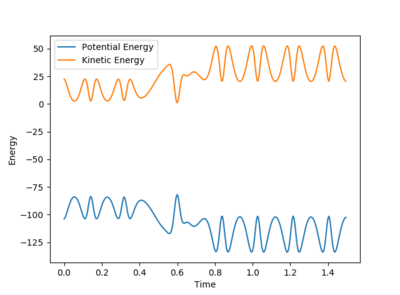
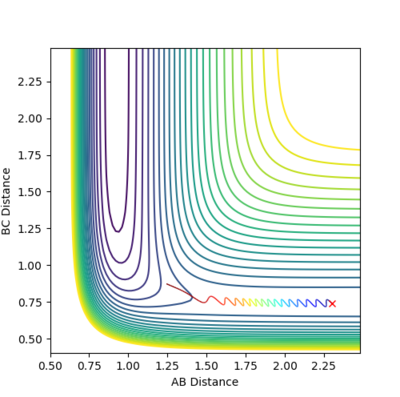
Initial conditions of rHH=0.75A, pHH=2.991, rHF=2.40A, pHF=-3 were used to show a reactive trajectory for the reaction of F + H2. These values were found via trial and error, see figure 22. Kinetic energy from this reaction is converted to heat energy. This can be seen by the energy vs time plot where the kinetic energy oscillates showing the increase in vibrational energy of the molecule which is converted into heat energy. The energy is shown to remain the same in the system as the potential energy and the kinetic energy of the system are mirror images of each other. Therefore, the total energy of the system remains constant, figure 23. The use of a bomb calorimeter could be used experimentally to determine the heat released in this reaction.
Through trial and error of varying pHH values between 3 and -3 with set values of pHF=-0.5 and rHH=0.74A and rHF=2.3A. It was found that at pHH close to 3 the trajectory crossed the transition state but recrossed back so the reaction did not go to completion. meanwhile where pHH was close to -3 the trajectory only crossed over the transition state at extreme values but at values below -2.8 the trajectory showed the reaction did not go to completion.
When the positions were kept the same but pFH= -0.8 and pHH= 0.1 the reactant trajectory went across the transition state but did not go down to products.
HF+H
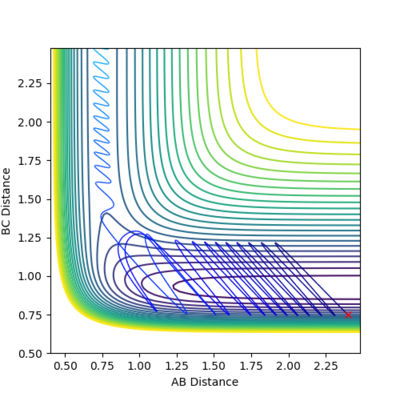
Conditions were set up at the beginning of the entry channel showing a low vibrational mode where pHF=2, rHF=0.75A, rHH=2.4A, pHH=-0.5. This reactive trajectory was then obtained by decreasing pHH while increasing pHF. This shows how the vibrational energy of H-F follows Polanyi's empirical rules as the vibrational energy makes it easier to cross over the late transition barrier. This means that higher vibrational energy will lead to much more efficient reaction as the reaction rate can be increased compared to high translational energy. However, early transition states favour translational energy mode over vibrational mode, therefore greater translational energy will lead to a more efficient reaction in H2+F (https://aip.scitation.org/doi/pdf/10.1063/1.4810007). Comparison of the vibrational mode on figure 22 v. figure 25 shows the difference in vibrational energy on an early transition state (figure 22) and that with a late transition state (figure 25).
Ng611 (talk) 13:24, 8 May 2018 (BST) Well explained.
Ng611 (talk) 13:24, 8 May 2018 (BST) Overall a good report although there were a few misunderstandings here and there.
