MRD:KI5432
19:27, 30 May 2019 (BST) A good report with no major errors. However, you need to focus on making your answers more succinct and to the point. As well as that, pay attention to your layout and presentation which was, in places, sloppy and hard to follow.
On a potential energy surface diagram, how is the transition state mathematically defined?
How can the transition state be identified, and how can it be distinguished from a local minimum of the potential energy surface?
A potential energy surface shows the change in potential energy with internuclear distance. Every point on one of the contour lines has the same energy.
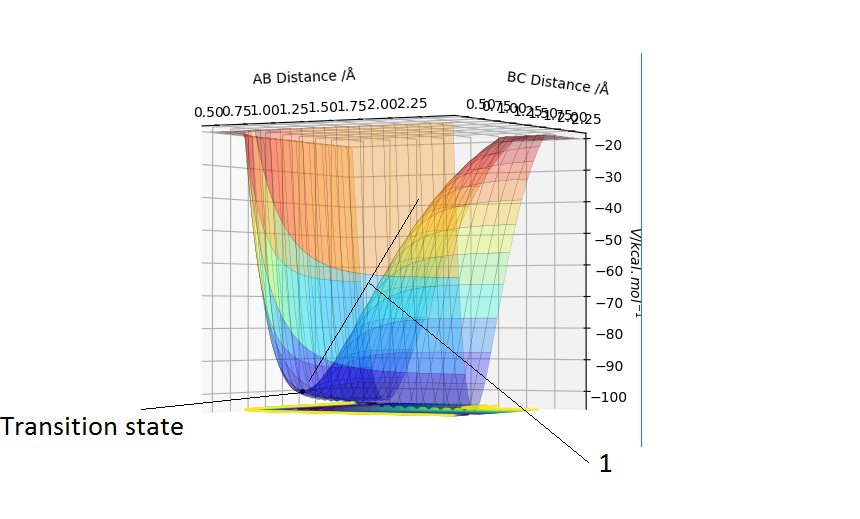
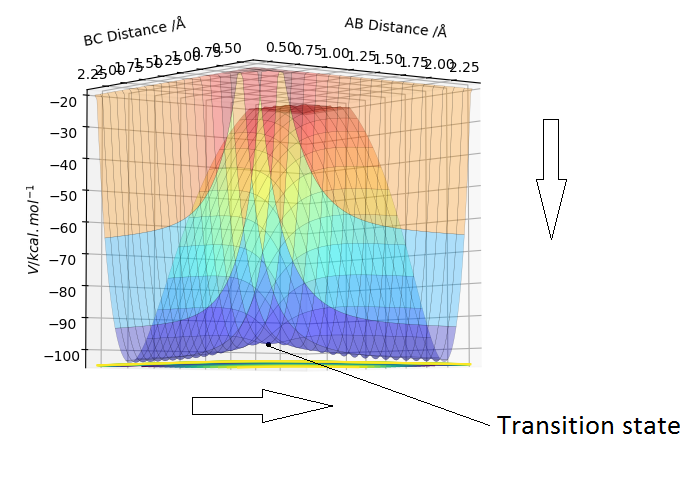
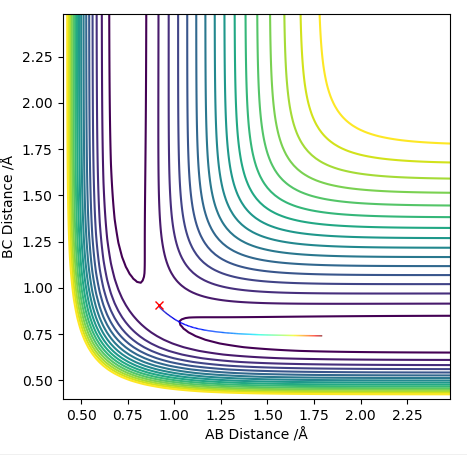
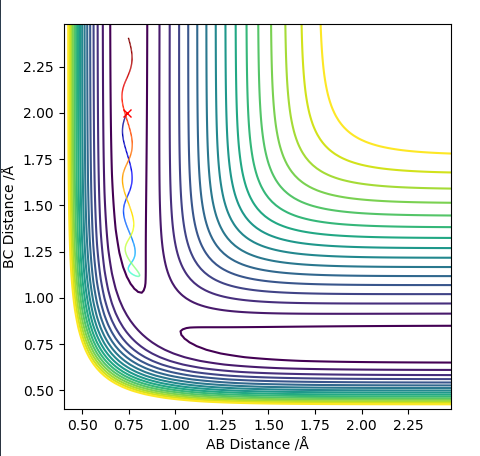
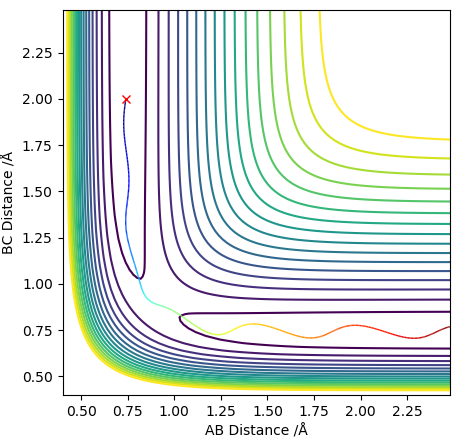
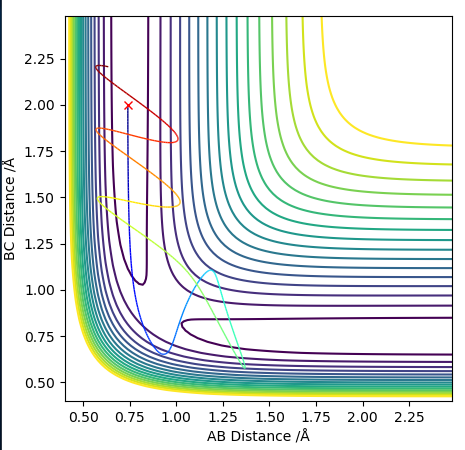
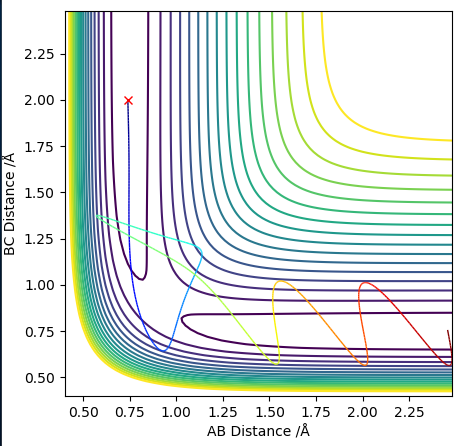
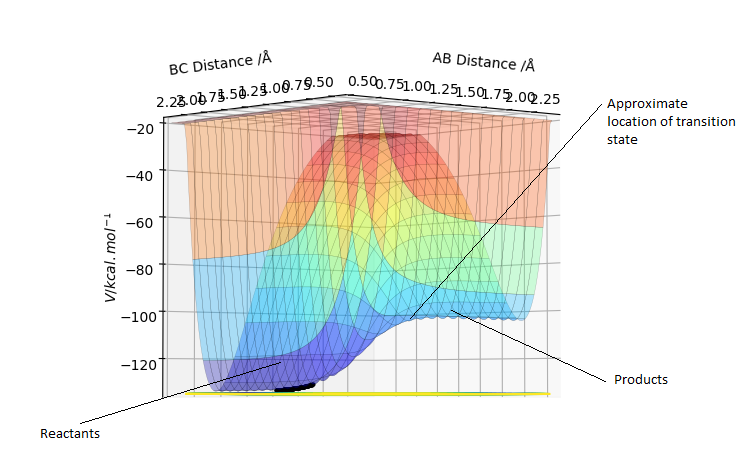
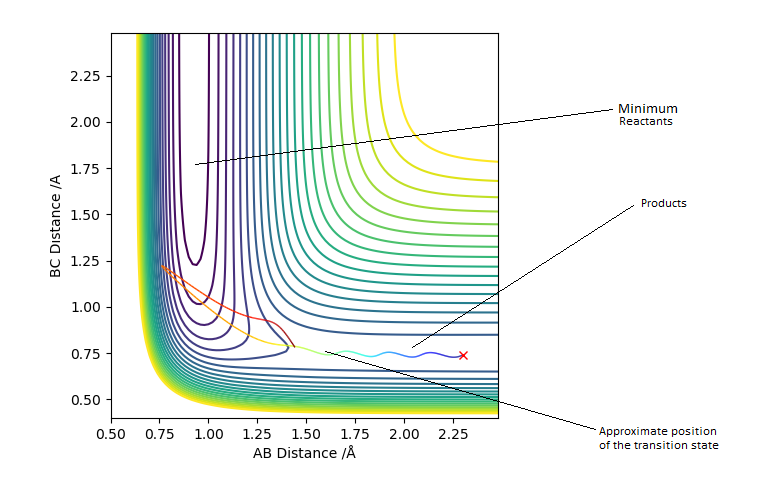
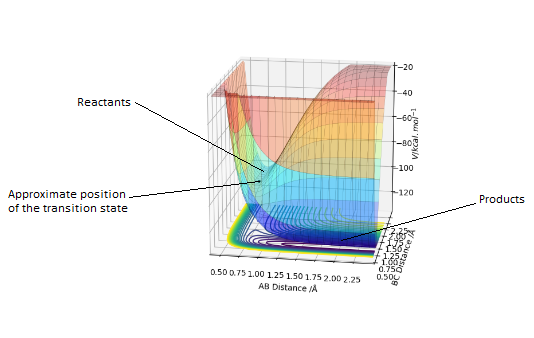
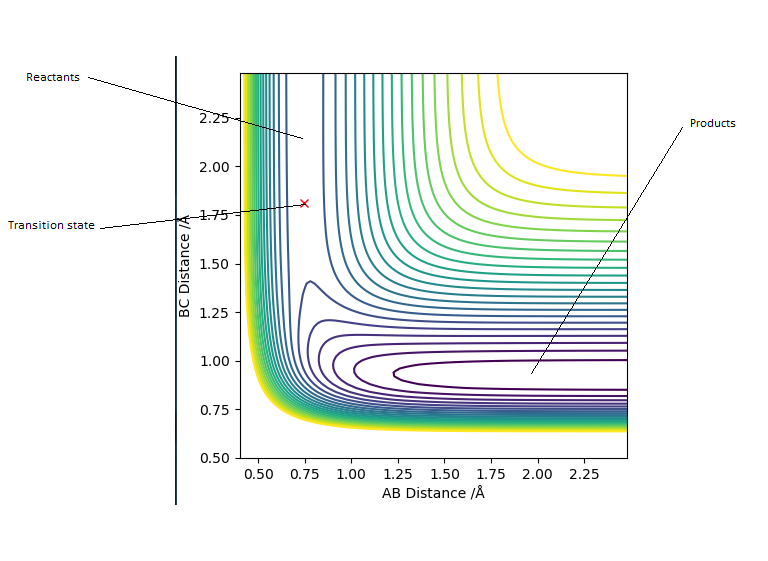
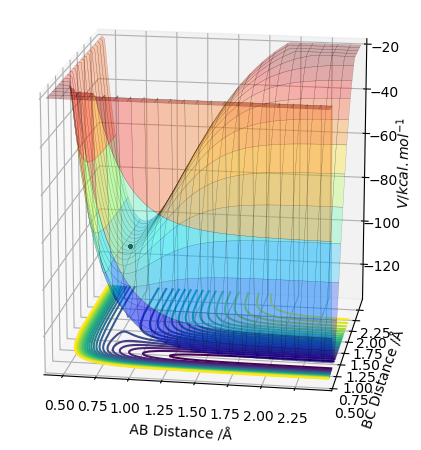
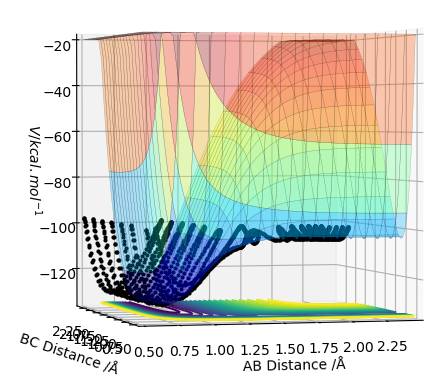
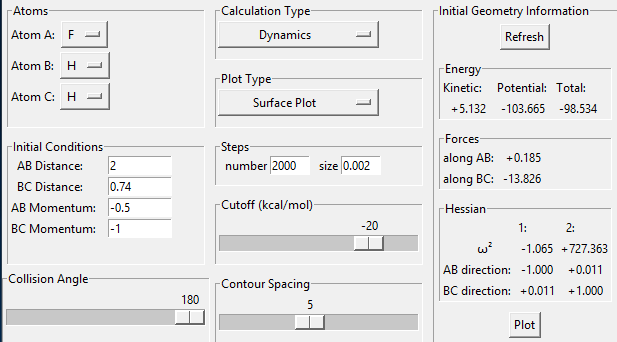
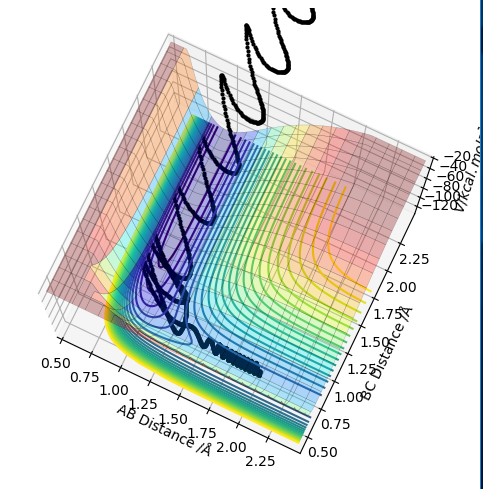
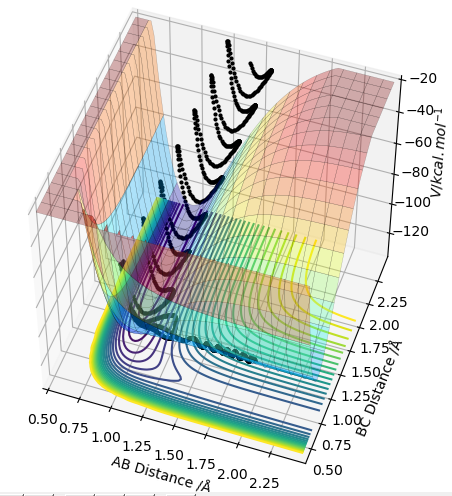
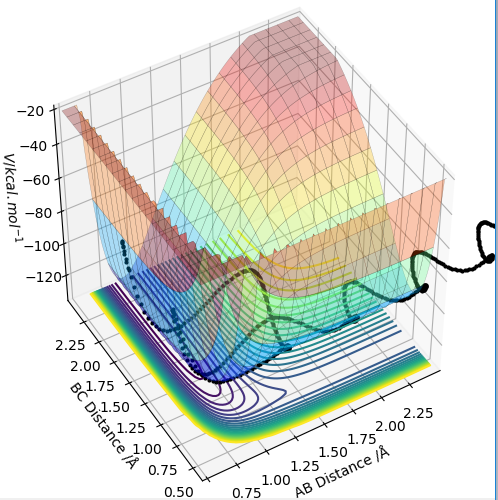
The transition state is the geometry at a saddlepoint on the potential energy surface. That point has a positive curvature in every degree of freedom excluding the one which corresponds to the reaction coordinate. A saddlepoint is not a maximum or a minimum on the PES. The transition state is the maximum on the minimum energy path (MEP) from reactants to products, and simultaneously a minimum in all other directions (orthogonal̠). The fact that the energy goes down most steeply on the MEP from reactants to products is shown in the first picture below, the line 1 drawn very roughly shows this the steep path down the potential energy surface to the transition state geometry. The second image is just an example that if we look horizontally at the transition point we are following the reaction coordinate essentially, and we can see the transition point is a maximum on that curve. But if we look vertically down the face of that 'hill' on the PES, the transition point is a minimum on that curve.
In the picture below it can be seen that the transition state is a saddlepoint on the potential energy surface (PES). For a function of 2 variables (r1 and r2), let us consider 2 conditionsː
1. The partial derivative of the potential with respect to the interatomic distance r1 must be 0.
2. The partial derivative of the potential with respect to the interatomic distance r2 must be 0.
Ng611 (talk) 19:11, 30 May 2019 (BST) Incorrect. Think about how these vectors would be oriented along your PES.
Overall these 2 conditions are saying ∂V(ri)/∂ri=0 (the gradient of the potential will be equal to 0) at that point.
These 2 conditions will be true at both a saddlepoint (the transition state) and a local minimum (both are types of stationary point). This means ∂V(ri)/∂ri=0 holds true at a transition state and a local minimum. However at a local minimum, both of the second partial derivatives will be greater than 0. At a saddlepoint, one partial derivative is less than 0 and the other partial derivative is greater than 0.
To identify the transition stateː we are looking for the point at which the forces acting on the atoms are all equal to 0. If you start trajectories in different areas of the reaction path on the PES and observe whether the trajectory rolls towards the reactants or products, you can start to identify the range within which the transition point must lie. If you continue selecting points within that region, you can eventually identify a small approximate range within which the trajectories flip from ending up in the reactants to ending up in the products. You then run trajectories and look for the point at which, when you start a trajectory there (with no initial momentum),the system does not roll anywhere (there is no trajectory). This is the transition point.
In order to distinguish the transition point from a local minimum, we can start trajectories on just either side of each site (e.g. 0.5 to the left and right). For a transition point the system will 'roll' towards the products (a local minimum) if you start the path on e.g. the left, and the system will roll towards the reactants (another local minimum) if you start the path on the opposite side (the right). For a local minimum, it doesn't matter whether you start the path just to the right or just to the left of the point, it will just roll to that local minimum.
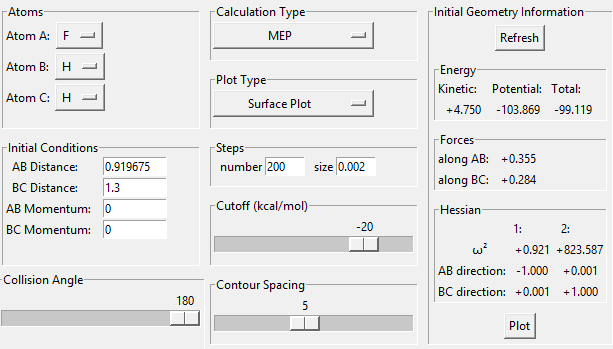
==Report your best estimate of the transition state position (rts) and explain your reasoning illustrating it with a “Internuclear Distances vs Time” plot for a relevant trajectory.
==
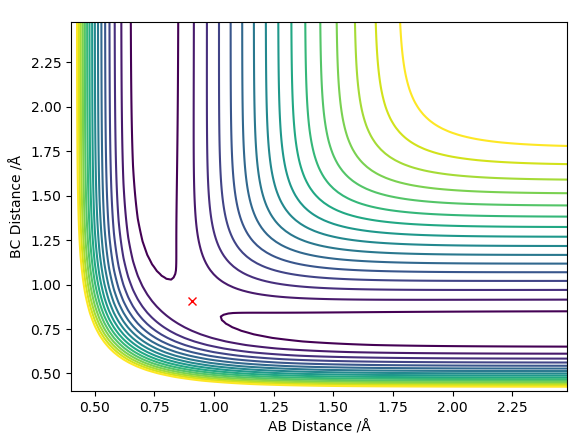
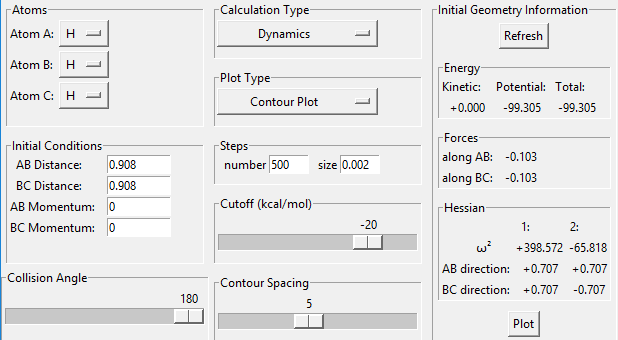
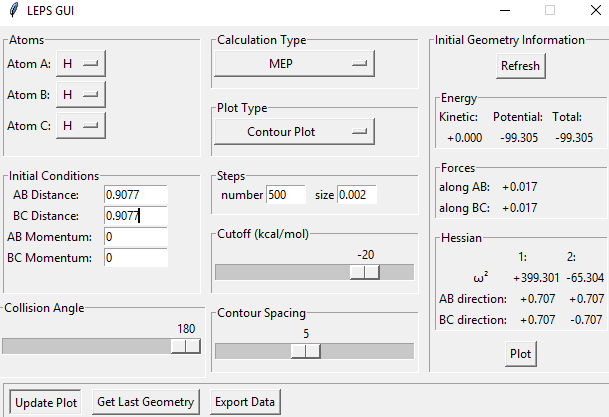
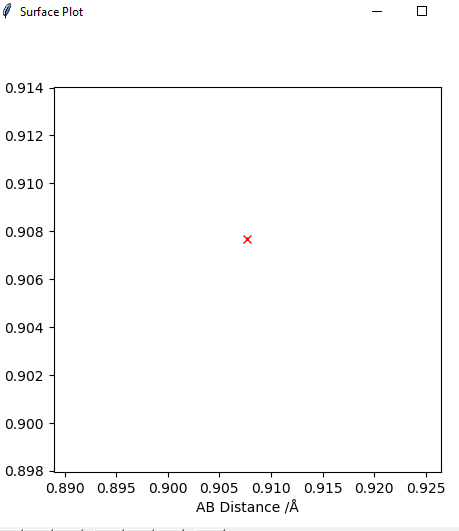
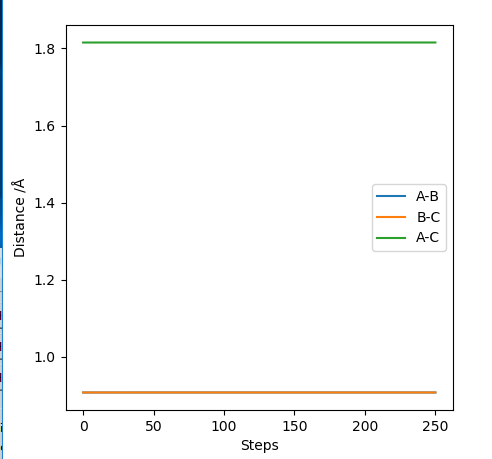
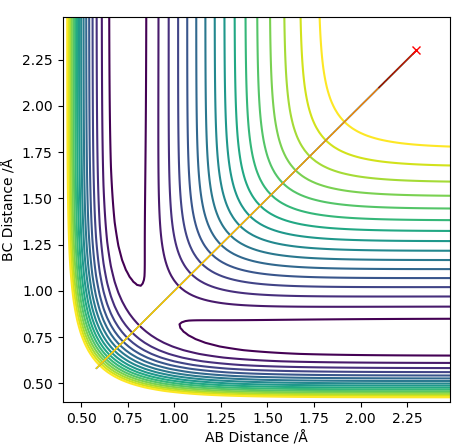
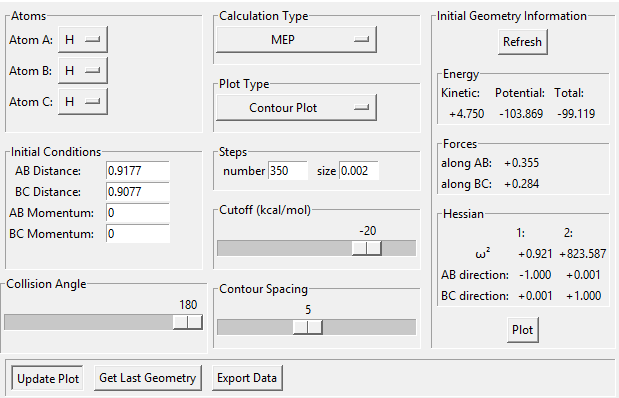
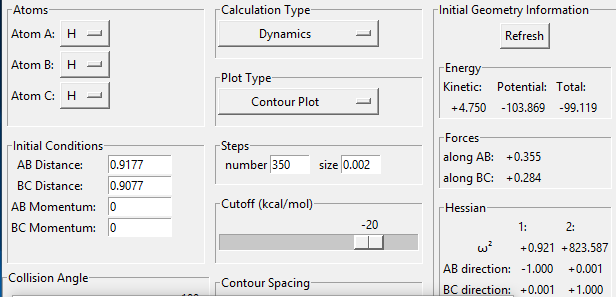
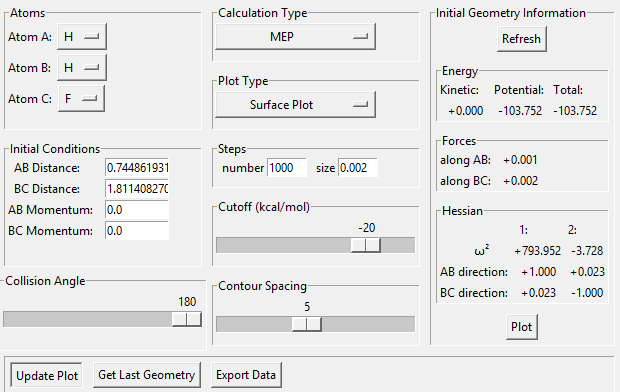
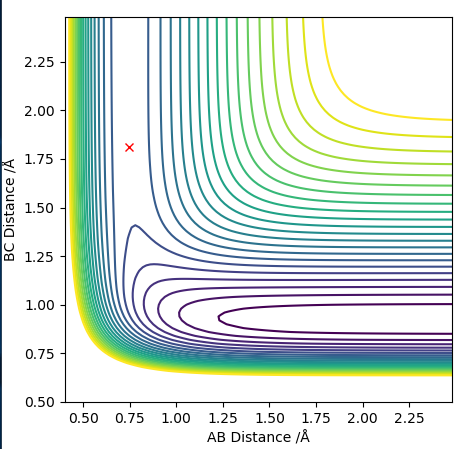
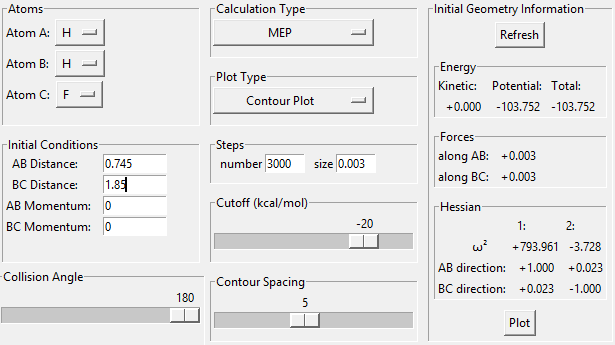
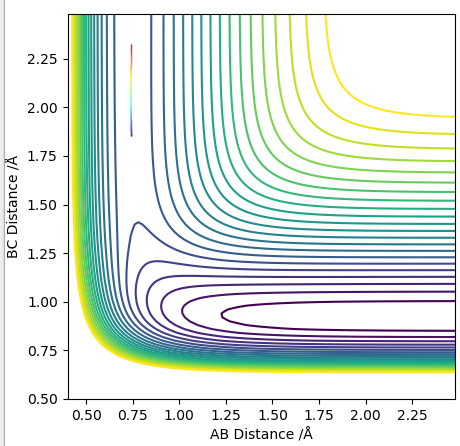
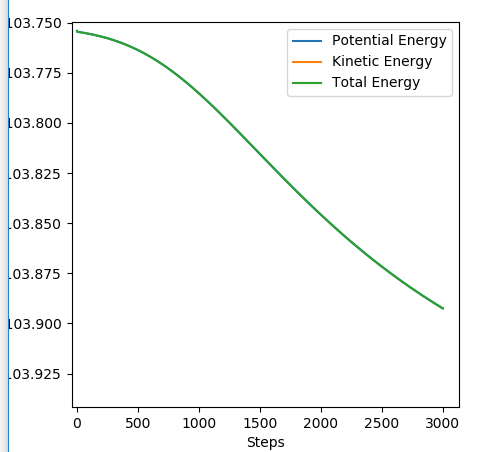
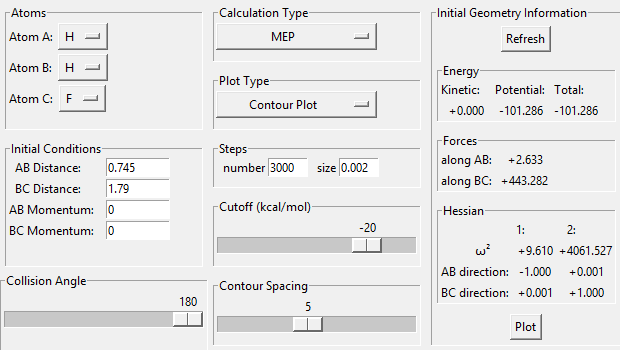
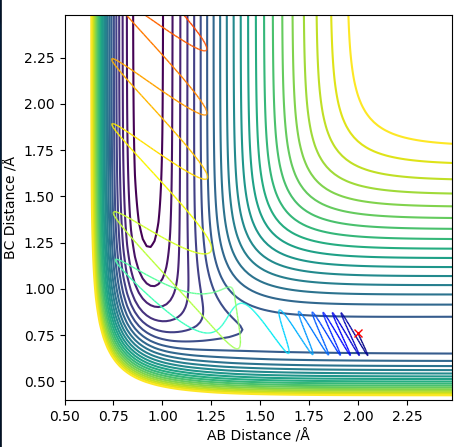
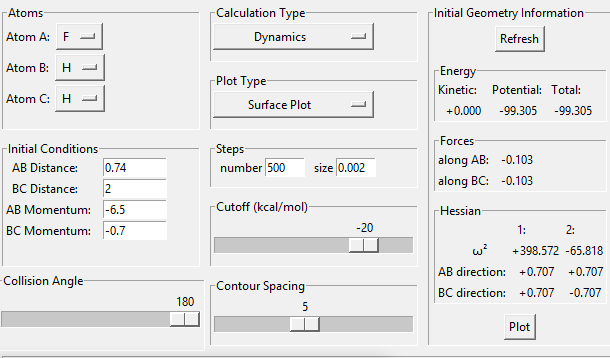
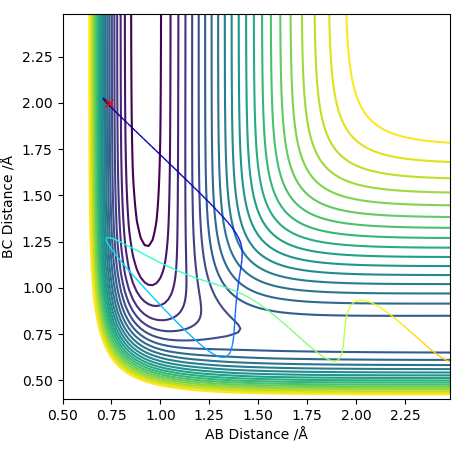
Transition state position = (0.9077, 0.9077) (or (0.908, 0.908) if quoting to 3 d. p.) - this is where the forces on the atoms are approximately 0 and the system does not move when the initial conditions are at the transition point (shown on the contour plot). The fourth plot shown below is the internuclear distance vs time graph for this trajectory. The distance between the 2 outermost H atoms of the transition state are at a constant distance, shown by the A-C line at approximate 1.8 angstroms. The A-B and B-C lines are overlapping because the transition state complex is symmetrical, so the A-B distance is the same and the B-C distance (and they are closer together than the A-C distance, at approximately 0.6 angstroms. This proves we are at the transition state position as the distances remain constant over time and the 'bonds' in the transition state are symmetrical as we would expect for this molecule. To confirm this is a transition state, you can see that there is a symmetric vibration of the transition state A---B---C that occurs periodically. Could use MEP to gradually vary right into the transition state as you can watch for when the oscillations on the internuclear distances vs time graph decrease in amplitude and then reach 0 at the transition state. If there is still an oscillation in the graph, you haven't reached an energy minima.
Transition state is shown in red on contour plot below.
Zoomed in on the contour plot, y-axis is BC distance in angstromsː
Internuclear distances vs time plot for the initial conditions aboveː
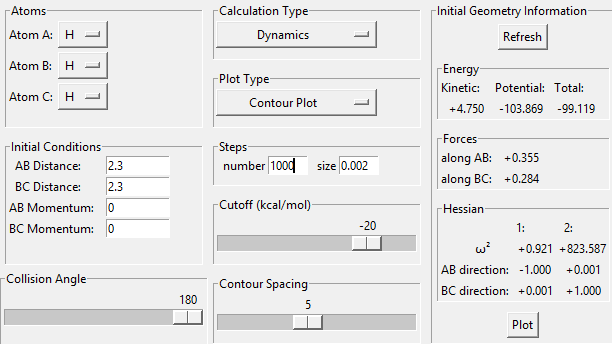
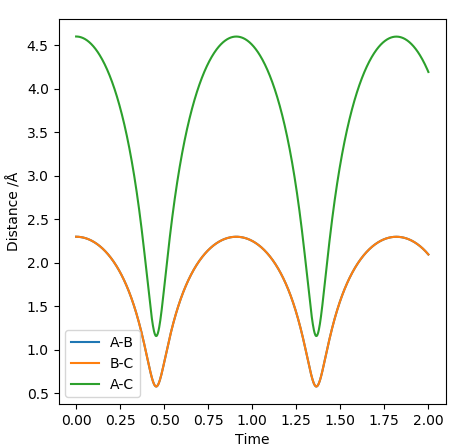
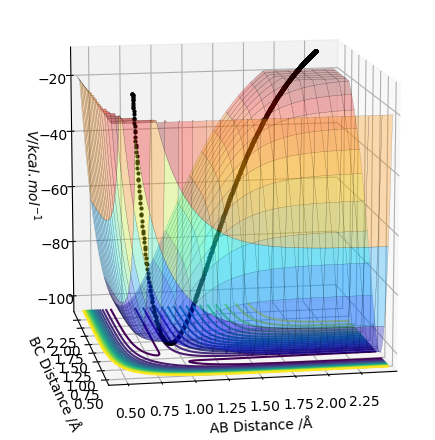
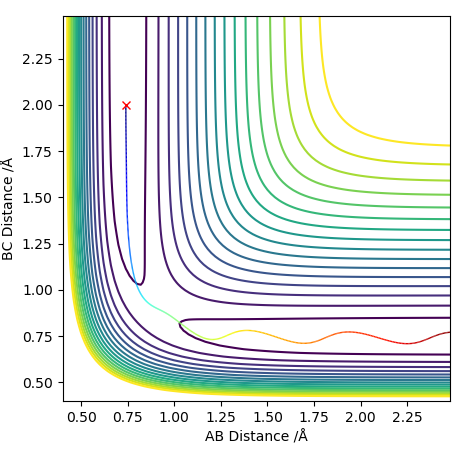
As the PES for this system will be symmetrical, we know the transition state geometry will lie on the line x = y (here AB = BC). Below I have started a trajectory on the point (2.3, 2.3) and we can see the system oscillates on the ridge and never falls off. It never leaves the ridge as there is no gradient at right angles to that ridge.
Contour plotː
Internuclear distances vs timeː
The graph above shows that over time the transition state is formed, dissociated and then formed again as the system travels down the ridge and back up again, then down again etc. If we set off an MEP trajectory on from (2.3, 2.3) would expect the system to roll down then stop at the transition state geometry. The graph above just shows that we have massive oscillations when we move away from the transition state geometry.
PES for trajectory on ridgeː
==Comment on how the mep and the trajectory you just calculated differ.
==
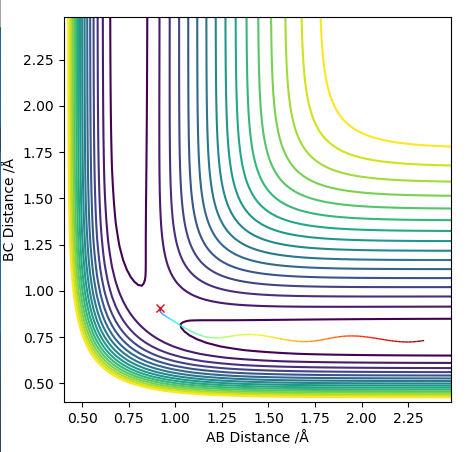
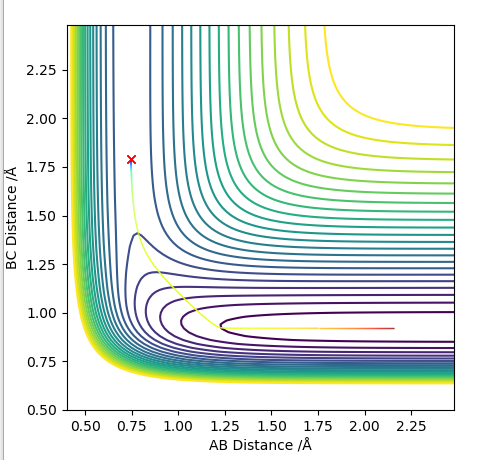
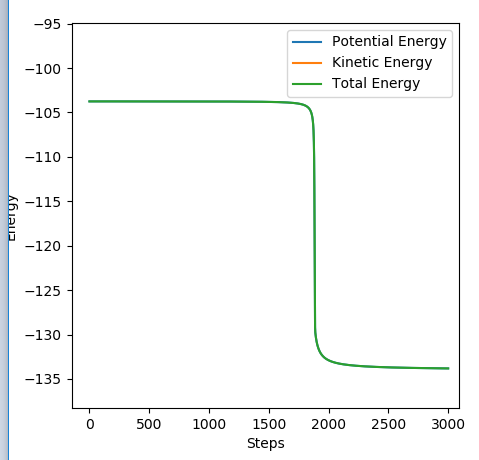
Both the 'mep' and the 'Dynamics' trajectory end at the reactants (know it is the reactants side because of the bond lengths in the initial conditions) as the trajectory is started just on the reactants side of the transition state, so the system will flow down into that local minimum which is the reactants. They both end at the lowest energy point in the minimum. If it were started on the other side of the transition state it would flow down into the products. The 'Dynamics' trajectory shows oscillations as the diatomic is allowed to vibrate, whereas for the 'mep' the diatomic does not vibrate and the path is straight (all the atoms are held stationary rather than oscillating). The 'mep' performs a calculation, then resets the momentum on all atom to 0 and then performs another calculation and repeats the process. It is the most 'efficient' way of reaching the lowest energy point, i.e. the lowest energy pathway from reactants to products. An MEP is the most likely reaction pathway to occur (often used to map out a reaction coordinate for a reaction), but not the only possible one. At any point along the MEP, we are at an energy minimum in any direction that is perpendicular to the path. For the 'dynamics' pathway, we do not reset the momentum to 0 with each step, so the diatomic has kinetic energy and it vibrates. The initial kinetic energy is converted into potential energy. The atoms in the diatomic approach each other until they reach a minimum length between them (separation), which is shorter than the diatomic's equilibrium distance. Then the repulsion between the atoms makes them move apart again. Start with initial kinetic energy (i.e. momentum) which makes the atoms move inwards, then at their minimum separation that energy is present as potential energy, then it's converted to kinetic energy again as the atoms move apart, then it's stored as potential energy again at the maximum separation. This cycle continues - the diatomic is vibrating, causing the line to oscillate as the interatomic distances change. Total energy is conserved so this oscillation has a regular amplitude/is regular. The 'dynamics' trajectory shows the interatomic distance of the diatomic changing as the potential and kinetic energy are exchanged during the bond vibration. The oscillation is symmetrical as it happens by same amount. As for the 'mep' the atoms are held stationary there is no oscillation.
The 'mep' is shown below.
The 'Dynamics' trajectory is shown below.
==Complete the table above by adding the total energy, whether the trajectory is reactive or unreactive, and provide a plot of the trajectory and a small description for what happens along the trajectory. What can you conclude from the table? ==
A trajectory is reactive if it gets from the reactants to the products, no matter the route. From the table it is possible to conclude that it is the not the case that (from a certain starting point) a certain total amount of energy/kinetic energy/momentum needs to be made available to the system for the reaction to occur, what is important is that a certain amount of energy is needed with the correct distribution of energy between the diatomic and the atom. It's not that you can give the system a certain amount of momentum overall and the reaction will occur, it's that the atom has a certain threshold of momentum it needs to be able to react and so does that diatomic, but above that the kinetic energy of the diatomic and the kinetic energy of the atom need to complement each other, i.e. certain combinations work and others don't. The diatomic and the atom need to collide with a compatible amount of energy in each component, otherwise there will no reaction/the trajectory will be unreactive.
It seems that having enough kinetic energy to overcome the activation barrier is not all that is needed to have a reactive trajectory, as even when the system has enough energy to pass over the transition state it still sometimes 'recrosses' back to form the reactants. Distribution/the ratio of the momentum among the reactants is important, as is the orientation of the atoms as they collide (not considered in the data here).
Ng611 (talk) 19:14, 30 May 2019 (BST) Good!
==State what are the main assumptions of Transition State Theory. Given the results you have obtained, how will Transition State Theory predictions for reaction rate values compare with experimental values? ==
The main assumptions of Transition State Theory areː
1) The Born-Oppenheimer approximation is used.
2) Any quantum tunnelling effects are negligible.
3) Once the transition state structure is formed from the reactants (i.e. once the system has reached the saddlepoint when going towards the products region from the reactants region), it cannot fall backwards and regenerate the reactants.
4) Once the system is in the transition state, we can separate motion along the reaction coordinate from other motions and treat it classically as a translation.
5) Even if there is no equilbrium between the reactants and products, the transition state structure is in a constant equilibrium with the reactants. Also the transition states are distributed amongst their states following the Maxwell-Boltzmann laws.
6) The reactants have energies that follow the Boltzmann distribution. If the system has been allowed to thermally equilibrate this should hold true. (A further assumption can be made that any reactants that come into the system (an incoming flux of reactants that happens if the reactants are not bounded) will also have energies that follow the Boltzmann distribution, but sometimes this doesn't hold true).
In terms of using TST to calculate the rate constant for a reaction, it is assumed that the transition state has a finite width, which we can let approach 0.
If we consider the penultimate situation in the table from the last question, the transition state structure is shown to form the transition state structure (perhaps even form the products) but then still collapse back to the reactants. This shows that assumption 3 has been broken. This indicates that the rate constants predicted by transition state theory will be higher than experimental values, as the theory does not account for the fact that this 'recrossing' situation can sometimes occur. TST would predict that the reaction must occur and the products must form as the transition state structure has been formed and there is no way to go back. TST would predict a higher reaction rate than actually occurs as it would predict products were formed/reactants used up when they were not. Rate dependent on concentration of product generated per unit time or concentration of reactants used up per unit time.
==By inspecting the potential energy surfaces, classify the F + H2 and H + HF reactions according to their energetics (endothermic or exothermic). How does this relate to the bond strength of the chemical species involved?
==
For the H + HF reactionː
Potential energy surfaceː
Contour plotː
(Please ignore the trajectory on the surface. Can see there is only 1 energy minimum, in the reactants region.)
In the initial set-up the F-H bond is shorter than the H-H distance so this is the H + HF reaction. As C approaches B the B-A bond is constant. We are at a lower energy in the reactants (the global minimum). The potential energy surface then rises in energy as the transition point is traversed and we reach the products, which are at a higher energy. As the reactants are at a lower energy on the potential energy surface than the products are, this reaction is endothermic (energy needs to be put in for the reaction to occur/energy is consumed during the reaction - i.e. ∆H°>0 for this reaction so it is endothermic). This can also be seen in the contour plot, where the reactants are shown in deep blue and the products in a lighter colour, and the colours corresponds to their relative energies, with the dark curves in the reactants region meaning they are lower in energy. It can also be seen that on the contour plot there is only 1 minimum (in the reactants region), which stands in contrast to the plot for the H + H2 reaction where the contour plot was symmetric with 2 minima, as the reactants and products were identical and had the same energy. If we consider this PES in regards to Hammond's postulate, the transition state will resemble the products (as the reaction is endothermic), and it will energetically be closer to the products than the reactants.
For the F + H2 reactionː
PESː
Contour plotː
(Can see there is only 1 energy minima in the products region.)
In the initial set-up the H-H bond is shorter than the F-H distance so this is the F + H2 reaction. As C approaches B the B-A bond is constant. We are at a higher energy in the reactants. The potential energy surface then drops in energy as the transition point is traversed and we reach the products (the global minimum), which are at a lower energy. As the reactants are at a higher energy on the potential energy surface than the products are, this reaction is exothermic (energy is released during the reaction - i.e. ∆H°<0 for this reaction so it is exothermic). This can also be seen in the contour plot, where the products are shown in deep blue and the reactants in a lighter colour, and the colours corresponds to their relative energies, with the dark curves in the products region meaning they are lower in energy. It can also be seen that on the contour plot there is only 1 minimum, in the products region. If we consider this PES in regards to Hammond's postulate, the transition state will resemble the reactants as the reaction is exothermic, and it will energetically be closer to the reactants than the products.
From this it can be concluded that the H-F bond strength is higher than the H-H bond strength as the H-F species is lower in energy (more stable) and forms readily (it is energetically favourable to form H-F, an exothermic reaction/energy is released), whereas the H-H species is higher in energy (less stable) and needs an input of energy to form. For the H + HF reaction a H-F bond must be broken and that is an endothermic process(unfavourable), whereas in the F + H2 reaction a H-H bond is broken and that is an exothermic (favourable) process. We have to travel uphill on the PES in order to break the H-F bond and reform the H-H bond. We have to travel downhill on the PES in order to break the H-H bond and form the H-F bond.
Ng611 (talk) 19:17, 30 May 2019 (BST) This answer is correct, but extremely waffley. Merely noting that the energy of the H-H + F complex is higher than the H + F-H complex (along with a pared-down rationalisation of why this is) would be sufficient.
==Locate the approximate position of the transition state. ==
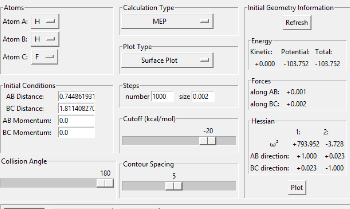
The approximate position of the transition state is the same for both reactionsː (to 3 d.p.)ː (BC, AB) = (1.811, 0.745) The 2 reactions run on the same PES, but in different directions and they share a transition state.
==Report the activation energy for both reactions. ==
The activation energy is the difference between the ground state of the reactants and the energy of the transition states.
For F + H2ː
Going from very close to the transition state and then down into the reactants well, crossing over the activation energy barrier.
Energy vs time plot (y-axis is negative)ː
Eɑ = - 103.754 - (-103.891) = 0.137 kcal/mol
For H + HFː
Ea = -103.82 - (-133.544) = 29.724 kcal/mol
Ng611 (talk) 19:18, 30 May 2019 (BST) Good!
== Identify a set of initial conditions that results in a reactive trajectory for the F + H2, and look at the “Animation” and “Momenta vs Time”. In light of the fact that energy is conserved, discuss the mechanism of release of the reaction energy. Explain how this could be confirmed experimentally. ==
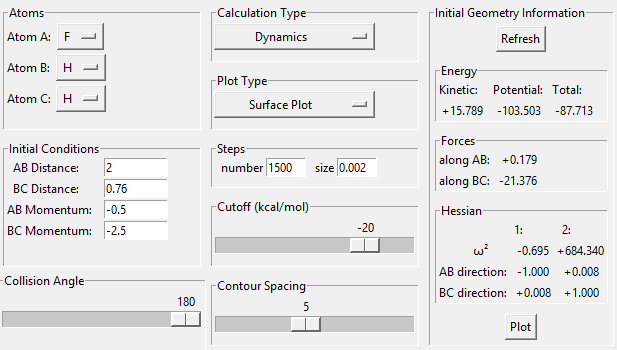
A reactive trajectory for F + H2, the exothermic reactionː
PESː
Contour plotː
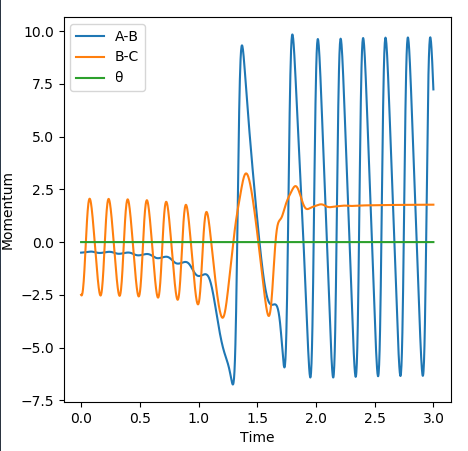
It can be seen in this contour plot that the B-C diatomic vibrates with a certain amplitude, collides with the F atom, the system passes over the transition state, and then the diatomic A-B that's formed vibrates with a much higher amplitude.
Momenta vs time graphː
In this graph we can see that the total energy remains constant overall (green line), i.e. energy is conserved. We can see from the orange line that B-C is vibrating with a certain energy at first, then there is a more complex period where energy appears to be 'transferred' to the A-B diatomic (blue line). The A-B diatomic then vibrates with a higher energy that the B-C diatomic had, and the momentum of B-C becomes constant.
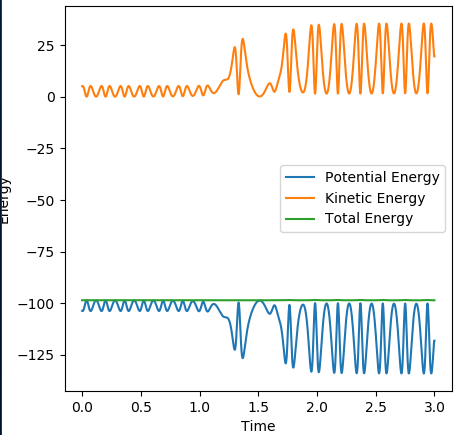
Energy vs time graphː
In this graph we see the continuous exchange between kinetic and potential energy as the diatomics (B-C at first then A-B) vibrate - note that when the kinetic energy peaks the potential energy is at a trough, and vice versa. The B-C vibration has a lower energy and then there is a transition period and the A-B diatomic vibrates with a higher energy. Again see the total energy is conserved. Also note that the amplitude of the wave increases dramatically but the frequency of oscillation doesn't appear to change much, indicating energy going into vibrational modes rather than into translation.
If we look at the Animation mode, we see the followingː
Start with the heavy atom (F) alone on the left-hand-side, diatomic (H2) on the right. The diatomic begins to approach F, and as it does so it is gently vibrating. Once the diatomic gets within a certain proximity to F it appears to vibrate more slowly, and the F gets pulled toward the diatomic slightly. One H atom of the diatomic then gets pulled across towards F, then pulled back to the other H atom and forms a bond with the F, leaving a stationary H atom on the right-hand-side, back towards the F, then back towards the H (like a tug-of-war). After the H gets pulled towards F once again, it stays associated with F and the other H moves away to the right. The H-F diatomic vibrates once the H-F bond is formed, and with much more energy than the H-H diatomic did.
As overall total energy is conserved yet we know energy is lost from the system as it is an exothermic reaction, we can see that the excess energy released from the H-F bond making that wasn't balanced/cancelled out by the H-H bond breaking (energy is released when bonds are formed, put in when bonds are broken) has gone into the kinetic energy of the system, meaning that the momentum/kinetic is higher and the molecule vibrates with more energy. The mechanism of release of the reaction energy is in the form of a mixed energy release. Mixed energy releases occur in the transition state region, and it is both translational and vibrational. Here we see more of the energy that is released goes into the vibrations of the molecule than goes into the translation. In the contour plot we can see that the amplitude of the oscillation increases more than the frequency of the oscillation does, indicating more energy goes into vibration that translation.
Experimentally we can confirm that more energy is released into the vibration than the translation using IR spectroscopy. We start with a H-H diatomic which will be won't have an IR active modes as it is symmetrical, then we will generate a H-F molecule which will have IR active stretches. If a lot of energy was being released into the vibrational modes of the molecule instead of the translation, we would see overtones rather than a single peak in the IR spectrum of H-F (due to transitions to higher vibrational states of the molecule made possible by the high vibrational energy). If a lot of energy was being released into the translation of the molecule instead of the vibration, we would not see those overtones in the IR spectrum. We could also use IR chemiluminscence to confirm that the energy released by the reaction is undergoes conversion into vibrational energy of the H-F bond, by detecting the populations of product molecules that are vibrationally excited.
Ng611 (talk) 19:20, 30 May 2019 (BST) Good!
==The cases studied are an illustration of Polanyi's empirical rules. Discuss how the distribution of energy between different modes (translation and vibration) affect the efficiency of the reaction, and how this is influenced by the position of the transition state.
Polanyi's rules consider how the rates of reactions are affected by various forms of energy. Polanyi's rules state that for a late-barrier reaction, i.e. a reaction in which the transition state resembles the products more than the reactants, the efficiency of vibrational energy in activating the reaction is higher than that of translational energy. For an early-barrier reaction, i.e. a reaction in which the transition state resembles the reactants more than the products, the efficiency of translational energy in activating the reaction is higher than that of vibrational energy. Therefore the vibrational energy in a system will have less of a contribution to the reaction rate for a early transition state reaction, and the translational energy in a system willl have less of a contribution to the reaction rate for a late transition state reaction.
PART 1
For F + H2 reaction, exothermic, early transition state/early barrier reaction - therefore we expect translational energy to be more effective at activating the reaction than vibrational energy. Here pFH corresponds to translational energy and pHH corresponds to vibrational energy. When we start with low pFH, we only see reactive trajectories at low values of vibrational energy, and increasing the vibrational energy significantly produces unreactive trajectories. However when we have very low vibrational energy and increase the translational energy by only a tiny amount, we see a reactive trajectory. This shows the stronger influence/efficiency of the vibrational energy in activating the reaction, changing it by just a small amount will have a big effect. As the H-H bond is so weak we can still see reactions at slightly high values of pHH like -2.
The translational energy is more important for F + H2 as we have an early transition state - if we consider the PES, starting from the reactants we only have to travel straight forwards (for which we can just use translational energy) in order to cross the transition state (and once crossed will lead to product formation). For an endothermic reaction, vibrational energy is more important as we have a late transition state - starting in the products, we have to go forward but most importantly we have to go around the curve in order to reach the transition state. That requires the oscillations caused by vibration.
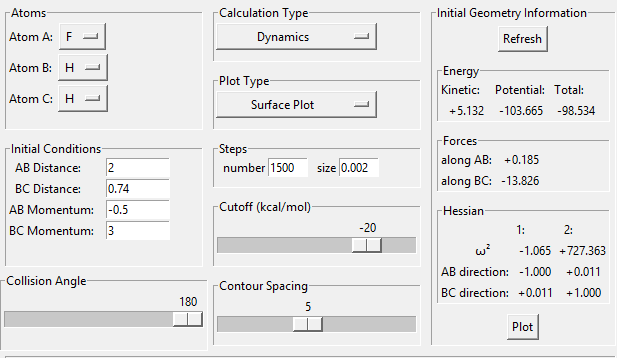
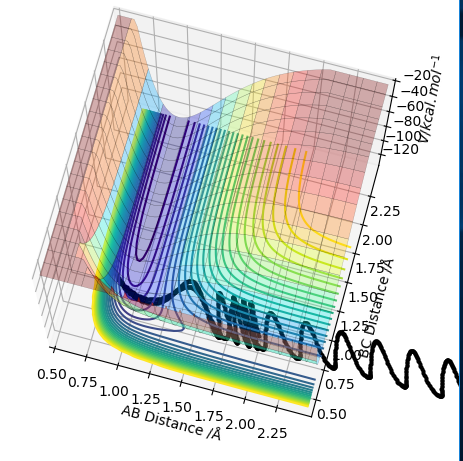
Starting on the reactants side, at the bottom of the well rHH = 0.74, with a momentum pFH = -0.5 (a low amount of energy in the translational mode), exploring values of pHH in the range -3 to 3 and close to these limits. What do you observe? Putting a significant amount of energy (much more than the activation energy) into the system on the H - H vibration. When we vary the values, we see that for values pHH = -3.2, -3 we see no reaction. For pHH =-2, -1, 0 we see a reaction. For pHH = 1, 2, 3, 3.2 we do not see a reaction. So here we see that even increasing the vibrational energy a lot will not get a reactive trajectory (i.e. won't get over the activation energy barrier). Even if we're putting a lot of energy into the system, in the form of vibrational energy, the reaction will still not occur (although it will for some specific values, at relatively low vibrational energy).
As as e.g. of a reactive trajectoryː
E.g. of an unreactive trajectoryː
Trajectory for pFH = -0.8ː
For the same initial position, increase slightly the momentum pFH = -0.8, and considerably reduce the overall energy of the system by reducing the momentum pHH = 0.1. What do you observe now?
Here we have very little vibrational energy in the system, but have increased the amount of translational energy by just a small amount and have thereby made the reaction go (been able to go over the activation barrier). This indicates that for an early barrier/transition state reaction translational energy is more efficient at making the reaction overcome the activation energy and reach the products than vibrational energy is.
PART 2
For H + HFː with very low vibrational motion on on the H - F bond, and an arbitrarily high value of pHH above the activation energy (an H atom colliding with a high kinetic energy).
A reactive trajectory for H + HF (endothermic, late transition state/late barrier reaction) - we expect to see that vibrational energy will have a greater efficiency at activating the reaction than translational energy.
Try to obtain a reactive trajectory by decreasing the momentum of the incoming H atom and increasing the energy of the H - F vibration.
Here to get a reactive trajectory/overcome the activation energy we had have a high vibrational energy and low translational energy. The initial reaction I tried had a high translational energy that exceeded the activation energy for the reaction and a low vibrational energy but even that gave an unreactive trajectory. For the reactive trajectory, nearly all of the energy in the system is vibrational, when an equal amount of translatonal energy did not succeed in overcoming the activation energy (even when the energy used is in large excess of the activation barrier). This indicates that vibrational energy is more efficient in activating a reaction that has a late transition barrier.
Ng611 (talk) 19:21, 30 May 2019 (BST) Good trajectories and good explanations.

