MRD:Jsr3217
H + H2 System
If we define H and H2 as A and BC in our system, as the hydrogen atom collides with the hydrogen molecule, provided H has enough momentum and thus enough energy, the system changes and is described as AB and C where AB is our new diatomic product (A,B and C are the same type of atom).
Question 1: On a potential energy surface diagram, how is the transition state mathematically defined? How can the transition state be identified, and how can it be distinguished from a local minimum of the potential energy surface?
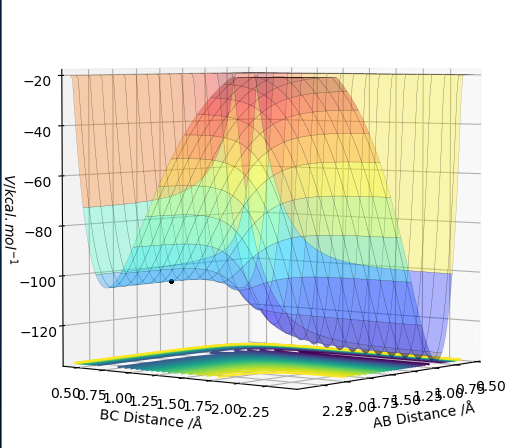
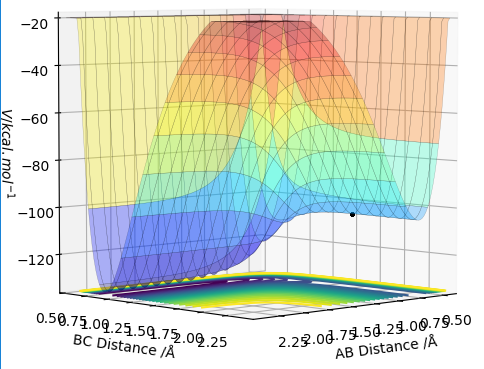
The transition state for this triatomic collision is a saddle point located at the intersection of the two potential energy surfaces, one PES for the Hydrogen atom and 1 PES for the Hydrogen molecule. The transition state is also a maximum on the trajectory pathway.
Firstly the transition state being a turning point has a derivative of 0 with respect to q. This is shown by the following equation: (∂V(q1)/∂q1) and (∂V(q2)/∂q2)=0. However being a saddle point, the transition state is also defined as the point in the surface plot where there is a minimum in the q1 direction but also a maximum in the q2 direction, where q1 and q2 are orthogonal to each other . This is where we have to take into account the second derivative of the potential energy V with respect to q. Mathematically these results are expressed as ∂2V(q1)/∂q12 >0 and ∂2V(q1)/∂q12 <0. The former second order differential equation refers to the minimum point in the q1 direction and the latter second order differential equation refers to the maximum point in the q2 direction.
The transition state can be distinguished from a local minimum of the potential energy surface as by definition a local minimum will only have one 2nd derivative of potential energy (with respect to q in this case) which is greater than 0. However the transition state, being a saddle point, is a point with 2 second derivatives of potential energy in two different directions, one which is greater than 0 and one which is less than 0.
I can tell from this explanation that you understand the shape of the TS on the PES however your discussion here is not quite complete as you haven't defined the directions q1 and q2 so you haven't fully defined the shape of the TS. A diagram with the vectors included would be really helpful here. In general diagrams are useful! Also, the below statement about the equal distances is true of this system only because it is a special case where the system is symmetrical. Be careful using this statement as it is not a generic description of a TS.Rk2918 (talk) 15:23, 3 June 2019 (BST)
Original Surface Plot showing both Potential Energy Surfaces and the Trajectory Pathway:
The transition state is located at the point where the interatomic distances are equal i.e. when the bond length of A-B is equal to the bond length of B-C. This is when the A-B bond is forming to make the diatomic product AB and the B-C bond is breaking leaving C on its own. This is shown below in the contour plot:
Question 2: What is your best estimate of the transition state position (rts) and explain your reasoning illustrating it with a “Internuclear Distances vs Time” plot for a relevant trajectory.
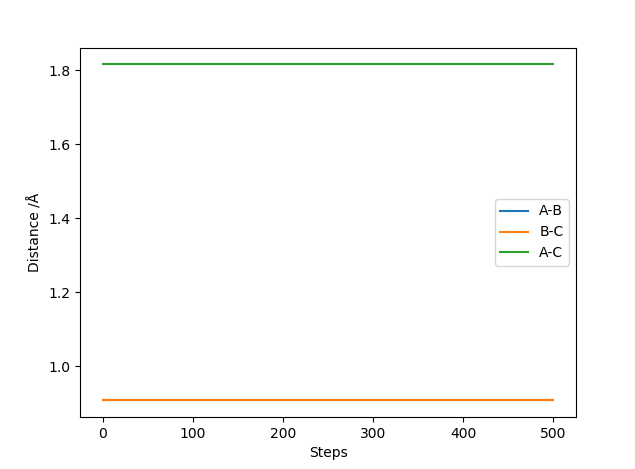
The position of the transition state can be found by varying the AB and BC distances, with both momentum values of AB and BC being 0, until no variation in the Internuclear Distances vs Time Plot is noticed or until a straight line in the plot is seen. No variation or oscillation in the plot means there are no vibrations which is what happens in the transition state. The distance at which no oscillation was seen was found to be at 0.90774 Å.
Internuclear Distance vs Time Plot at the transition state:
Question 3: Comment on how the MEP and the trajectory you just calculated differ.
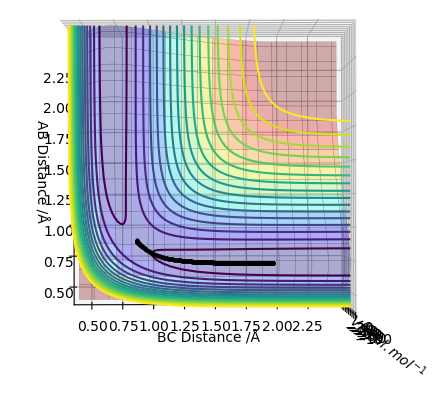
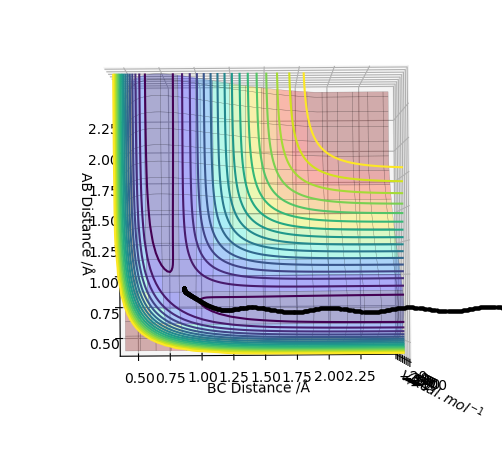
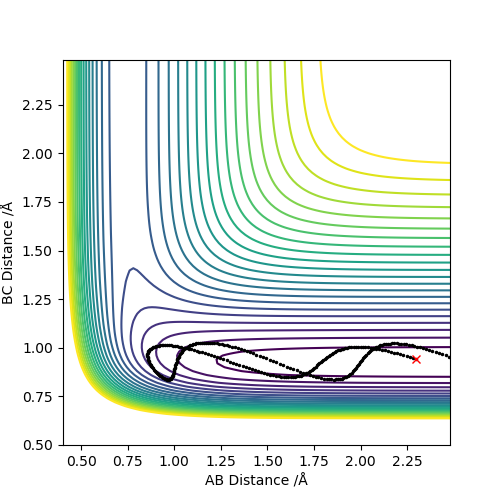
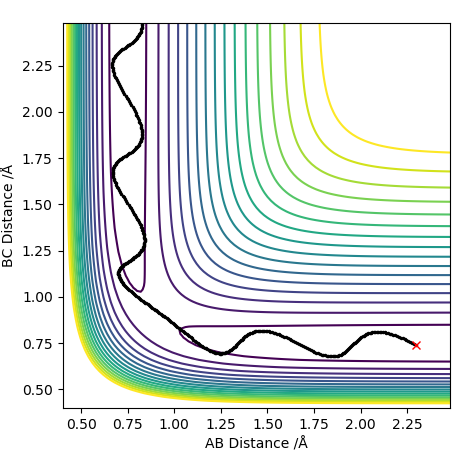
The plot with the MEP calculation shows a relatively short line with little variation in the y-axis (AB distance) however, the plot with the Dynamics calculation shows an oscillating line. The trajectory for the dynamics calculated plot is also longer in length than the MEP calculated plot. This is due to the MEP calculation not considering any vibrational modes therefore no oscillations are shown on the plot. In actuality, atoms have mass and momentum and so the vibrations of the hydrogen molecule are taken into account shown by the oscillations in the dynamics calculation plot. Thus the model with the dynamics calculation is the more accurate one.
Plot with MEP Calculation:
Plot with Dynamics Calculation:
Your observations are valid, but can you think of why the MEP calculations shows no oscillations while the Dynamics calculation does, in terms of the calculation itself? An in depth understanding of the calculation process should aid in understanding the difference between the two methods. Rk2918 (talk) 15:32, 3 June 2019 (BST)
Question 4: Complete the table above by adding the total energy, whether the trajectory is reactive or unreactive, and provide a plot of the trajectory and a small description for what happens along the trajectory. What can you conclude from the table?
What can you conclude overall from the table? Is the deciding factor in whether or not a reaction is successful as simple as a threshold activation energy, which if the molecules have they will definitely react?Rk2918 (talk) 15:34, 3 June 2019 (BST)
Question 5: State what are the main assumptions of Transition State Theory. Given the results you have obtained, how will Transition State Theory predictions for reaction rate values compare with experimental values?
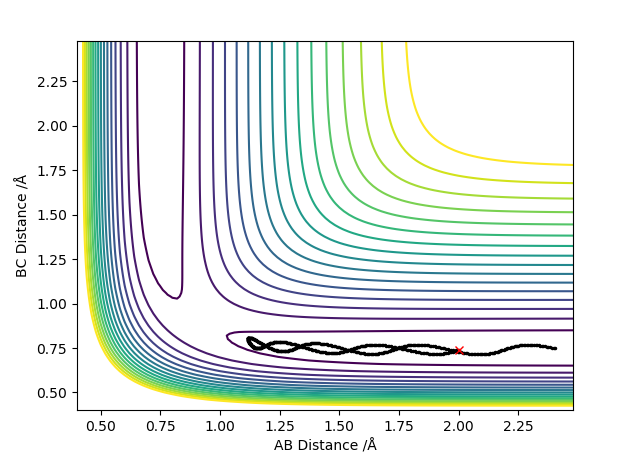
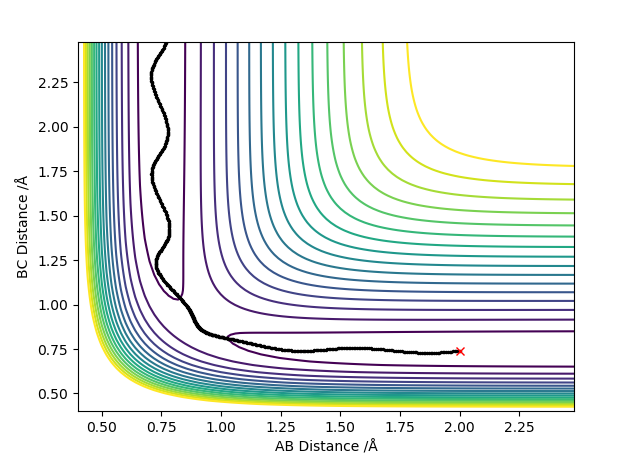
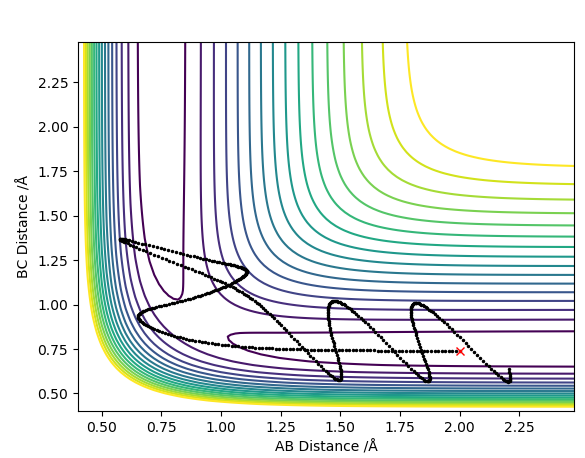
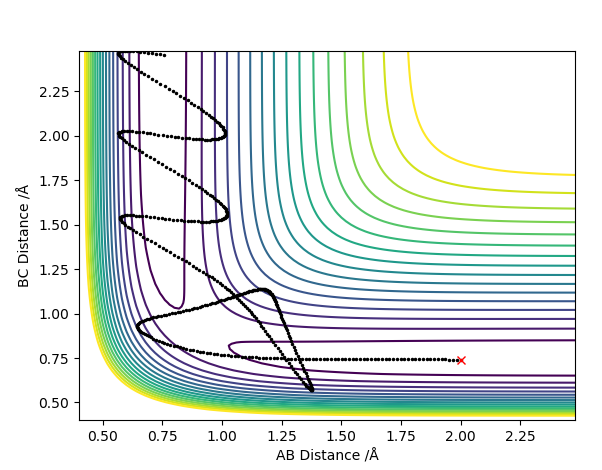
Transition State Theory assumes and tells us that states that 1 the transition state or activated complex in a reaction is in equilibrium with the reactants and once the reactants turn into the activated complex, the complex doesn't return to the reactants. It also assumes the energy of the particles follows a Boltzmann distribution1 but in this system since there are only 3 atoms in total for this triatomic collision there is no boltzmann distribution. As just mentioned, transition state theory assumes once the reactants turn into the activated complex, the complex doesn't return to the reactants. However in contour plot 4 above where the trajectory shows that although the reaction goes through the transition state, the reactants are still reformed. This is because of barrier recrossing as mentioned above; with this present, the rate of this reaction, experimentally determined, would be lower than the reaction rate that the transition state theory would predict.
Great! You have demonstrated a really clear understanding here and explained your point clearly. Rk2918 (talk) 15:36, 3 June 2019 (BST)
F - H - H system
Question 1: By inspecting the potential energy surfaces, classify the F + H2 and H + HF reactions according to their energetics (endothermic or exothermic). How does this relate to the bond strength of the chemical species involved?
The above surface plot shows the potential energy surface for the exothermic conversion of F and H2 to HF and H. The potential energy well slopes downwards from the reactants to the products showing that the energy of the products is lower than the energy of reactants. This reaction is an exothermic one as the bond strength of HF, the product, is stronger than the bond strength of H2, the reactant. This means that the energy released from the formation of the HF bond is greater than the energy required to break the H-H bond in the hydrogen reactant molecule making the overall reaction exothermic.
The above surface plot shows the potential energy surface for the endothermic conversion of HF and H to H2 and F. This reaction is the reverse reaction of the exothermic conversion we've just considered. This potenital energy well slopes upwards from the reactants to the products showing that the energy of the products is higher than the energy of reactants making the reaction endothermic. The energy released from the hydrogen molecule, the product, is less than the energy taken in to break in the H-F bond in the reactant making the overall reaction endothermic.
Question 2: Locate the approximate position of the transition state.
Hammond's postulate essentially states that if 2 species are of similar energy they are of a similar structure. Thus in this reaction we can deduce that the transition state will be similar in structure to the reactants of the forward exothermic reaction, F and H2. By testing and varying the bond distances of F-H and H-H until the forces exterted on each other were 0 (characteristic in the transition state) the internuclear distances found were 1.811 Å for F-H and 0.745 for H-H Å.
You should cite Hammond's postulate here.Rk2918 (talk) 15:41, 3 June 2019 (BST)
Question 3: Report the activation energy for both reactions.
The activation energy can be easily calculated by taking away the reactant energy from the transition state energy. Using the internuclear distances of the atoms in the transition state calculated above in the settings function in the programme, the energy of the transition state was found to be -103.752 kcal mol1. The energy of the reactants, for the exothermic reaction for example, was found by inputting the normal bond length for H2 and making the distance between F and H relatively large so they're not interacting yielding the lowest energy for the reactants possible. From this the activation energies for the exothermic reaction was found to be 30.267 kcal mol1 and the activation energy for the endothermic reaction was found to be 0.242 kcal mol1
This is quite a difficult and you could use plots to show the difference between energy of reactants and products which would better depict the activation energies and support your answers. Rk2918 (talk) 15:43, 3 June 2019 (BST)
Question 4: In light of the fact that energy is conserved, discuss the mechanism of release of the reaction energy for the reaction F + H2 -> HF + H. Explain how this could be confirmed experimentally.
Due to the conservation of energy, all initial kinetic energy from the reactants' momentum is converted and released as heat in the reaction once the products HF and H are formed. Due to the release of heat the surroundings temperature would increase as this is an exothermic reaction. This temperature change or increase in this case can be recorded by bomb calorimetry.
Question 5: Discuss how the distribution of energy between different modes (translation and vibration) affect the efficiency of the reaction for the reaction HF + H -> F + H2, and how this is influenced by the position of the transition state.
For this endothermic reaction (HF + H -> F + H2) there are two main modes of reactant energy to consider as the reactants approach the energy barrier/transition state point to form the products; these modes of energy are translational and vibrational energy. 2Polanyi stated that for simple reactions described as an A + BC system, such as this H + HF system, if they have a late transition state, reactants with high vibrational energy is more effective for the reaction and its success, than reactants with high translational energy. This is because for a late transition state reaction, reactant molecules with high vibrational energy, if in the correct orientation, can vibrate their way to the top of the barrier, passing through the transition state forming the products successfully; however, if the reactants had high translational energy, in trying to reach the top of the energy barrier, they would just collide into the inner wall of the potential energy well and return to where they came from. This reaction being considered here (HF + H -> F + H2) is an endothermic reaction with a late transition state as shown by the surface plot discussed earlier. Therefore to maximise the efficiency and the success of this reaction, reactants should have high vibrational energy. Polanyi also implied, that in this type of reaction (endothermic and late transition state), the products are likely to have high translational energy if the reaction effectively occurs with high vibrational energy reactants.
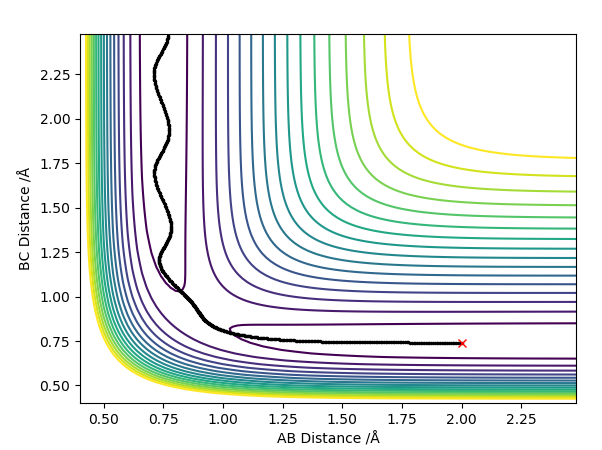
The reaction showing highest efficiency and most effectiveness for its success was then modelled; high vibrational energy was inputted in the settings function for the molecule HF and high initial momentum of the incoming hydrogen atom for the collision was also inputted. However, unfortunately no such combination of momenta and bond length values were found that yielded a successful reaction, but below shows a contour plot with high vibrational energy in the reactants as shown by the oscillating trajectory which is what is needed to ensure high efficiency of this late transition state endothermic reaction.
Maybe you have a high vibrational energy but also a high translational energy? There seem to be large amounts of space covered in between each step (big gaps between the black dots) so perhaps the translational energy was too high. Also, a full investigation of Polanyi's rules would show a reactive trajectory of high vib energy (which does exist but you have not found), an unreactive trajectory of high trans energy, and also for an exothermic reaction these two conditions with opposite observations. Rk2918 (talk) 15:49, 3 June 2019 (BST)
References
1 P. Atkins, J. De Paula, (n.d.). Physical chemistry. 7th edition.
2 J. I. Steinfeld, J. S. Francisco, W. L. Hase Chemical Kinetic and Dynamics Prentice-Hall.


