MRD:Jegajeg01108428
Molecular Reaction Dynamics
H + H2 system
Dynamics from the transition state region
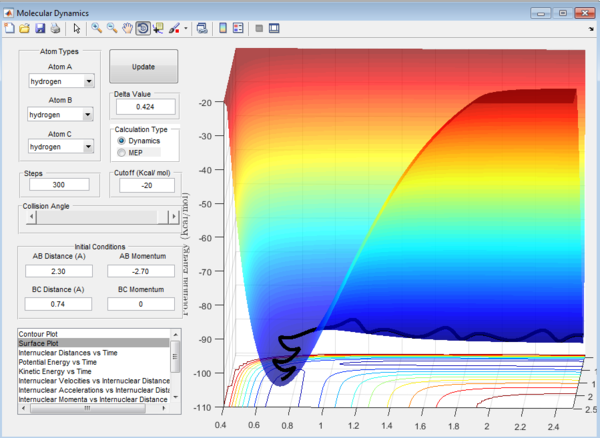
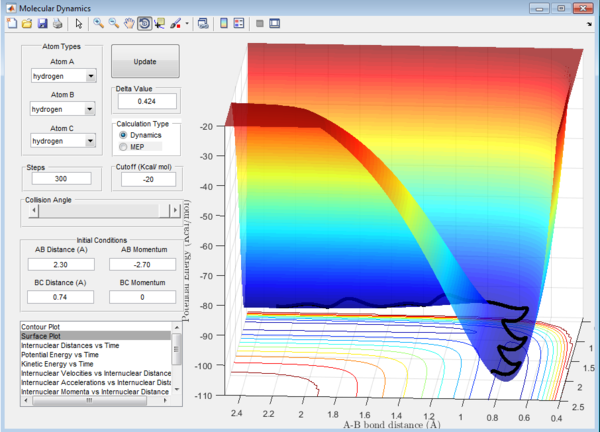
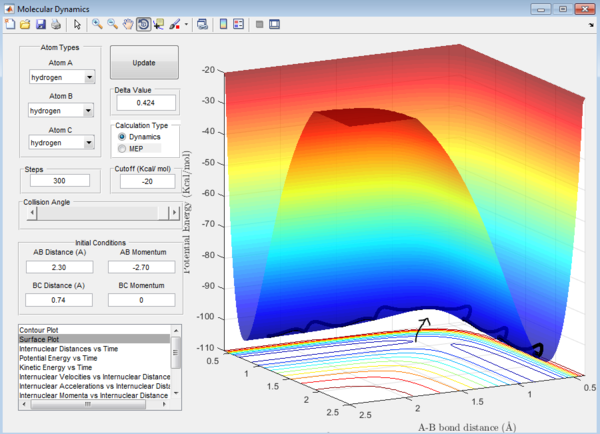
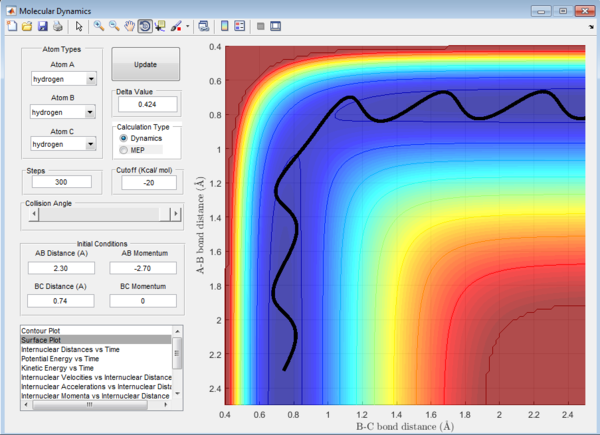
Question 1: The total gradient has a value of zero at a minimum and transition structure. This is because both points are stationary points with a first derivative of the potential energy along the reaction coordinate of zero. The curvature at the minimum and transition state(Figure 3) can be used to differentiate these points where the minimum is a trough and the transition structure is a peak. The second derivative of potential energy along the reaction coordinate is thus positive for the minimum and negative for the transition structure.
Trajectories from r1 = r2: locating the transition state
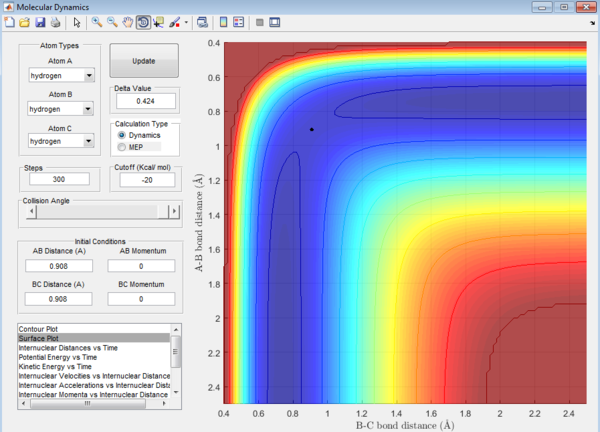
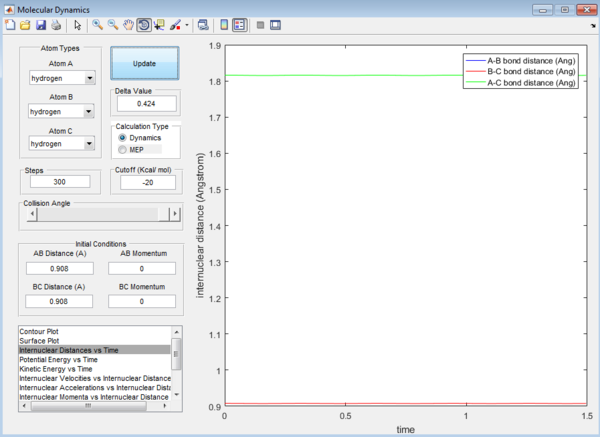
Question 2: Transition state is found at a position where the A-B and B-C distances are 0.908 Å as shown in Figure 5. This is found by trial-and-error method where the r1 and r2 distances are changed until a single point near the maximum of the minimum energy path is achieved. As C leaves and A forms a bond with B, a transition state is achieved when B forms bonds of equal lengths to A and C. This is confirmed by analysing the internuclear distance versus time curve where the straightest line is obtained by setting the distance to be 0.908 Å. A straight line indicates that there is no vibration and thus no change in the length of the bonds. This corresponds to a transition state as the length of a bond stays the same without any vibration in the transition state. A small vibration leads to the structure falling from the maximum to the reactant or product channel.
Calculating reaction path
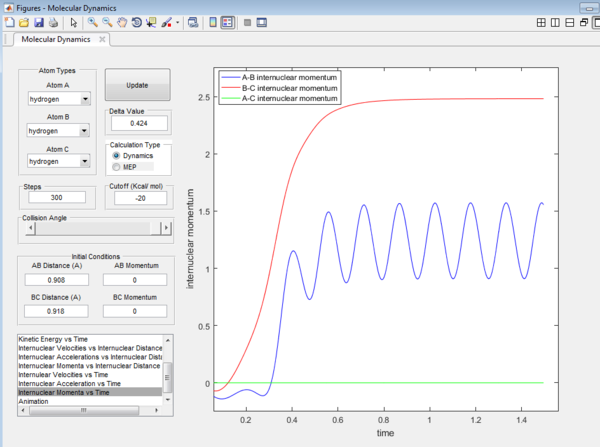
The Internuclear Distances vs Time graph and Internuclear Momenta vs Time graph for trajectories from r1 = rts+0.01, r2 = rts are shown below:
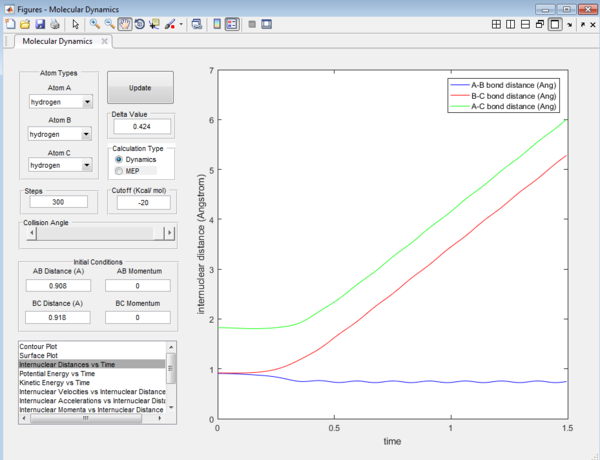
The final values of the positions r1(t)  r2(t)  are 6.00 Å and 5.28 Å.
The average momenta   p1(t)  p2(t) at large t positions are:
          B-C: 2.48
          A-B: 1.22
          A-C: 0.00
Trajectories from r1 = rts+δ, r2 = rts
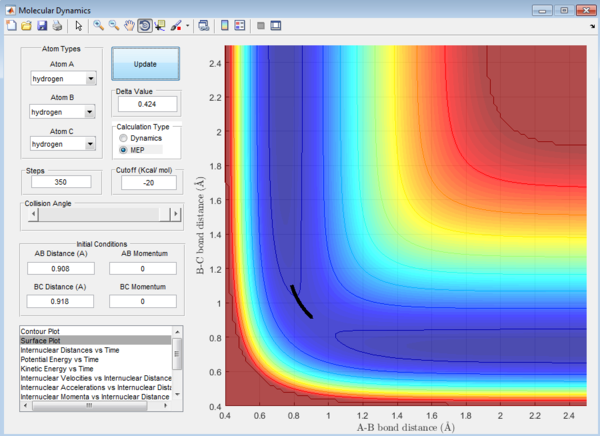
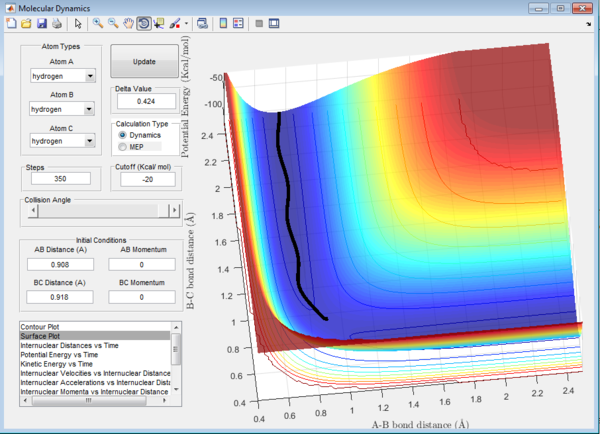
Question 3: In MEP calculation, the trajectory towards the product channel is seen only near the transition state. No vibration is observed.The energy is mainly translational. This is because in MEP calculations, inertia of the atoms are not taken into account and the velocity is set to zero in each time step. The velocity starts from zero, increases and returns to zero again. The reactants lose their momenta and that results in the small trajectory observed. In dynamic view, the trajectory extends all the way from the transition state to the product channel. The product is observed to have more vibrational energy. The inertia of the products are taken into account, thus the velocity is sustained for a longer path.
Reactive and unreactive trajectories
Question 4: Trajectory of the reaction with different value of momentum were investigated and the results are tabulated.
| p1 | p2 | Reactivity |
|---|---|---|
| -1.25 | -2.5 | reactive |
| -1.5 | -2.0 | unreactive |
| -1.5 | -2.5 | reactive |
| -2.5 | -5.0 | unreactive |
| -2.5 | -5.2 | reactive |
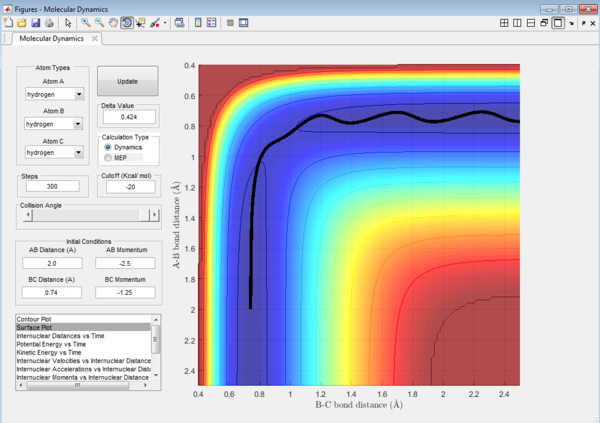
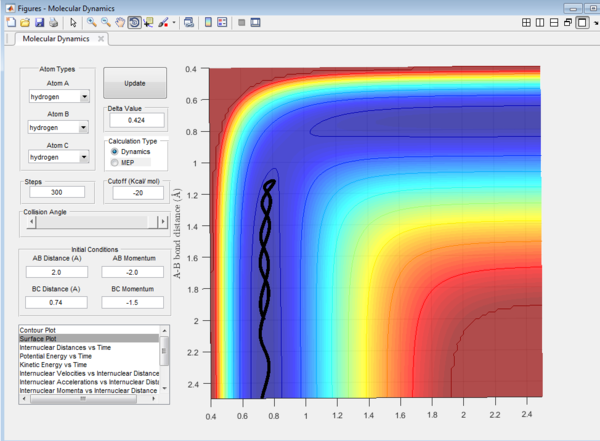
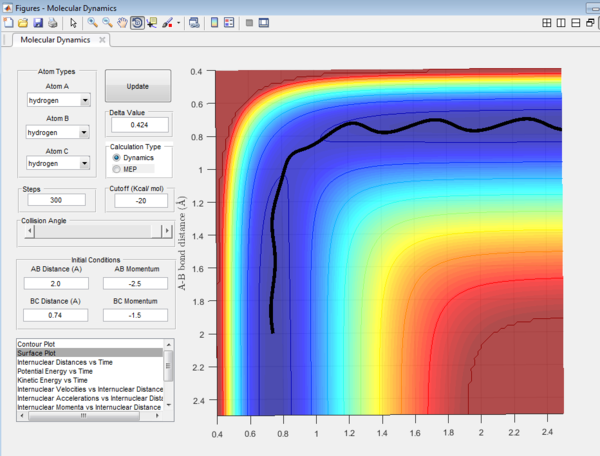
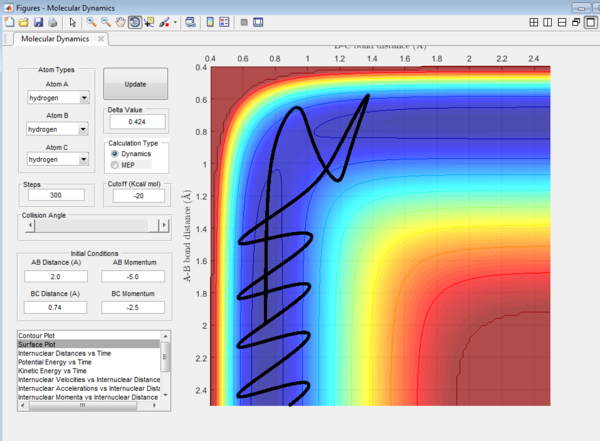
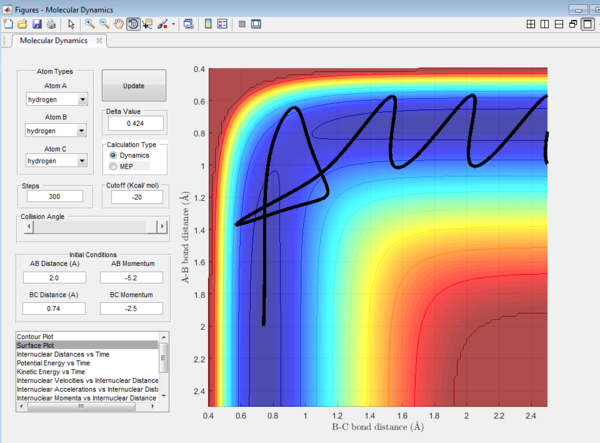
It could be seen from Figure 14 and Figure 15 that eventhough the total momentum in the last example is higher than the penultimate example, the reaction still goes to completion. This indicates that the total energy of a reaction only does not determine the reaction trajectory but the form of energy as well. In Figure 11, Figure 13 and Figure 15, the energy is largely translational and the reaction goes to completion. However, in Figure 12 and Figure 14, the energy is mainly vibrational and the reaction does not go through completion although supplied with very high kinetic energy. It can thus be deduced that H + H2 reaction is an exothermic reaction, as the translational energy promotes the formation of an early transition state. This conclusion however needs to be verified by observing reaction trajectories at different values of momentum and amount of vibrational energy and using more advanced methods.[1][2]
Question 5: The main assumptions of the transition state theory are as follow:
i- When the molecules occupy different energy levels, vibrational energy states for example,they obey the Boltzmann distribution. ii- The motion of the reactants or products obey classical mechanics, quantum tunneling does not occur. iii-Transition state theory assumes that once the transition state is reached, it must form products. iv- Rate of the reaction is dependent only on the transition state. v- The structure at the transition state is in quasi-equilibrium with the reactants
The third assumption of the Transition State theory (once the transition state is reached, it must form products) can be used to compare the predictions with experimental values.
The reactions with the first three set of momenta (Figure 11,Figure 12 and Figure 13) follow this assumption, the last two do not. It could be seen from Figure 14 and Figure 15 that after the transition state is reached, it is crossed again. This is not in agreement with the Transition State theory prediction which states that there is no recrossing of the transition state[3][4]
(how will Transition State Theory predictions for reaction rate values compare with experimental values? Lt912 (talk) 11:43, 12 June 2017 (BST))
F - H - H system
PES inspection
Question 6: The surface plots of the reactions are shown below:

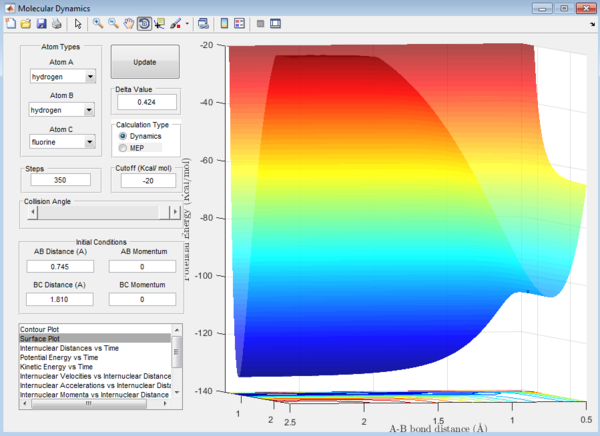
The bond strengths of the reactants and the products can also be used to determine whether a reaction is exothermic or endothermic. The enthalpy of the reaction can be determined from bond strengths using the formula,
ΔH = (energy needed to break bonds)- (energy needed to form bonds).
The strength of the bonds are as shown[5]:
H-F : 570 kJ/mol
H-H : 436 kJ/mol
The enthalpy of reaction for these molecules are then:
a) F + H2 ,
ΔH= 436-570
= -134 kJ/mol (exothermic)
b) H + HF
ΔH= 570-436
= +134 kJ/mol (endothermic)
Question 7: Approximate position of the transition structure of the reactions is as follow:
F + H2:
  H-F : 1.810 Å
  H-H : 0.745 Å
The transition state should be the same for H + HF reaction as it is just the reverse reaction of F + H2.
This is again determined by looking at the Internuclear distance versus Time plot which gives the straightest possible line.
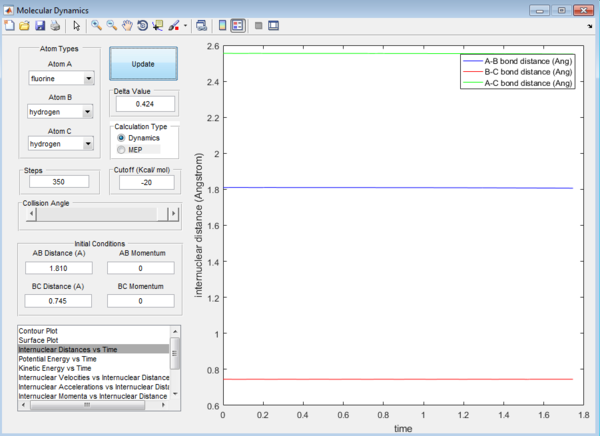
Question 8: The activation energy,Ea,of the reaction is the difference in energy between the reactants and the transition state. The respective values of these energies are determined from the surface plot as shown:
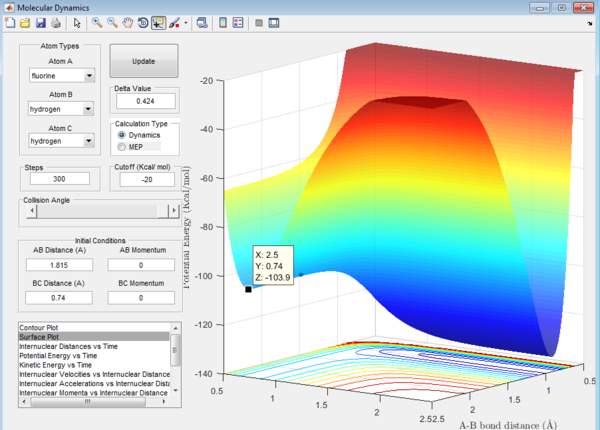

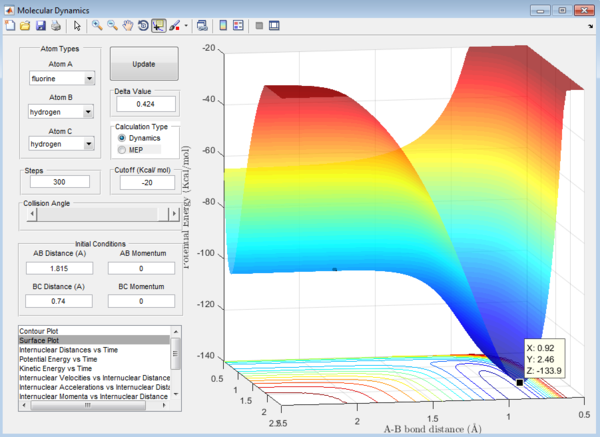
1. Ea of F + H2 reaction = -103.7-(-103.9)= 0.2 kcal/mol
Ea of H + HF reaction can be calculated from the surface plot of the F + H2 reaction as it is just a reverse of the reaction above.
2. Ea of H + HF reaction = -103.7-(-133.9)= 30.2 kcal/mol
Reaction dynamics
Question 9: The principle of conservation of energy states that energy cannot be created nor destroyed.Thus, the energy is converted from one form to another. Potential energy is converted into kinetic energy and vice versa. Kinetic energy consists of translational and vibrational energy. During a reaction, some of the translational energy can be converted into vibrational energy and vice versa .In an exothermic reaction, some of the potential and kinetic energy is converted into heat energy which is released to the surroundings. When the reaction is carried out in a closed system, the temperature change could be measured which could be related to heat energy absorbed or released.The temperature change could be measured using a thermometer and the heat released or absorbed can be calculated using appropriate equations such as H= mcϴ. The heat released or absorbed can be quantified using calorimetry methods also where ΔH value can be obtained and that indicates the total change in energy of the system. Vibrational energy gained or lost can be quantified using spectroscopy methods such as IR spectroscopy. The wavenumber,v,of the peaks on the IR spectrum can be related to the energy using the equation E=hv where h is the Planck's constant.Thus, from the energy values of the reactants and products, the energy of the excited state or amount of vibrational energy converted into other forms of energy or amount of energy converted into vibrational energy can be determined.
Question 10: The distribution of energy in the form of translation and vibration affects the efficiency of the reaction based on the position of the transition state. Polanyi's empirical rules can be invoked in explaining this where the rule states that vibrational energy promotes the attainment of a late transition state while translational energy promotes the attainment of early transition state. Thus, if a reaction has an early transition state, providing energy mainly in the form of transition will result in an efficient reaction because transition state is reached easily and products are formed. However, if the translation state is late and it is supplied with translational energy, the transition state attainment will be slow or not complete, resulting in a less efficient reaction.[2]
In this particular example, it could be seen from the surface plot that for the F + H2 reaction which is exothermic, when the energy is supplied has a large proportion of vibrational energy, the transition state state is reached,and then crossed again multiple times, showing that the reaction is inefficient. Energy might be lost to reorganise the structure of the molecule again and again.
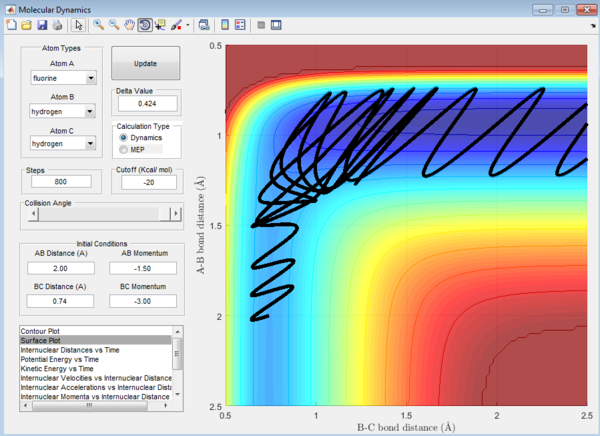
For the endothermic H + HF reaction, when the energy supplied is mainly translational, it could be seen again that the transition state is crossed again a few times before the product is formed. The reaction is thus less efficient.
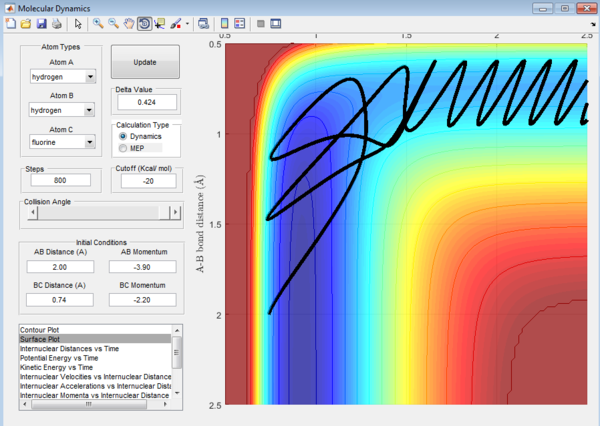
(The efficiency of the reaction relates more to the fact that a certain ratio of translational to vibrational energy is more likely to produce a successful reaction trajectory. This is unrelated to barrier recrossing. Lt912 (talk) 11:39, 12 June 2017 (BST))
References
- ↑ Zhaojun Zhang, Yong Zhou,† and Dong H. Zhang*,''Theoretical Study of the Validity of the Polanyi Rules for the LateBarrier Cl + CHD3 Reaction'', The Journal of Physical Chemistry Letters, American Chemical Society, 2012,3146
- ↑ Claire Vallance, ''Molecular Reaction Dynamics, Lectures 1‐4'', Chemistry Research Laboratory, University of Oxford, 2008, 14-16
- ↑ Keith J. Ladier, M.Christine King, ''The Development of Transition-State theory'', J.Phys.Chem. , 1983,'''87''', 2657-2664
- ↑ John W. Moore, Ralph G. Pearson, ''Kinetics and Mechanism'', Wiley-Interscience Publication, 1981, '''5''', 166-168
- ↑ Richard Myers,''The Basics of Chemistry'',Greenwood Press, 1951, '''3''',79
