MRD:JaliniKalaravy
Exercise 1ː H-H-H System
Q1ː On a potential energy surface diagram, how is the transition state mathematically defined? How can the transition state be identified, and how can it be distinguished from a local minimum of the potential energy surface?
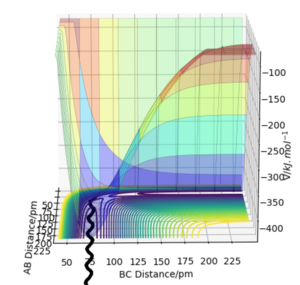
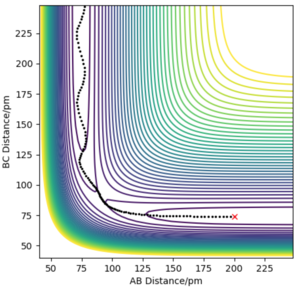
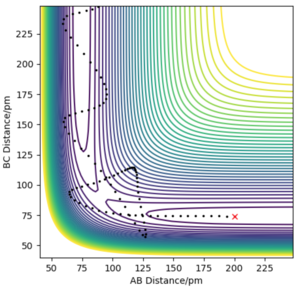
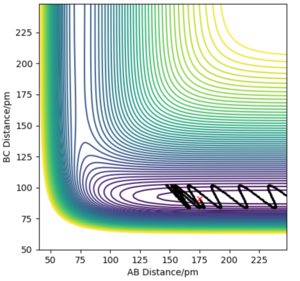
With regards to the potential energy surface diagram, the transition state is mathematically defined as the maximum on the minimum energy path linking reactants and the products. This is denoted as the maximum point of the potential energy line on the surface plot. This coincides with the minimum point on the kinetic energy curve. Since the transition state is a stationary point on the surface plot, by equating , the distance at which the transition state occurs can be calculated. It can be distinguished from local minima since it has the greatest value out of all minimaMathematically, it is distinguished from local minima by having a positive second derivative of potential energy in one direction and a negative one in an orthogonal direction. Pu12 (talk) 00:12, 27 June 2020 (BST) . Qualitatively, this can be seen by choosing a set of points where the transition state is believed to lie and analysing the motion of this trajectory. Where there is no trajectory (i.e. no maxima or minima), transition state has been found (as seen below). In the image above, the black solid line depicts the trajectory of molecules not at the transition state.

Q2ː Report your best estimate of the transition state position (rts) and explain your reasoning illustrating it with a “Internuclear Distances vs Time” plot for a relevant trajectory.
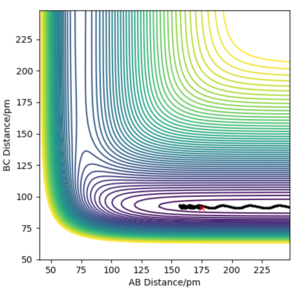
The image above arises from setting the momenta as 0 (since KE = 0 at transition state) and setting the AB and BC bond distance as 90.8 pm to give the force along AB and BC as -0.004 kJmol-1pm-1. Looking at the “Internuclear Distances vs Time” plot for this trajectory below, it can be seen that the AB and BC distances are constant as a result of the fact there are no forces acting on the them (). Thus, it can be deduced the transition state has been reached.

Q3ː Comment on how the mep and the trajectory you just calculated differ.
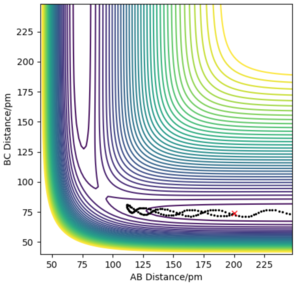
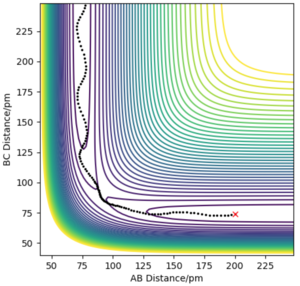
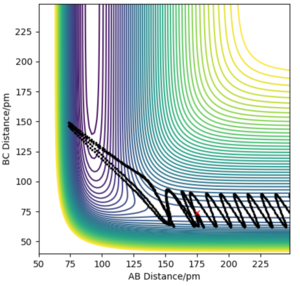
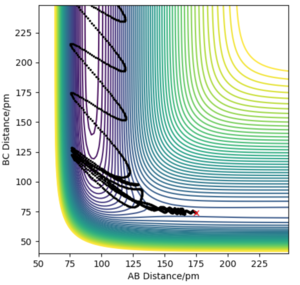
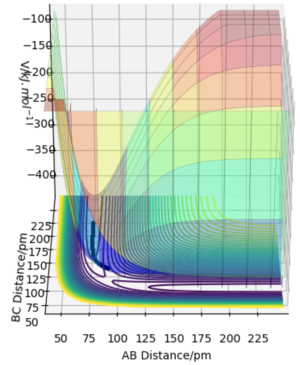
The minimum energy path (mep) is a trajectory corresponding to infinitely slow motion. In this trajectory, the momenta/velocities are always reset to zero in each time step. In this case, the trajectory simply follows the valley floor to H1 + H2 - H3 . Though useful in characterising a reaction, the mep does not give a realistic account of the motion of atoms during a reaction since oscillation of potential energy of H atoms is not considered. By altering the trajectory from the transition state (ts) value to r1 = rts+δ, r2 = rts, the mep reaction path and 'Dynamics' reaction path can be compared. In the table below, r1 = 90.8 + 1 pm, r2 = 90.8 pm.
| mep | Dynamics |
|---|---|
 |
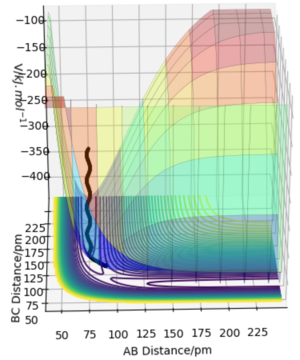 |
Comparing the 2 trajectories above, it can be seen the 'Dynamics' trajectory takes into consideration the ever-changing motion of atoms due to their oscillations as a result of the vibrational energy atoms possess. This can be seen from the solid black wavy line. On the other hand, in the mep trajectory, these oscillations cannot be seen as such making it a less accurate account of the motion of atoms.Good. Pu12 (talk) 00:12, 27 June 2020 (BST)
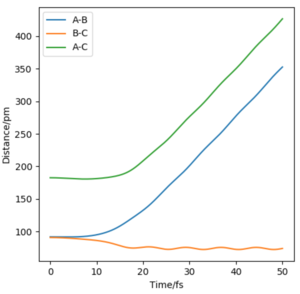
Now considering the “Internuclear Distances vs Time” and “Momenta vs Time” plots and how these change when r1 = rts+δ, r2 = rts (i.e. r1 = 90.8 + 1 pm, r2 = 90.8) and r1 = rts, r2 = rts+δ (i.e. r1 = 90.8 pm, r2 = 90.8 + 1 pm), the the graphs below are seen. In the first case where r1 = rts+δ and r2 = rts, the AB molecule is formed whereas in the second case, the BC molecule has formed. When the position of the transition state is slightly changed, the state moves to one of the product valleys where it is more stable. In the first case this manifests as the AB molecule while in the second case it's the BC molecule.
| Graph Type | r1 = rts+δ, r2 = rts | r1 = rts, r2 = rts+δ |
|---|---|---|
| Internuclear Distances vs Time | 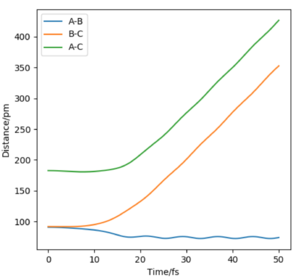 |
 |
| Momenta vs Time | 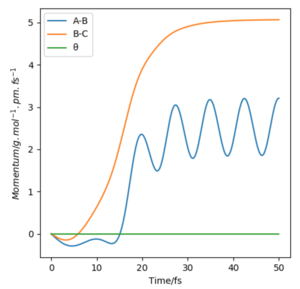 |
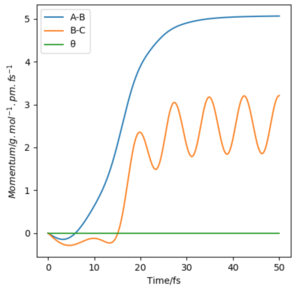 |
The final values of the positions of r1(t) and r2(t) were found when t is large (i.e. t = 200). In the case where r1 = rts and r2 = rts+δ, r1(t) = 74.5 pm and r2(t) = 1476 pm, p1(t) = 2.6 gmol-1pmfs-1 (from midpoint of oscillating curve) and p2(t) = 5.1 gmol-1pmfs-1. When a new calculation is carried out whereby the final positions recorded are set as the initial positions and momenta reversed, the trajectory reversing and returning back to the original position is observed most likely due to not having enough energy to overcome the energy barrier.
Q4ː Complete the table by adding the total energy, whether the trajectory is reactive or unreactive, and provide a plot of the trajectory and a small description for what happens along the trajectory. What can you conclude from the table?
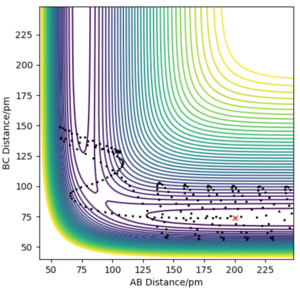
The penultimate set of conditions illustrates a case of barrier recrossing. The system crosses the transition state region, you should see the bond in the product actually forms (see “Animation”) but then the system reverts back to the reactants.
Q5ː Given the results you have obtained, how will Transition State Theory predictions for reaction rate values compare with experimental values?
Transition state theory rationalises and calculates the rate of chemical reactions based on the properties of the reactants and the transitions state structure. Transition state theory assumes 3 (Main) Pu12 (talk) 00:12, 27 June 2020 (BST) factorsː
1. There are no multiple crossings of the dividing surface at the transition state.
2. The concentrations of activated complexes may be calculated using equilibrium theory.
3. The motion of the system over the col in the potential-energy surface can be separated out from all the other motions.
Conventional transition-state theory counts all trajectories showing different ways of crossing the transition state barrier as contributing to reaction, but this is not the case since only the trajectories where the reactants directly become the products contribute to the reaction. Because of these recrossing effects, conventional transition-state theory predicts a too high observed experimental rate. To mitigate this error, TST expression is multiplied by the transmission coefficient (kappa). Error arises in the 3rd assumption due to the fact that motion is not classical but rather, quantised. This raises the issue of the possibility that the system may tunnel through the potential-energy surface1. Assuming quantum tunnelling occurs, the observed experimental rate will increase. It should be noted that with heavier species (than H or D), even with deuterons, tunnelling is negligible. Overall, the assumption of having no multiple crossings of the dividing surface at the transition state contributes more to the deviation seen from the conventional transition state theory. This is because quantum tunnelling effects become negligible for larger atoms that H and D.
Exercise 2ː F-H-H System
Q1ː By inspecting the potential energy surfaces, classify the F + H2 and H + HF reactions according to their energetics (endothermic or exothermic). How does this relate to the bond strength of the chemical species involved?
For the FHH system, the surface is no longer symmetric and as such, in order to determine whether a reaction is exothermic or endothermic, which side of the ʏ=x line the position of the maximum lies on should be looked at. For F colliding with H2, the transition state occurs early and it can be clearly seen that the reactants are at a higher energy level than the products. Therefore the reaction of F and H2 is exothermic.
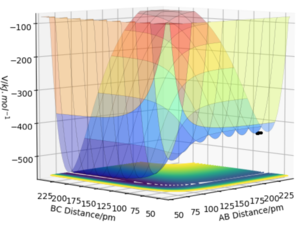
For H colliding with HF, the transition state is seen later and the reactants are clearly at a lower energy level than the products. Therefore this reaction is endothermic

Given that an endothermic reaction requires energy to be inputted into the system in order for bond cleavage, it can be deduced that the H-F bond is stronger than the H2 bond. This is supported by the fact that F is a highly electronegative element and as such, there is a strong attraction between the partial negative charge on the F and partial positive charge on the H to form a strong covalent bond. The H-H molecule has no associated polarity and is therefore weaker.
Using the program, the H2 bond energy was 435.056 kJ/mol which is in agreement with the literature value of 4362. The H-F bond energy was 560.402 kJ/mol which is also in agreement with the literature value of 565 kJ/mol2.
Therefore for the following reactionsː
H + HF → H2 + F Enthalpy change = 560 - 435 = +125 kJ/mol
F + H2 → H + HF Enthalpy change = 435 - 560 = -125 kJ/mol
Q2ː Locate the approximate position of the transition state.
The position of the transition state was found by locating the distances AB and BC whereby the forces acting on them were equal to 0. This is because the transition state is mathematically defined as the stationary point given as dV/dr = 0. The point where the transition state lies should also have both 1 positive and 1 negative Hessian eigenvalue values as well as 3 straight lines on the "intermolecular distance vs time" graph. Using Hammond's Postulate, since the reaction between H and HF is exothermic, the transition state will closely resemble the structure of the reactants. Therefore the distance between the reactants and transition state will be closer than the distance with the products. The values found for the reaction of F and H2 areː
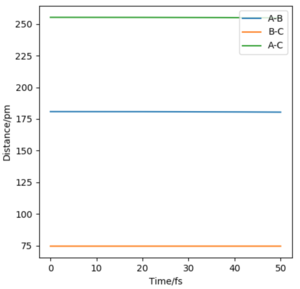
AB = 180.8 pm
BC = 74.5 pm
Since the reactions of H and HF are just the reverse of the F and H2 reactions, it can be concluded that the position of the transition state will have the same value but switched around. Also from Hammond's Postulate, the transition state of the endothermic reaction between F and H2 will resemble the products and therefore the distance between the position of the transition state and product will be closer. The position of the transition state for the reaction of H and HF isː
AB = 74.5 pm
BC = 180.8 pm
At a transition state, the energy is a maximum and so the curvature must be negative in one direction yet positive along all the others. Therefore, in order for a stationary point to be a transition state, the Hessian matrix at this stationary point must have one negative eigenvalue3. The internuclear distances of AB and BC must be constant at the transition state which is seen at these distancesː
Good. Pu12 (talk) 00:12, 27 June 2020 (BST)
Q3ː Report the activation energy for both reactions.
The activation energy is given as the energy difference between the transition state and the energy of the reactants4.

For the reaction between H and HF, the transition state energy is 433.981 kJ/mol and the energy of the reactants is 435.056 kJ/mol. therefore the activation energy isː
435.056 - 433.981 = 1.075 kJ/mol
For the reaction between F and H2, the transition state energy is 433.981 kJ/mol and the energy of the reactants is 560.402 kJ/mol. therefore the activation energy isː
560.402 - 433.981 = 126.421 kJ/mol
This supports Hammond's Postulate whereby in an endothermic reaction, the energy of the transition state will more closely resemble that of the products and therefore will have a higher energy transition state than for F and H2 which is exothermic and will have a smaller value due to the earlier TS.
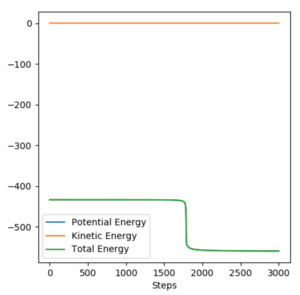
Performing a mep with 3000 steps from a structure neighbouring the transition state closer to the reactants helped to find a reasonable estimate of the activation energy. Given that a mep shows an infinitely slow trajectory (i.e. with no kinetic energy), the molecule will fall into the reactants potential well on the left side of the transition state, corresponding to the energy of the reactants. The energy difference (depicted as a drop in the graph below) is the activation energy.
Q4ː In light of the fact that energy is conserved, discuss the mechanism of release of the reaction energy. Explain how this could be confirmed experimentally.
The set of initial conditions chosen resulting in a reactive trajectory for the reaction between F + H2ː r1 = 175 pm, r2 = 74 pm, p1 = -1.6 gmol-1pmfs-1 and p2 = 0.5 gmol-1pmfs-1.
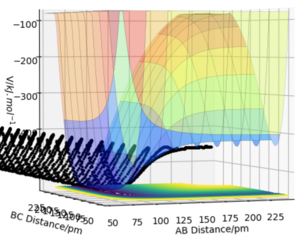

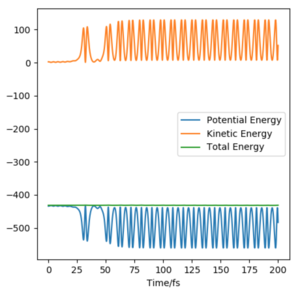
Given that energy is conserved, this can be seen in the momenta vs time plot. The potential energy of the reactants is converted to solely kinetic energy of products in the form of vibrational energy You can also see a small change in translational energy on this plot. You could detect this as temperature in a calorimeter. Pu12 (talk) 00:12, 27 June 2020 (BST) . The oscillation of the molecule is due to the vibrational contribution of the kinetic energy and this is seen in the momenta plot. The momentum of H-H is seen to be transferred completely to the H-F bond and thus causing it to oscillate too. Not only that, H-F is seen to have a greater oscillatory motion. From the surface plot, it is clear that once the transition state has been reached, the new HF molecule formed possesses a much greater vibrational energy contribution as indicated by the large amplitude of oscillation compared to the incoming molecule. This is because H-F is a stronger bond that H-H so will vibrate faster. The vibrational frequency of a vibrating two-body system depends on both the force constant and the reduced mass of the system5 whereby the force constant is dependent on the strength of the bond. Since the vibration of the product molecule has changed, this can be experimentally measured.
For a molecule in a vibrationally excited state (i.e. the H-F product), where there are electrons in the ground state and first excited state, 2 types of transition are possible (i.e. from 0 → 1 and from 1 → 2). As such, there will be 2 peaks in the infrared spectrum. Anharmonicity describes that the energy level between 1 → 2 is smaller than 0 → 1 so the 1 → 2 overtone will be at a lower wavenumber and less intense as time goes on unlike the intensity of the fundamental which will increase with time. This is how we can look at the mechanism of energy release experimentally. It is also known that transitions between the ground state and excited states emit infrared radiation in a process called fluorescence. For the products, the absorbance spectrum is expected to have 2 peaks due to the absorbance of light in order to promote electrons from 0 → 1 and from 1 → 2 as well as 2 peaks in the emission spectrum corresponding to the electrons shifting back down.
Q5ː Discuss how the distribution of energy between different modes (translation and vibration) affect the efficiency of the reaction, and how this is influenced by the position of the transition state.
Reaction dynamics of F + H2 when rFH = 175 pm and rHH = 74 pm (note all momentum values given in gmol-1pmfs-1). If we compare 2 reactions of F + H2 with the same initial positions but different momenta such that one system will have greater translational energy in the reactants and the other, greater vibrational energy in the products, then the effect of transition state position can be investigated on the method of excess energy deposition. In F + H2, when pHH has a large value then the molecule posses a lot of vibrational energy. When pHH has a small value, it has more translational energy than vibrational.
If the same process is repeated for the reaction between H + HF with the same initial conditions, whereby the reactants are tested with having a lot of vibrational energy and then more translational energy. Noteː rHH = 175 pm and rHF = 91 pm ː
The extent of how much of the reactant energy type gets channelled in the same form for the energy type of the products depends on the features of the potential energy surface. In general, the excess energy released in a reaction usually is of the same type as in the reactants I am not sure if this is necessarily true, please reference specific chapters when you reference a book. Pu12 (talk) 00:12, 27 June 2020 (BST) . If a reactant has translational energy in excess of the energy needed to overcome the activation barrier, then this energy will be channelled into the translation and rotation of the products6. Excess vibrational energy contributes to the products vibration. In an exothermic reaction, the transition state occurs earlier in the entrance valley in the potential energy surface and will therefore be promoted preferentially by initial translational excitation. Therefore there is preferential release of energy in translational excitation in an exothermic reaction. This is what occurs in the reaction between F and H2. By contrast, for H and HF (an endothermic reaction), the reverse occurs. For reactions with late barriers in the product valley, they will be promoted preferentially by reactant vibrational excitation. This summarises Polanyi's rules and shows how important the position of the transition state is when determining the type of kinetic energy that will promote a reaction.
It can be seen from these results that for an exothermic reaction (F + H2) where the transition state occurs earlier the reaction gets promoted when the reactants have less vibrational energy. Contrary to this, for an endothermic reaction (H + HF) where the transition state occurs later, the reaction gets promoted when the reactants have more vibrational energy.
Bibliography
1. K. J. Laidler, Chemical kinetics, Harper & Row, New York, 1987.
2. https://ch301.cm.utexas.edu/section2.php?target=thermo/thermochemistry/enthalpy-bonds.html [accessed 21/05/20]
3. https://www.q-chem.com/qchem-website/manual/qchem43_manual/sect0076.html [accessed 21/05/20]
4. https://www.tuttee.co/blog/chem-energetics [accessed 22/05/20]
5. https://www.khanacademy.org/science/organic-chemistry/spectroscopy-jay/infrared-spectroscopy-theory/v/bonds-as-springs [accessed 22/05/20]
6. P. G. Ashmore and R. J. Donovan, Gas Kinetics and Energy Transfer: Volume 3, Royal Society of Chemistry, Cambridge, 2007.

