MRD:JakePetersY2
Molecular Reaction Dynamics
In this experiment, the transition state of the reaction between H-H and F was investigated. From this, the shortcomings of transition state theory was found and Polanyi's rules were visited. It was found that the correct balance of vibrational and translational energy is required for the transition state to be passed
H-H + H
where A-B + C => B-C + A
Surface plots, saddle points and the transition state
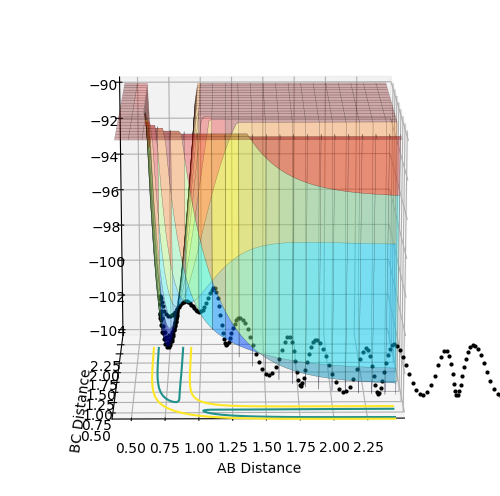
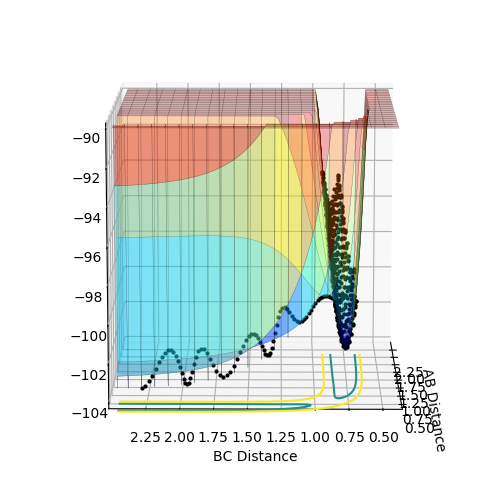
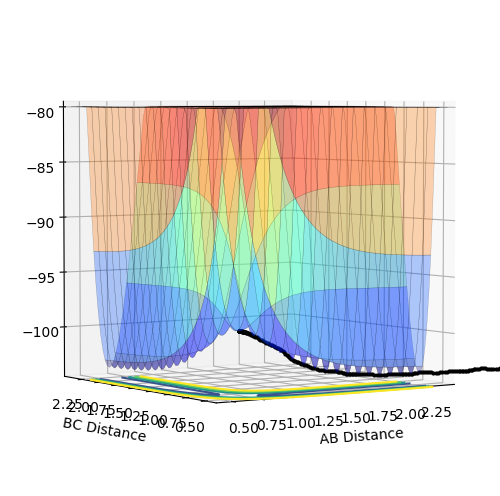
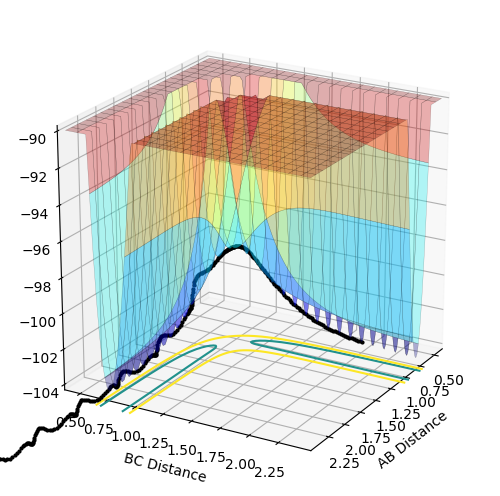
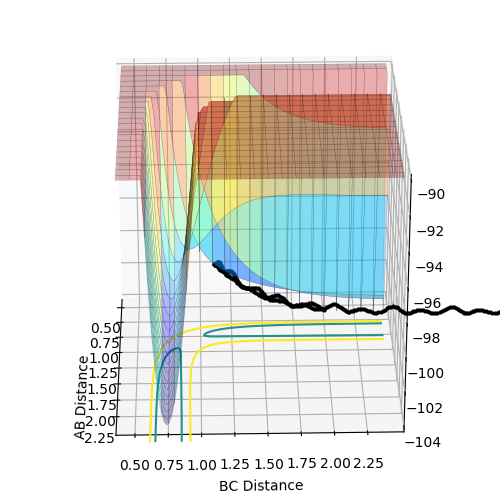
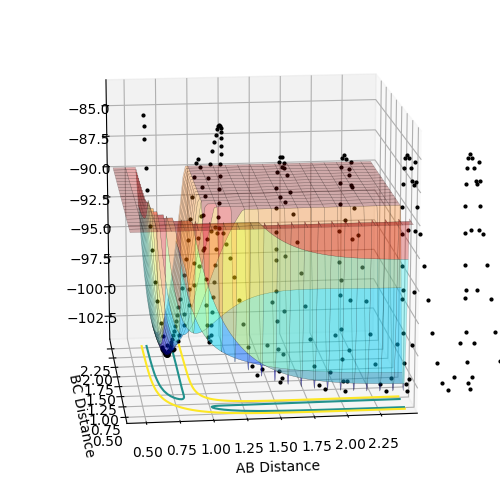
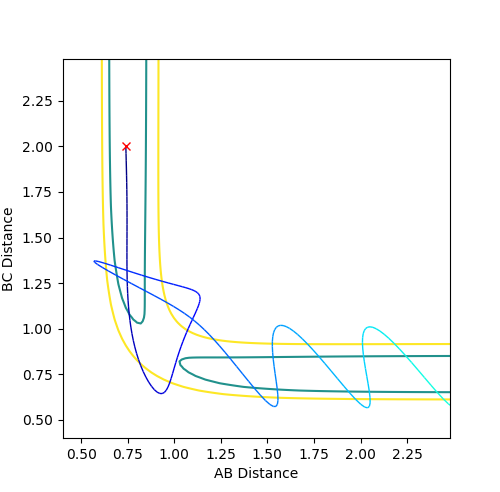
The above diagrams show the surface plot for the reaction.
The above diagram shows the saddle point of the potential energy surface.
At a transition state (saddle point) and a minima, ∂V/∂r1 and ∂V/∂r2 = 0. If the second derivative is greater than zero, then the stationary point is a minima, if the second derivative is negative, it is a maxima. If the second derivative is equal to zero, then the point could be a maximum, minimum or a saddle point. In such a case, the following equation must be evaluated. Where fxx refers to the second partial derivative with respect to x, fxy refers to the second differential with respect to x and y, and fyy is the second derivative with respect to y.
D=fxx * fyy - fxy2 http://tutorial.math.lamar.edu/Classes/CalcIII/RelativeExtrema.aspx
if D<0 then the point is a saddle, if D>0 and fxx>0 then the point is a maxima, and if fxx<0 then it is a minima. If D=0, then other techniques must be used to determine the nature of the point.
Adjusting the internuclear distance to find the transition state.
The physical interpretation of the transition state is that the bond lengths are constant and there is no oscillations within the atoms and molecules. Thus by adjusting the values of internuclear distances until a line of gradient=0 is achieved, the bond lengths at the transition state may be found. as the distance between two sets of atoms becomes closer as they interact whilst the other one diffuses further away infering that reactants or products form. At the transition state, RAB=RBC.
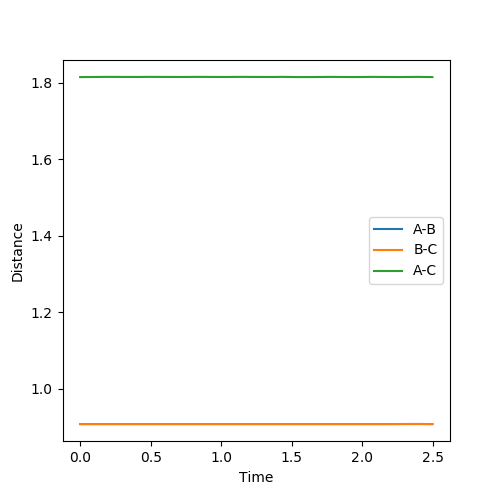
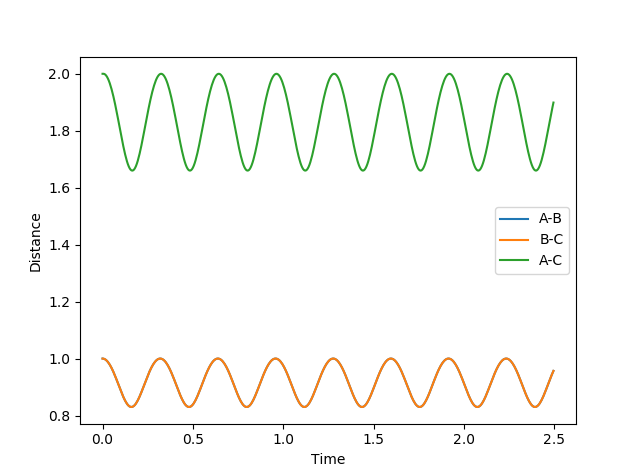
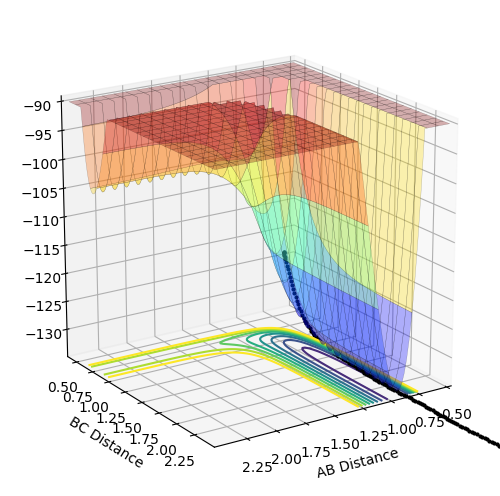
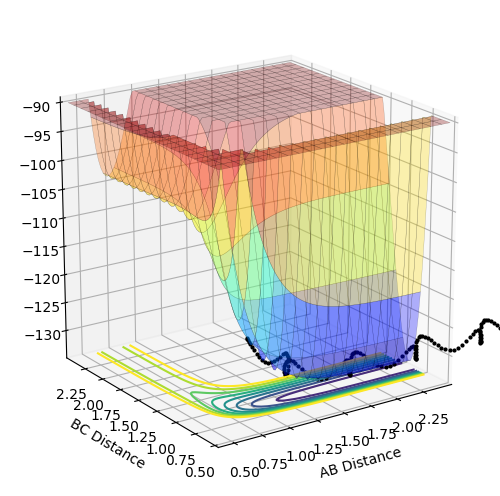
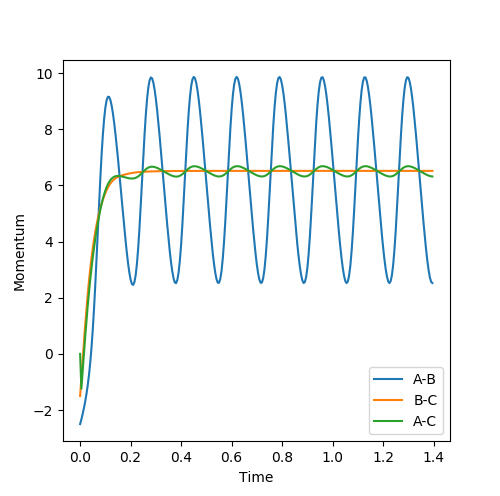
The best approximation for the transition state is where: RAB=RBC=0.9076 and where p1=p2=0. (Diagram on the left) At these values, there are no oscillation in the lines BC and AC indicating that the distances are directly on the transition state since there is no vibrational energy to oscillate. Compare this to the other diagram on the right where RAB=RBC=1 where there are oscillations.
The MEP pathway on the right shows a smooth path (of black dots) since at each step the atoms have no motion and thus will not oscillate. The Dynamic pathway on the left shows a more jagged pathway due to atoms oscillating.
for r1=rts and r2=rts+0.01: rAB=9.984 rBC= 0.760, pAB= 2.481, pBC= 1.300 for r1=rts+0.01 and r2=rts rAB = 0.756 RBC= 9.984 pAB= 1.300 pBC= 2.481 These results just show that by swapping the distances (AB and BC), the results are just reversed since atoms A B and C are equal.
By using the final calculated values and just setting the momenta negative, the values all readjust to the values of the optimised transition state of distances 0.9076 Å and p=0. althought rBC is slightly longer at 0.9178 Å
Reactive and Unreactive trajectories
Transition State Theory
The transition state theory says that a molecular collision that leads to a reaction must pass through the transition state. This theory assumes that once the system passes the transition state, it cannot go back on itself. This is seen to be incorrect in terms of trajectory 4 which passes the transition state and yet goes backwards to reform the reactants. The second assumption is that the energies of the reactants follow the Boltzmann distribution. This assumption is only valid when the system has had time to equilibrate across the accessible states. At a higher temperature, higher vibrational states will be populated and thus there will be a shifted distribution in states. (https://www.sciencedirect.com/topics/chemistry/transition-state-theory) The transition state theory states that the Born-Oppenheimer approximation is true such that vibrational and electronic motion can be seperated (which often isn't true due to spin-orbit coupling and other effects.) At the transition state, kinetic energy can be treated classically and separately from other forms of motion.
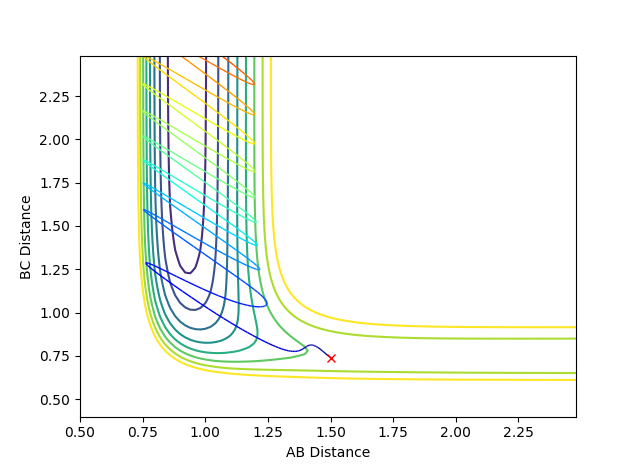
For the first 3 trajectories, the rates predicted by transition state theory will be comparable to the results obtained. However for the fourth trajectory, the actual rate will be significantly lower than that predicted by transition state theory since the reactants can actually reform whereas according to the theory they cannot once the transition state has been passed. In the fifth trajectory recrossing does occur and so the rate of product formation will be reduced, however product will still be formed.
F - H - H System
Where Reaction (1) A + BC -> AB + C F + H2 -> HF + H For the initial conditions provided, F + H2 is an exothermic reaction since the total energy is negative as the products are lower in energy than the reactants. As seen in the surface plot below.
For Reaction (2) H + HF -> F + H2
A + BC -> C + AB
This reaction endothermic since it the surface plot below shows that the reaction is "uphill" and the products are higher in energy than the reactants. Ontop of this, the H-F bond is very strong compared to H-H and thus it would be an uphill process according to bond enthalpies.
F - H - H Transition state
F + H2 -> HF + H Transition state (1)
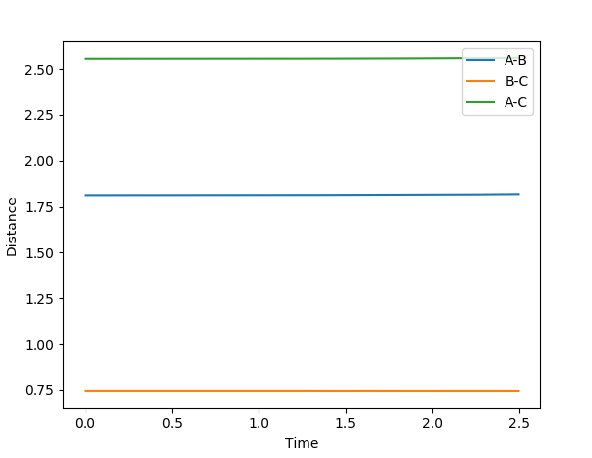
The transition state For reaction (1) occurs approximately where F-H (AB) = 1.811 Å and H-H (BC) = 0.745 Å. This occurs when the lines have a gradient of 0 such that the bond lengths are constant over the time interval and there is no oscillation. By looking at the surface plot, the transition state is closer in energy to the reactants where BC is shorter and thus is an early transition state.
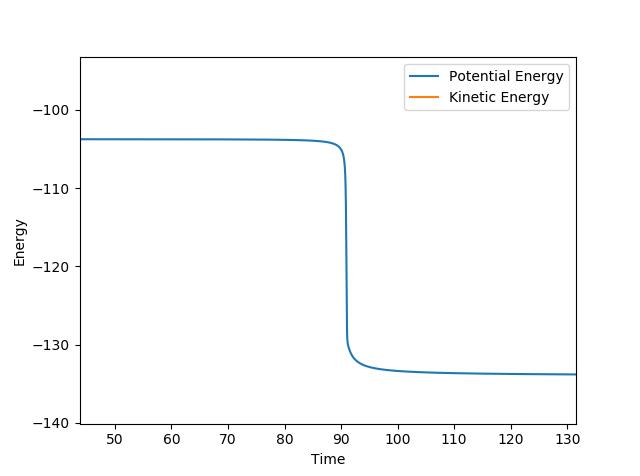
The energy of the transition state for reaction (1) is approximately 30.3 kcal mol-1 using the diagram below and subtracting the energy from the initial and final state where the difference is the activation energy.
H + HF -> F + H2 Transition state (2)
Reaction (2) logically has the opposite bond distances since atoms A and C are swapped over. The internuclear distance diagram confirms this. F-H (BC) = 1.811 Å and H-H (AB) = 0.745 Å
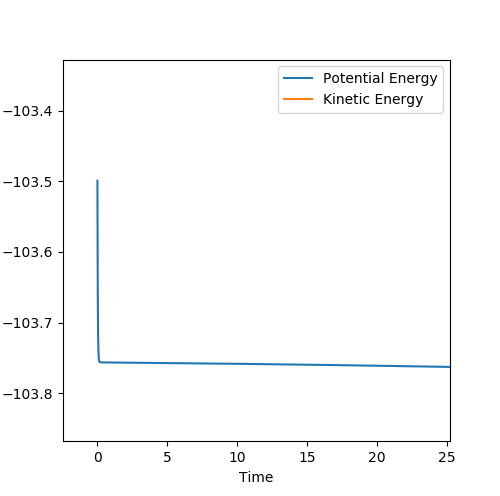
The transition state energy approximately 0.26 kcal mol-1. By looking at the surface plot, the transition state is closer in energy to the products where AB is shorter and thus is an late transition state. So by adjusting the distance so that it is closer the the actual AB bond length and increasing the BC distance, the transition state was found. Whilst this is a simple method, it gained a very close value to that predicted by finding the difference between the transition state and the energy of the products at a distance such that AB and C cannot interact.
Reaction Dynamics
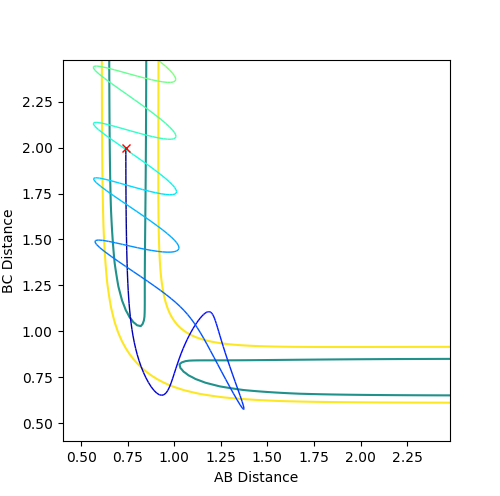
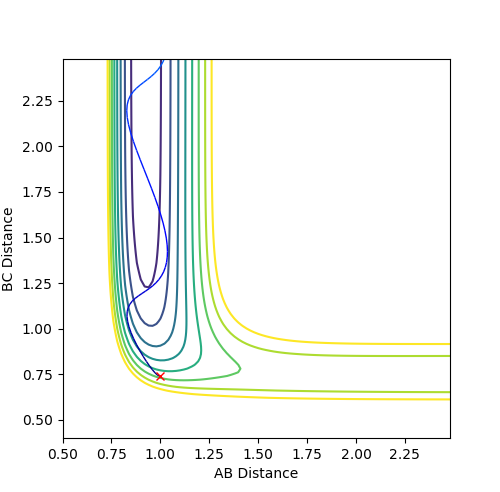
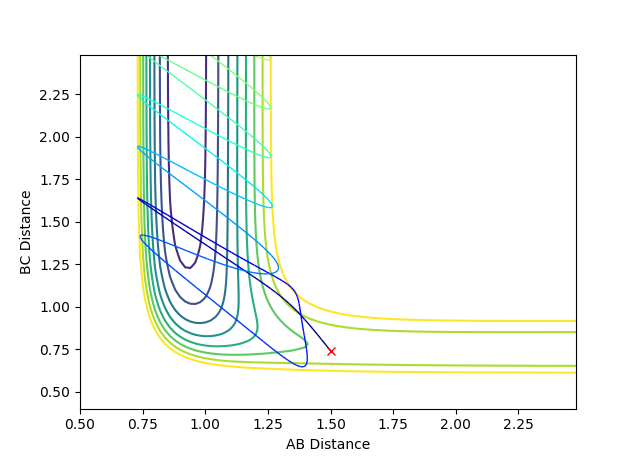
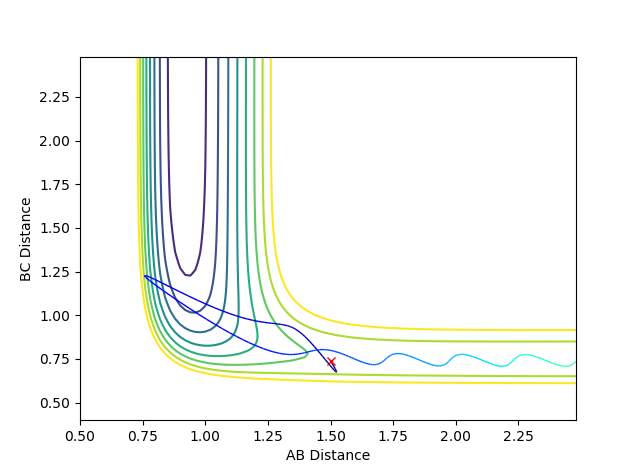
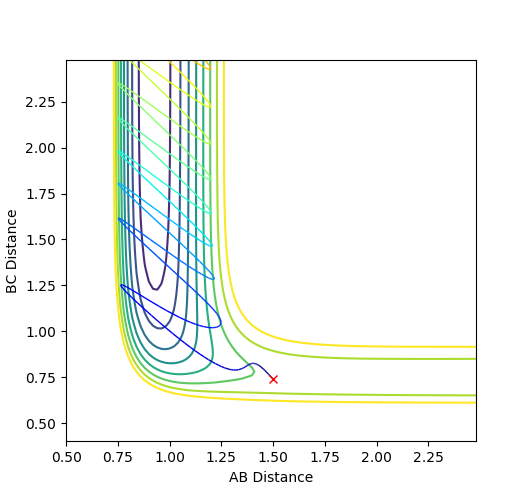
Where the initial conditions are RAB=1 and RBC=0.74 and AB momentum =-2.5 and BC momentum =-1.5 a reactive trajectory is found. by looking at the contour plot on the left, the trajectory ends where products are hence its reactivity.
The mechanism for energy transfer is potential energy to excited vibrational and translational modes within the products, the existence excited vibrational states can be confirmed experimentally using FTIR spectroscopy. The relative population of higher vibrational and translational modes will depend on the proportions of potential energy converted to vibrational and translational energy. As to be discussed later, this depends on whether the transition state is early or late (Hammond's postulate) and can be determined by Polanyi's emperical rules.
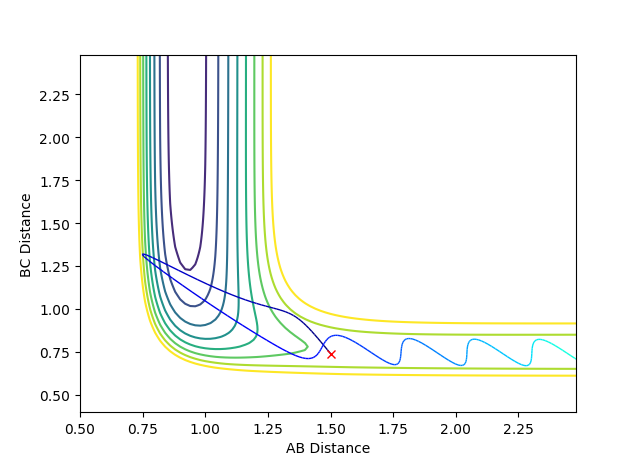
For pFH=-0.8 and pHH=0.1, the energy of the system is reduced substantially such that product forms and stays as product without being converted back to reactant, as seen in the contour plot below.
H + HF
where RHH=1.5 and RHF=0.74
The correct balance of translation and vibrational energy from the initial momenta allows or does not allow a reaction. The proportions of energy needed depends on the position of the transition state.
Polanyi's empirical rules
Through simulation of the reactions above, Polanyi noted that an early transition state favours vibrational excitation of the product and that a late transition state leads to low vibrational excitation. This can be seen since in the first scenario which is exothermic, energy is released while the A-B distance (bond length) is changing. For the endothermic case, the energy is only released after the AB bond is formed and the increase in the BC distance corresponding to separation of products is translational energy.
To pass an early transition state, translation energy is more effective to cross the barrier and form product. In the case of a late transition state, vibrational energy is best to overcome the barrier. With the wrong proportions of vibrational and translational energy for the transition state, the reactant will hit a repulsive wall in the potential surface and bounce back to reactant.
The energy distribution across modes can be found by using IR spectroscopy when particles in the system are in the gas phase for the whole reaction. By increasing the translational energy, there are more collisions and thus a higher pressure within the reaction vessel. The formation of vibrational excited states will lead to emission of IR radiation when these states relax and thus can be detected by FTIR spectroscopy.
chapter 10 of J. I. Steinfeld, J. S. Francisco, W. L. Hase Chemical Kinetic and Dynamics Prentice-Hall

