MRD:Ja1915 Physical
EXERCISE 1: H + H2 system
What value does the total gradient of the potential energy surface have at a minimum and at a transition structure? Briefly explain how minima and transition structures can be distinguished using the curvature of the potential energy surface?
A minimum and a transition structure are stationary points on the potential energy surface. A minimum on the potential energy surface represents the lowest energy state of the molecule in that trajectory. A transition structure is located at a point known as a saddle point because its constitutes a maximum in the potential energy surface along the minimum energy path.
Due to the fact they they are both stationary points, their first derivatives will be zero. Therefore to distinguish between each point, the second derivative of the potential energy surface at this point can be used. For a minumum, the second derivative will be bigger than zero. For a saddle point, the second derivative will be equal to zero.
Report your best estimate of the transition state position (rts) and explain your reasoning illustrating it with a “Internuclear Distances vs Time” screenshot for a relevant trajectory.
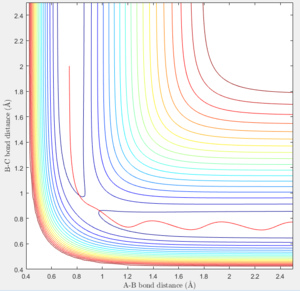
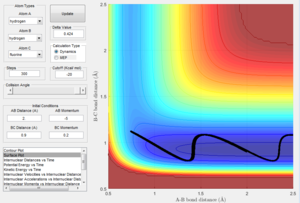
The best estimation of the transition state position was found to be: rts = 0.9077 Å. This was located by identifying the maximum on the potential energy surface along the minimum energy path of the reaction. The plot of internuclear distance can also confirm the position of the transition state position. Any internuclear distance that does not correlate to the transition structure will show a gradient as the bonds move closer/further away. At the transition structure, the internuclear distance will not change with time because the transition structure is at the highest potential energy of the reaction where the reaction is not going in any direction. The location of the transition state was therefore confirmed by observing if the internuclear bond distance changed with time. As can be seen in figure 1, the internuclear bond distance does not change and therefore this point can be regarded as the transition state.

Comment on how the mep and the trajectory you just calculated differ.
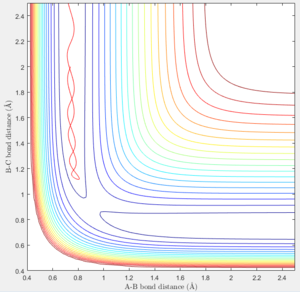
The mep is the minimum energy path where atom A is moving away from the diatom B-C. The MEP calculation type is where the program sets the velocity to zero in each step and so A can only travel along pathways that have negative or zero gradients because the atom has no momentum to push the atom on trajectories with positive gradients. As a result, the atom will move along the minimum energy pathway possible. Therefore it can be seen in Figure 2 that once the optimum internuclear distance was reached, the energy does not change with time. This is because once the lowest energy point was reached, as the atom has no momentum, the molecule can't move along a trajectory with a positive gradient and it can't travel to a lower energy as this has already been reached. This is also seen in figure 5 where because the velocity is set to zero, the kinetic energy is always zero.
(With a gradient of zero, it won't move. Tam10 (talk) 15:55, 22 May 2017 (BST))
However in Figure 3 (which displays the dynamic representation of this process) the potential energy is oscillating after optimum internuclear distance has been reached. In the dynamic calculation type, the program gives momentum to the atom therefore even after it has reached the minimum energy, the excess velocity of the molecule translates into the bond vibrating which is why potential energy is oscillating after optimum internuclear distance has been reached. This is also seen in figure 6 where the bond reaches optimum bond length and then the momentum causes the bond to vibrate, as seen by the fluctuating kinetic energy.
Look at the “Internuclear Distances vs Time” and “Internuclear Momenta vs Time”. Take note of the final values of the positions r1(t) r2(t) and the average momenta p1(t) p2(t) at large t.
Internuclear Distances vs Time:
Final values of the positions r1(t) r2(t): 4.666 and 0.7451
Internuclear Momenta vs Time:
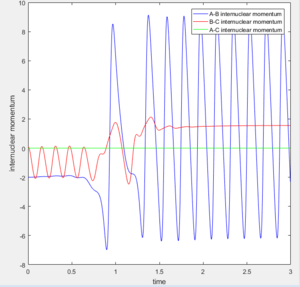
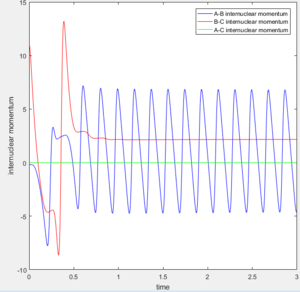
Average momenta p1(t) p2(t): p(1) = 2.485 and p(2) = 1.512
Figure 2 displaying MEP calculation type of reaction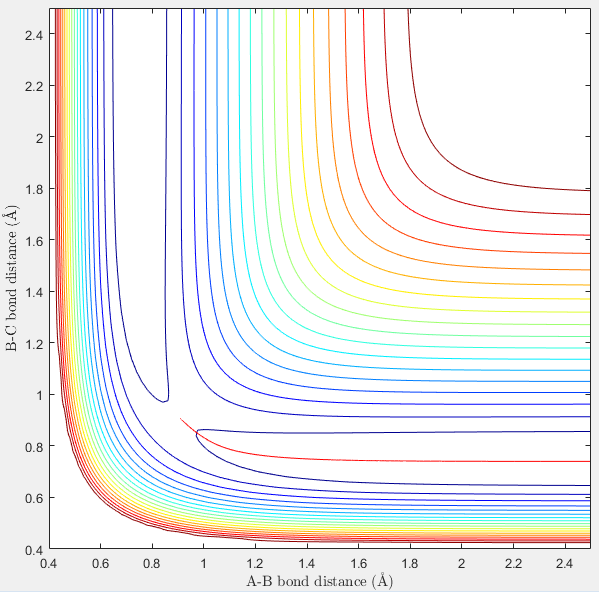 |
Figure 3 displaying Dynamic calculation type of reaction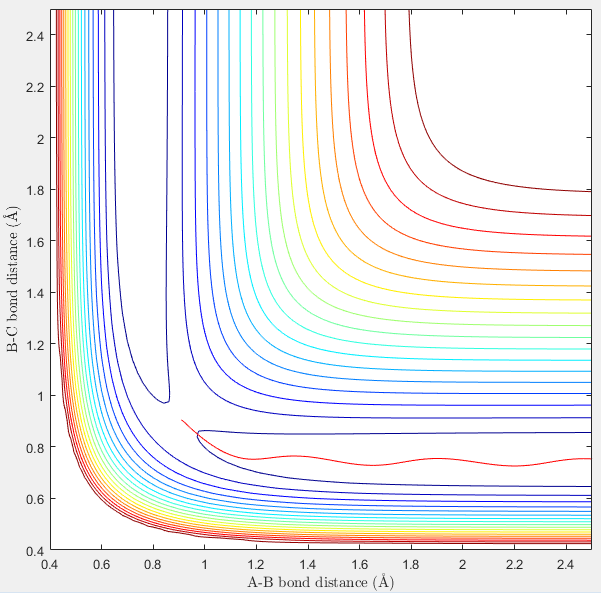 |
Figure 4 displaying Kinetic Energy vs Time plot for MEP calculation |
Figure 5 displaying Kinetic Energy vs Time plot for Dynamic calculation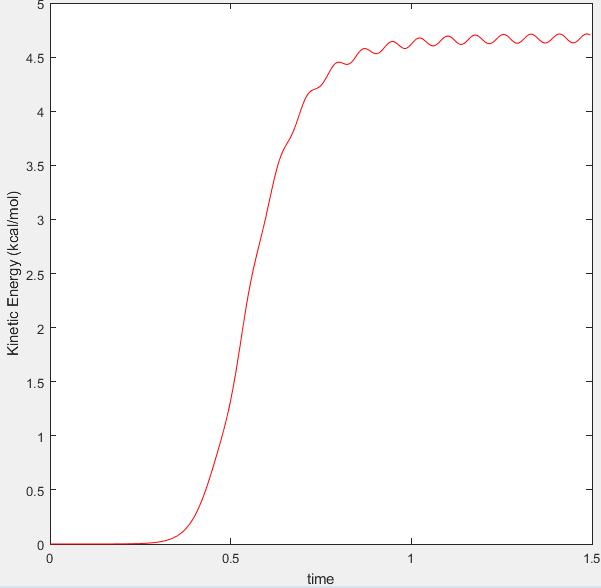 |
Complete the table by adding a column reporting if the trajectory is reactive or unreactive. For each set of initial conditions, provide a screenshot of the trajectory and a small description for what happens along the trajectory.
| p1 | p2 | Reactivity |
|---|---|---|
| -1.25 | -2.5 | Reactive |
| -1.5 | -2.0 | Not Reactive |
| -1.5 | -2.5 | Reactive |
| -2.5 | -5.0 | Not Reactive |
| -2.5 | -5.2 | Reactive |
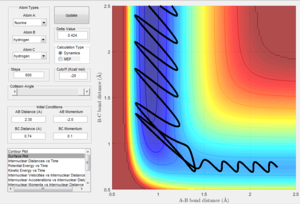
- In the first case, the atom approached the H2 and no significant vibration was seen. The reaction was successful as the atom went through the transition state, formed a bond with H to form the product H2 which displaced one of the atoms. The product vibrated after formation as seen from the fluctuating bond distance. (Figure 6)
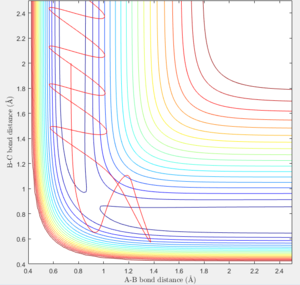
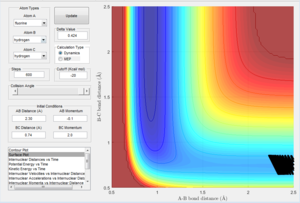
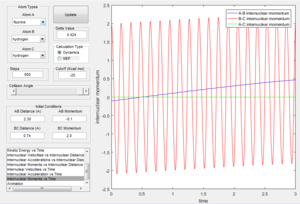
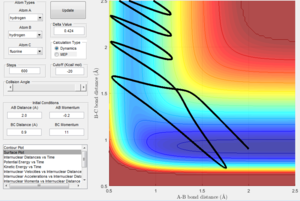
- In the second case, the translational energy of the approaching atom has decreased while the vibrational energy of the H - H bond increased. The atom approaches the H2 molecule and attracts one of the atoms, causing the molecule to vibrate. However the vibrational energy is not sufficient to go through the transition state. As a result, the atom returns on the path in which it took to reach this position. (Figure 7)
- In the third case, the translational energy has increased which is sufficient enough to go through the transition state and form the products. (Figure 8)
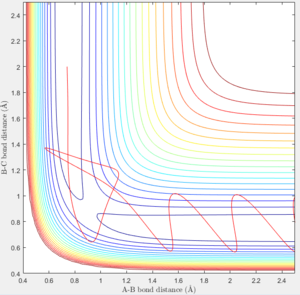
- In the fourth case, translational energy of the atom and vibrational energy of the bond has increased. It can be seen in figure 9 that the trajectory reaction goes through the transition state and forms the product. However, the product then bounces off the potential energy surface causing the bond to dissociate and the trajectory of the reaction can be seen going back through the transition state to the reactants again. This is known as recrossing. (Figure 9)
- In the fifth case, the translational energy of the approaching atom has been increased further. The trajectory of the reaction passes through the transition state forming the product bond, again bouncing off the potential surface before going back through the transition state to the reactant trajectory (recrossing). After this, the trajectory reaction goes back through the transition state forming the product. (Figure 10)
In the fourth and fifth case, this highlights the difficulty in predicting reactions that have high translational energy (high p2 which is along the AB trajectory) as both cases have large translational energy yet only one of them results in a reaction.
State what are the main assumptions of Transition State Theory. Given the results you have obtained, how will Transition State Theory predictions for reaction rate values compare with experimental values?
The main assumptions of the Transition State Theory areː[1]
- For each elementary step in a multi-step reaction, the transition state theory assumes that each intermediate produced has a long enough lifetime that a Boltzmann distribution of energies is reached before the reaction continues to the next step.
- Atoms and molecules will only react or reach the transition state when the atoms or molecules have enough energy. Each atomic nuclei is thus behaving classically.
- The reaction will go through the lowest energy saddle possible on the potential energy surface.
- A reaction will only go though the transition state once.
Assumption 4 states that once the reaction goes through the transition state, the transition state theory model suggests that the reaction will go to completion after this has occurred. However in some of the reactions above, it was seen that the reaction went through the transition state to form the product but the reactants then reformed after this. Therefore as the transition state theory would classify this reaction as going to completion, the experimental rate value would be lower as it would not classify this as a successful reaction. In this experimental, quantum mechanics was not taken into account so this would not be seen.
Small noteː If you take into consideration quantum mechanics, it is a possible that particles can still tunnel across the activation energy barrier even though the the molecules do not contain the activation energy. As a result, the experimental values for rate would be higher than that predicted by the transition state theory model. The experimental rate value would be lower as explained above.
Assumption 3 looks pretty important too Tam10 (talk) 15:55, 22 May 2017 (BST))
EXERCISE 2: F - H - H system
Classify the F + H2 and H + HF reactions according to their energetics (endothermic or exothermic). How does this relate to the bond strength of the chemical species involved?
F + H2: The reaction between F + H2 is exothermic. This is because the HF bond formed is stronger than H2, therefore more energy is released from the formation of the HF bond than is taken in to break the H2 bond. H + HF: The reaction between H + HF is endothermic as HF is a stronger bond than H2. As a result, more energy is required to break the HF bond than is released on the formation of the H2 bond. Figures 11 and 12 displays the reaction pathways for the F + H2 reaction and H + HF reaction respectively. In figure 11, the products (bottom right of curve) are lower in energy than the reactants where as in figure 12, the reactants (bottom left of curve) are lower in energy than the products.
Figure 11 displaying the exothermic reaction F + H2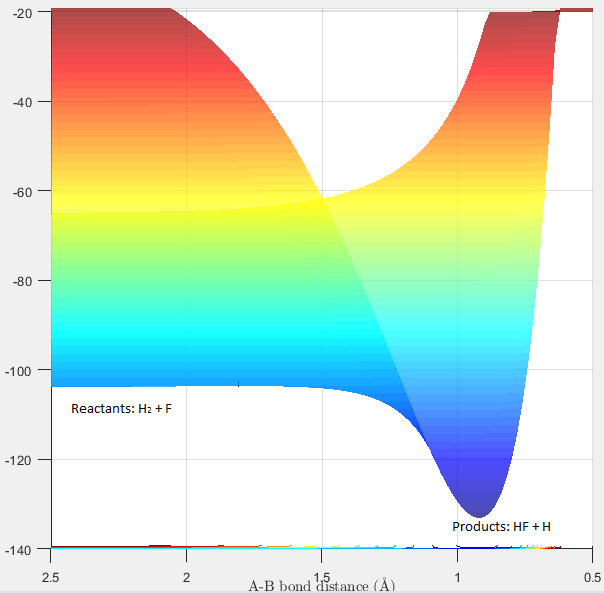 |
Figure 12 displaying the endothermic reaction H + HF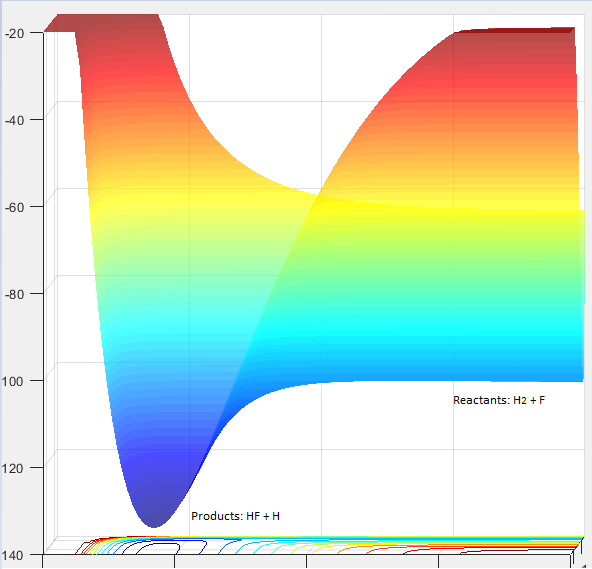 |
Locate the approximate position of the transition state
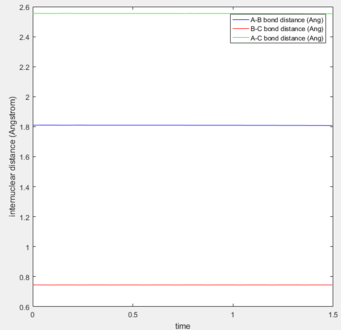
Hammond's postulate states when two states in a reaction have similar energies and occur consecutively, the conversion between them involves a small reorganization of the molecular structures. An exothermic reaction means the products are lower in energy than the reactants. The transition state is closest to the highest energy state. Therefore in the first reaction, the transition state will resemble the reactant and so bond distances for the transition state will resemble the reactants bond distance. The maximum energy again was located using bond lengths near to that of the reactants and by observing if the internuclear distance changed with time. (Figure)
The transition state position was found to be: AB (1.810) and BC (0.745). This was then confirmed using the internuclear distance vs time plot. As the internuclear distance did not change over time, these coordinates represent the transition state.
Report the activation energy for both reactions.
Energy of the reactants at the beginning of the reaction: -103.92
Energy of the transition state of the reaction: -103.75
Energy of the products at the end of the reaction: -133.893
Activation Energy of F + H2 reaction: 0.17 kcal/mol
Activation Energy of H + HF reaction: 30.14 kcal/mol
Figure 14 Displaying the energy of the reactants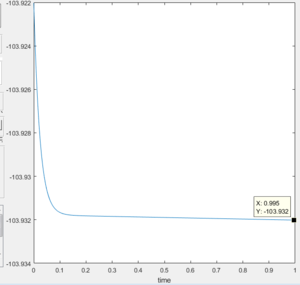 |
Figure 15 Displaying the energy of the transition state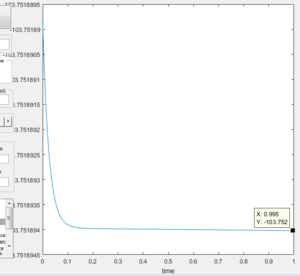 |
Figure 16 Displaying the energy of the products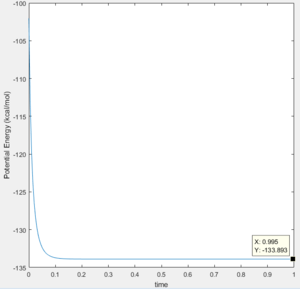 |
In light of the fact that energy is conserved, discuss the mechanism of release of the reaction energy. How could this be confirmed experimentally?
AB distance: 1.81 Momentum: -10
BC distance: 0.745 Momentum: 0
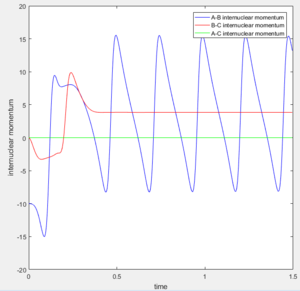
Since there is excess momentum in the reaction, the energy has to be released in order to obey the law of conservation of energy. In this reaction, this excess energy causes the new diatom (HF) to vibrate as translational energy is converted to vibrational energy. This can be seen in figure 16 where the bond distance of HF (AB) is fluctuating with time. In order to prove that energy is being transferred to vibrational energy, IR spectroscopy could be used where the vibrations in the IR spectrum of the HF molecule produced would be lower in intensity. This is because the excess energy is exciting the vibrational ground state in the molecule which then decays. However this method does not show the energy of the photon released therefore calorimetry could be used as this technique is able to detect the non radiative decay given off from the excited vibrational molecule. The amount of heat given off could be measured proving energy was conserved in the reaction.
(It's the transfer from potential energy that's significant here. Giving only just enough kinetic energy or momentum will trigger reaction and there will still be vibrational energy in the products Tam10 (talk) 15:55, 22 May 2017 (BST))
Setup a calculation starting on the side of the reactants of F + H2, at the bottom of the well rHH = 0.74, with a momentum pFH = -0.5, and explore several values of pHH in the range -3 to 3 (explore values also close to these limits). What do you observe?
In each test run, it can be seen that the reaction does not go to completion. Even though the overall energy added to the system is larger than the activation, the reaction is still not occurring.
For the same initial position, increase slightly the momentum pFH = -0.8, and considerably reduce the overall energy of the system by reducing the momentum pHH = 0.1. What do you observe now?
In this test run, the reaction went to completion. This therefore shows that having the energy in translational modes is more beneficial than having energy in vibrational modes. Even when an excess of vibrational energy was supplied to the system, the reaction did not occur.
Try to obtain a reactive trajectory by decreasing the momentum of the incoming H atom and increasing the energy of the H - F vibration.
AB distance: 2.0 Momentum: -0.05
BC distance: 0.74 Momentum: -2
Discuss how the distribution of energy between different modes (translation and vibration) affect the efficiency of the reaction, and how this is influenced by the position of the transition state.
Polanyi's rules state that the vibrational energy is better at promoting a reaction where the transition state resembles the products than translational energy. The translational energy is better at promoting a reaction where the transition state resembles the reactants than the vibrational energy. Therefore if the reaction is exothermic, then it will have an early transition state and this means that translation will contribute more towards the reaction. This results in the total available energy being deposited mostly into vibrations in the product.[2]
To see if this theory applies to experimental data, a test was set where the translational energy of the Fluorine atom was high but the vibrational energy of H2 bond was low for the reactionː H2 ̹+ F (exothermic). This was set by having a large negative momentum for AB which sets a large translational energy for the fluorine atom towards H2 and a small BC momentum which sets a small vibrational energy. In this case it is expected that translational energy will contribute more to reaction completion than vibrational energy. In this experiment, the reaction went to completion as can be seen from figures 17 and 18 where the HF bond was formed and the excess energy transferred to vibrational energy causing the bond to vibrate. When the translational energy was zero and the vibrational energy was set with the same momentum, the reaction did not occur as can be seen from figures 19 and 20 because the trajectory of the reaction did not go through the transition state and reach the products. This shows that translation energy does have a bigger contribution to the reaction success than vibrational energy for exothermic reactions proving Polanyi's rules.
(You can't prove an empirical rule that was based on a huge number of trajectories with just a few trajectories. There are an incredible number of trajectories that can be tested with this software. You can only describe it and illustrate it. It is also an unfair assessment as your case of vibrational only with an early TS is going backwards Tam10 (talk) 15:55, 22 May 2017 (BST))
The same test was set for the reactionː HF + F (endothermic). Here it is expected that the vibrational energy will contribute more to reaction completion than translation energy. The vibrational bond strength of HF was set to be low in the first experiment and the translational energy of H large. It was observed that the reaction did not go to completion as can be seen from figures 21 and 22 because the trajectory of the reaction did not go through the transition state and reach the products. When the vibrational was large and the translation energy was set to be small, the reaction did occur as can be seen from figure 23 and 24 because the trajectory of the reaction did through the transition state and reach the products, where the bond vibrated after formation. This shows that vibrational energy does have a bigger contribution towards reaction success than translational energy for endothermic reactions proving Polanyi's rules.

