MRD:JPWilliams5
Exercise 1: H + H2 system
Question 1
What value does the total gradient of the potential energy surface have at a minimum and at a transition structure? Briefly explain how minima and transition structures can be distinguished using the curvature of the potential energy surface.
The transition structure occurs at the saddle point of the minimum energy pathway [1]. The TS is defined as the saddle point of the entire Potential Energy Surface. And occurs at the maximum point along the minimum energy pathway Je714 (talk) 15:39, 22 May 2017 (BST)
The total gradient of the potential energy surface at a transition structure is equal to zero, ∂V(ri)/∂ri=0. Minima and transition structures can be distinguished by setting the initial conditions to near the transition state or minima, and seeing if they roll in a particular direction. If they do not roll, then it signifies a gradient of 0 and therefore a transition state or minima.
This analogy is not incorrect, but it's just that, an analogy. A rigorous description of the TS would involve discussing the differences in curvature between it and a minimum or a maximum of the PES. Think about the second partial derivatives, what are their signs at each of those points? Je714 (talk) 15:39, 22 May 2017 (BST)
Question 2
Report your best estimate of the transition state position (rts) and explain your reasoning illustrating it with a “Internuclear Distances vs Time” screenshot for a relevant trajectory.
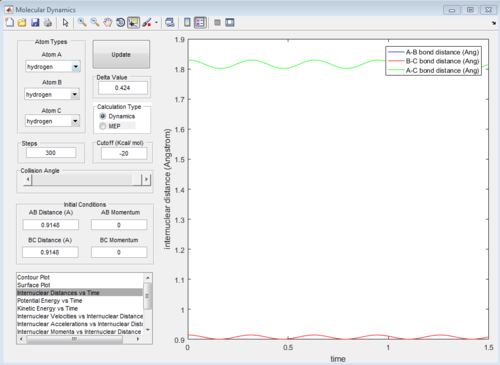
The transition state is found at the maximum when the internuclear distance r1 = r2 is this always the case? Je714 (talk) 15:41, 22 May 2017 (BST) , along the minimum energy path. At this point both the momentum p1 and p2 will equal zero. An approximate value for the distance between nuclei at the transition state can be determined from the Internuclear Distances vs Time graph for the reaction, as it is the point where the the lines for the internuclear distances r2 and r2 cross. This is illustrated below in Figure 1.
Figure 1: Internuclear Distance vs Time plot for the reaction of H with H2.
From the plot it was deduced that the time at which the transition state occurs is at approximately 0.38 time units, and at this point there is an internuclear distance of approximately 0.9148 Angstroms. A second Internuclear Distance vs Time plot is shown below in Figure 2, using internuclear distances of r2 = r2 = 0.9148 Angstroms.
Figure 2: Internuclear Distance vs Time plot for the reaction of H with H2, at a fixed internuclear distance of both r1 = r2 = 0.9148 Angstroms.
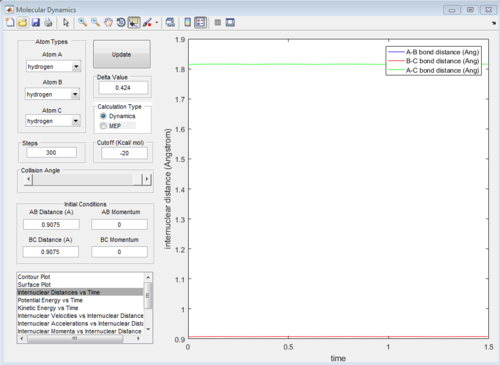
The average internuclear distances remain constant, however both Hydrogen A and Hydrogen C are still vibrating, shown by the fluctuations in internuclear distance with time. Hence, this internuclear distance cannot be the best estimate of the transition state. Other internuclear distances were tested, each when r2 = r2 to find a best estimate of the transition state position rts. It was found that the best estimate of the transition state was at rts = 0.9075 Angstroms. A plot of the Internuclear Distances vs Time for this internuclear distance is shown below in Figure 3.
Figure 3: Internuclear Distance vs Time plot for the reaction of H with H2at a fixed internuclear distance of both r1 = r2 = 0.9075 Angstroms.
rts = 0.9075 Angstroms
The atoms are no longer vibrating shown by the almost straight lines compared with the fluctuating plot in Figure 2, confirming this is a better estimate of the transition state.
Good discussion Je714 (talk) 15:41, 22 May 2017 (BST)
Question 3
Comment on how the mep and the trajectory you just calculated differ.
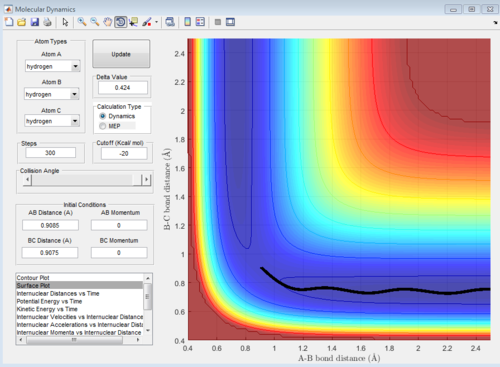
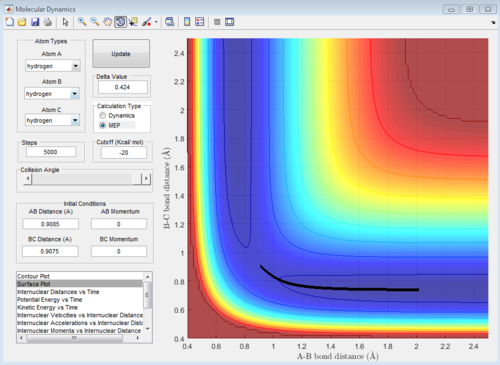
The initial conditions were slightly displaced from the transition state (r1 was displaced by 0.01 Angstroms to 0.9085, r2 was kept the same at 0.9075 and p1 and p2 = 0). The mep and a dynamic plot for these conditions is shown below in Figures 4 and 5.
Figure 4: Surface 'dynamic' plot for the reaction of H with H2, with initial conditions slightly displaced from the transition state.
Figure 5: Surface 'mep' plot for the reaction of H with H2, with initial conditions slightly displaced from the transition state.
The minimum energy plot (shown in Figure 5) follows the reaction path (or minimum energy path) for the reaction, it finds the minimum energy and does not vibrate you need to explain/understand why is this so Je714 (talk) 15:42, 22 May 2017 (BST) . Therefore, when the initial conditions are set slightly different from the transition structure, the diatomic rolls away from the transition structure and follows the minimum energy path, it does not oscillate. If the MEP starts at a gradient of 0, then it will not move and hence no trajectory is generated. The dynamic plot (shown in Figure 4) shows the reactants rolling off the transition state to lower energy, the diatomic BC proceeds to vibrate and move away from atom A.
Question 4
Complete the table by adding a column reporting if the trajectory is reactive or unreactive. For each set of initial conditions, provide a screenshot of the trajectory and a small description for what happens along the trajectory.
For the initial positions r1 = 0.74 and r2 = 2.0, the following momenta were tested to see if they are reactive or not, the results are shown below in Table 1.
| Trajectory | p1 | p2 | Reactivity |
|---|---|---|---|
| 1 | -1.25 | -2.5 | Reactive |
| 2 | -1.5 | -2.0 | Unreactive |
| 3 | -1.5 | -2.5 | Reactive |
| 4 | -2.5 | -5.0 | Unreactive |
| 5 | -2.5 | -5.2 | Reactive |
Trajectory 1
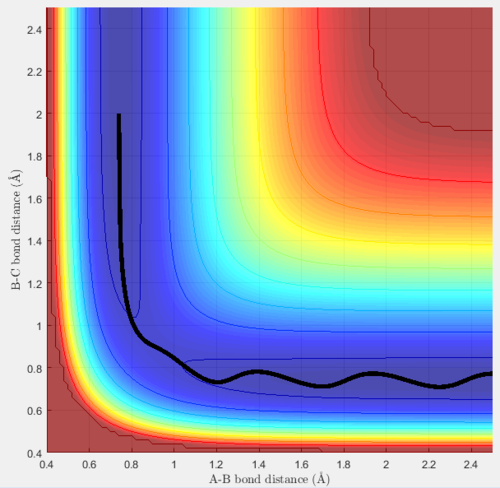
Trajectory 1 is reactive, at the start diatomic BC is oscillating and hydrogen A is moving towards it. When they collide, they react, the BC bond breaks and B forms a bond with A. AB then moves off along the minimum energy pathway, it does not oscillate. C bounces off and moves in the opposite direction. This is shown by the increasing B-C distance (y-axis), and the constant A-B distance (implying they are now bonded and not vibrating).
Trajectory 2
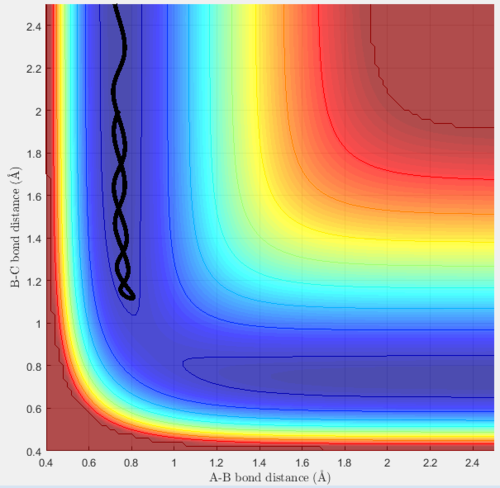
Trajectory 2 is unreactive, at the start the diatomic (now AB) is oscillating, and hydrogen C is moving towards it (shown by the decreasing BC distance). When they collide, they do not react, A and B remain bonded and the diatomic AB now moves off in the opposite direction of C. A-B remains bonded and oscillating throughout the trajectory, this is shown by the constant average A-B distance, which oscillates. The diatomic and C then move off in opposite directions to each other, this is shown by the increasing B-C distance after the collision (y-axis).
Trajectory 3
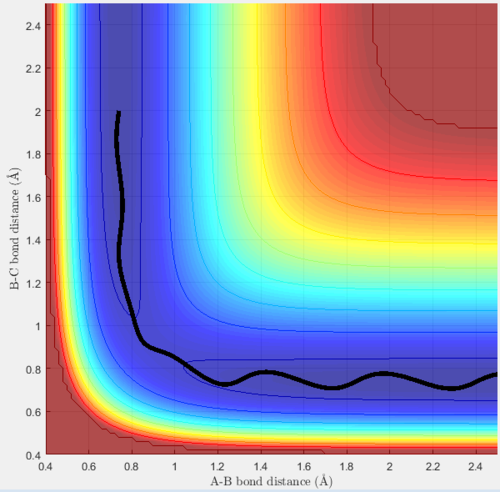
Trajectory 3 is reactive, at the start diatomic BC is oscillating and hydrogen A is moving towards it. When they collide, they react, the BC bond breaks and B forms a bond with A. AB then moves off and oscillates, however at a lower energy, shown by the decreased amplitude of the oscillation when compared with BC. C bounces off and moves in the opposite direction. This is shown by the increasing B-C distance (y-axis), and the constant average A-B distance.
Trajectory 4
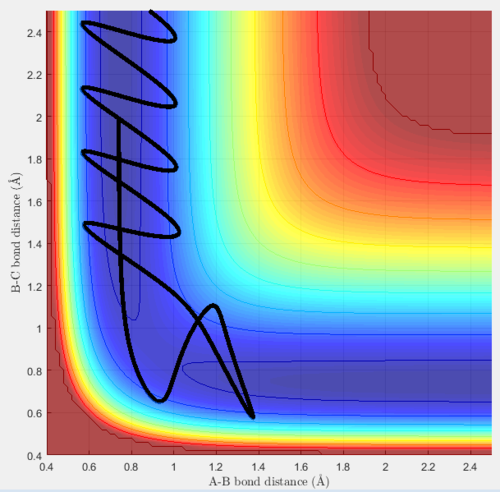
Trajectory 4 is a special case, it initially reacts, the reactants react to produce the products however they then reform back to the reactants. This is called barrier recrossing. Diatomic AB reacts with C, the product BC forms, then the diatomic AB reforms and moves away from C, however now moving along the MEP, and not oscillating.
Trajectory 5
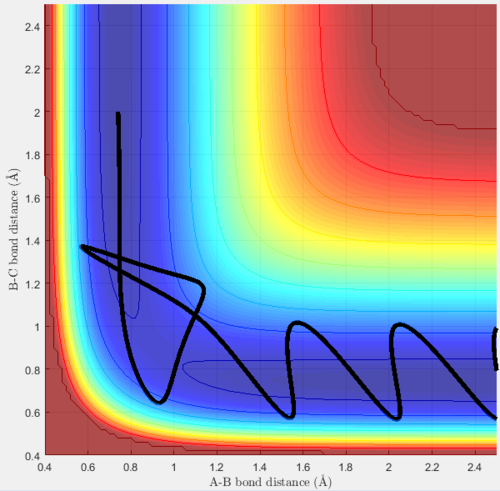
Trajectory 5 does react. Diatomic BC is oscillating and A is moving towards it. They collide, react and the molecule AB forms, it then appears to revert back to the transition state before moving away along the MEP.
Question 5
State what are the main assumptions of Transition State Theory. Given the results you have obtained, how will Transition State Theory predictions for reaction rate values compare with experimental values?
Transition state theory is used to explain how reactions take place and the reaction rates of elementary reactions. It is based on certain assumptions of the equilibrium between the reactants and products, this equilibrium is called a 'quasi-equilibrium'[2]. This is a statistical view of TST. In this lab, you're just looking at the collision between three atoms in isolation, so not really applicable. Je714 (talk) 15:46, 22 May 2017 (BST) The main assumptions made in TST are explained below:
Firstly, transition state theory assume that atoms and molecules behave classically [3]. Furthermore, it is assumed that if the atoms or molecules collide without enough energy to overcome the reaction barrier, and form the transition structure, then the reaction will not occur. However, in reality, particles are sometimes able to 'tunnel' through the reaction barrier and react even if they do not have enough energy to classically. This is not wrong, but also not really applicable here. Remember, the simulations that are run in this lab make use of classical dynamics. Je714 (talk) 15:46, 22 May 2017 (BST)
Secondly, the transition state theory assumes that reactions will always occur via the lowest energy saddle point on the potential energy surface [4]. Therefore, the TST breaks down at higher temperatures when higher vibrational modes are occupied.
The two/three points that you raise here are not factually wrong but aren't really relevant to what you're observing in this lab. I think you've missed the biggest point, which you actually do observe: barrier recrossing. TST assumes that if enough energy is given to the reactants to overcome the activation energy of the TS, the reaction will 100% proceed to the products. However, you've disproven that with some of the conditions above. Je714 (talk) 15:46, 22 May 2017 (BST)
Exercise 2: F-H-H System
Question 1
Classify the F + H2 and H + HF reactions according to their energetics (endothermic or exothermic). How does this relate to the bond strength of the chemical species involved?
The F + H2 -> HF + F reaction is exothermic. A reaction was tested with a H2 molecule (BC) with a bond length of 0.74 Angstroms, colliding with a Fluorine atom (A) with distance AB = 2.30. The momentum of the Fluorine atom A was set to be -2.70. The reaction occurred and the B-C bond broke and an A-B bond formed (H-F bond formed), and Hydrogen C bounced off and moved away from the newly formed H-F molecule. Both molecules AB (H-F) and C (H) oscillated as they moved away from each other. The surface plot for this reaction is shown below:
Figure 11: Surface Plot for the reaction F + H2 -> H + HF.
From the plot it shows that the reaction is exothermic, as the energy of the products is lower than the energy of the reactants. (In the diagram, the trajectory starts on the right and moves round to the left and lower energy).
This implies that the reverse reaction (H + HF -> F + H2) is endothermic.
With respect to the bond strength of the species involved, it shows that the H-F bond is much stronger than the H2 bond, as the energy of the H2 bond is higher and it is therefore weaker. Furthermore, it is more favorable to form the H-F bond over the H2 bond.
You don't actually need to run any trajectories to answer this question. You can either look at the PES directly, or compare the bond energies of the products/reactants. Je714 (talk) 15:47, 22 May 2017 (BST)
Question 2 and 3
Locate the approximate position of the transition state and report the activation energy for both reactions.
Hammonds postulate states that the transition state of an exothermic reaction resembles the reactants as the transition state occurs earlier, and for an endothermic reaction it will resemble the products as the transition state occurs later. Taking this into account it implies that the transition state will resemble F and H2. The transition state (highest energy point in the transition state region) was found by trial and error to be AB = 1.8 Angstroms, and BC = 0.75 Angstroms (with momentum = 0),the MEP showing the transition state is shown in Figure 12 below. This point being the transition state was confirmed by the Inter-nuclear Distances vs Time plot for these initial conditions, shown below in Figure 12 as it shows unchanging inter-nuclear distances with no oscillation. The energy of the transition state was estimated from the MEP surface plot at -103.2 kcal/mol.
Figure 12: MEP Surface Plot showing the transition state.
Figure 13: Inter-Nuclear Distances vs Time plot for the transition state.
The activation energy for the exothermic reaction is then calculated by calculating the difference between the transition state energy (-103.2 kcal/mol) and the lowest energy point of the reactants in the minimum energy pathway. This was found by displacing the initial conditions slightly towards F and H2, the trajectory then rolled down towards the minimum energy. This was found to be -103.3 kcal/mol. Hence, the activation energy for the reaction F + H2 -> H + HF was estimated at 0.1 kcal/mol. Good strategy, but the value isn't converged enough. Je714 (talk) 15:48, 22 May 2017 (BST)
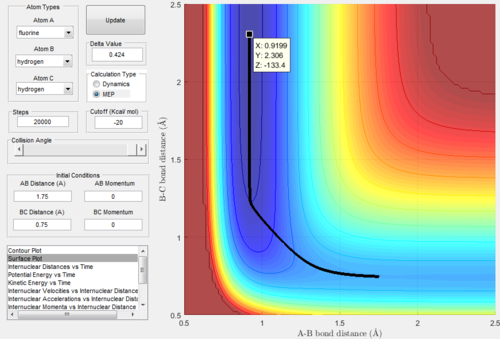
Using a similar method the activation energy of the reverse reaction was calculated. The transition state was slightly displaced towards H and HF and an MEP surface plot was calculated, this surface plot is shown below in Figure 14. The trajectory then rolled down from the transition state to the minimum energy of the particles H and HF. The MEP surface plot of this is shown below, as you can see from the diagram the energy has plateaued at the minimum energy of H and HF. This energy was found to be -133.4 kcal/mol and hence the activation energy of the endothermic reaction is 30.2 kcal/mol.
Figure 14: MEP Surface Plot for a trajectory displaced slightly from the transition state towards H and HF.
Question 4
In light of the fact that energy is conserved, discuss the mechanism of release of the reaction energy. How could this be confirmed experimentally?
A reactive trajectory surface plot for F + H2 is shown below in Figure 15.
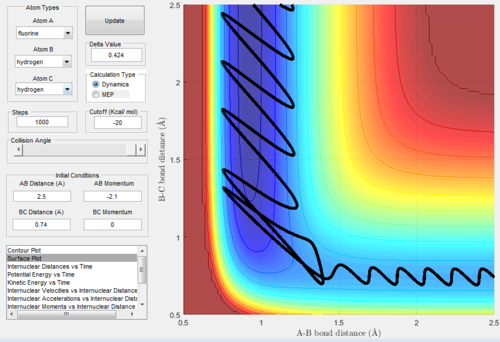
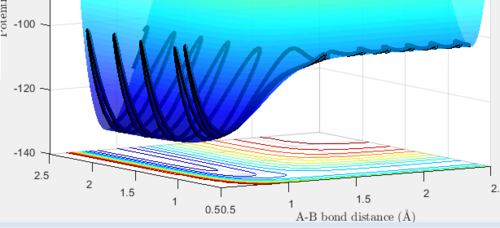
The animation and inter-nuclear momenta vs time plots for this trajectory imply that the energy is converted slowly between potential, kinetic and vibrational. Energy is converted between all the forms, however the total energy of the system remains the same. The energy starts off as potential energy, however as the reaction proceeds it is converted to vibrational and kinetic. This is shown by the reactants having a higher potential energy, vibrating at a lower frequency and moving at a lower speed (and hence lower kinetic energy). This is shown by the smaller amplitude in the oscillation of the trajectory moving up to the transition state (shows lower vibrational energy). After the reaction has occurred, the products have a much lower potential energy, this energy has been converted to kinetic and vibrational energy in the products. This can be seen in the surface plot by the increased amplitude of the vibration in the HF product, showing it has a higher vibrational energy as it can reach higher vibrational states. This is shown below in Figure 16. As you can see, there is a clear difference in the amplitude of vibration between the reactants and products (products access much higher energy vibrational states and hence have a higher vibrational energy).
This could be confirmed experimentally by Infrared Spectroscopy. The products will have higher vibrational energy than the reactants, and therefore will absorb infrared radiation at a higher frequency. Therefore, taking an IR spectrum of the reactants and products and comparing the two could confirm this theory. It would be expected that the product vibrates at a higher frequency (higher vibrational energy) than the reactants.
Figure 16: Surface Plot for reactive F + H2 trajectory
Good explanation. Je714 (talk) 15:51, 22 May 2017 (BST)
Question 5
Discuss how the distribution of energy between different modes (translation and vibration) affect the efficiency of the reaction, and how this is influenced by the position of the transition state.
When more energy is distributed between higher vibrational levels (for example in a reaction at a high temperature), the transition state does not occur at the lowest energy saddle point. This means the position of the transition state is not in the most efficient place for the reaction as it does not occur at the lowest energy. This is one of the limitations of transition state theory.
Incomplete. Missing discussion about Polanyi's empirical rules with examples from your H F H system. Je714 (talk) 15:51, 22 May 2017 (BST)
References
- ↑ Atkins,P.W., De Paula.P, Oxford University Press (2009). Physical Chemistry, 9, Chapter 22
- ↑ IUPAC, Compendium of Chemical Terminology, The Gold Book,(1997), 2
- ↑ Eyring, H.,The Activated Complex in Chemical Reactions.,(1935),J.Chem.Phys3,p.107–115.
- ↑ Houston, P.L., Dover Publications, (2012), Chemical Kinetics and Reaction Dynamics, pp.102.


