MRD:JL12217
EXERCISE 1: H + H2 system
Ng611 (talk) 18:31, 30 May 2019 (BST) A mostly correct, but extremely bare-bones report. Aim to make your answers more detailed and think more carefully about your answers to the questions; there were a couple instances where you gave incorrect answers to the questions.
Q1: On a potential energy surface diagram, how is the transition state mathematically defined? How can the transition state be identified, and how can it be distinguished from a local minimum of the potential energy surface?
The transition state is defined as the saddle point on the potential energy surface. It is the point with maximum potential energy on the lowest energy pathway. Assume the energy function is f, at saddle pint =0.
The saddle point is a stationery point but it is not an extremum. At local minimum the concavity of the curve will change.
Ng611 (talk) 18:25, 30 May 2019 (BST) Incorrect, the saddle point is actually at an extremal point (maximum along one vector and minimum along the other).
Q2: Report your best estimate of the transition state position (rts) and explain your reasoning illustrating it with a “Internuclear Distances vs Time” plot for a relevant trajectory.
Estimated rts=0.908 Å. As illustrated in the diagram below, when r1=r2=0.908 Å and p1=p2=0, the internuclear distance is not changing with time,suggesting that the system has reached transition state.

Q3:Comment on how the mep and the trajectory you just calculated differ.
 |
 |
|---|
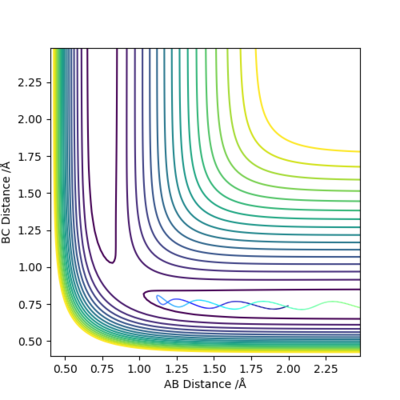
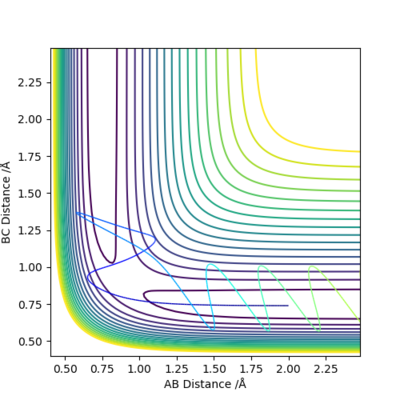
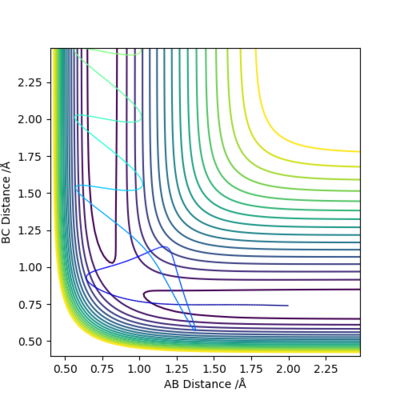
When using the MEP method, the momenta is always set to zero. This suggests that the kinetic energy is always zero and vibration motion of the molecule will be absent. In the MEP contour plot above, the trajectory shows no oscillation. When using the dynamic method, the kinetic energy is not always zero and vibration motion will be present. This is demonstrated in the DM contour plot, the trajectory shows oscillation.
Q4:Complete the table above by adding the total energy, whether the trajectory is reactive or unreactive, and provide a plot of the trajectory and a small description for what happens along the trajectory. What can you conclude from the table?
| p1 | p2 | Etot | Reactive? | Description of the dynamics | Illustration of the trajectory |
|---|---|---|---|---|---|
| -1.25 | -2.5 | -99.018 | Yes | Atom A and molecule BC approaches each other.
They possess enough kinetic energy to overcome the energy barrier at transition state. The reaction successfully occurs. |
|
| -1.5 | -2.0 | -100.456 | No | Atom A and molecule BC approaches each other.
They do not possess enough kinetic energy to overcome the energy barrier at transition state. The reaction does not occur. |
|
| -1.5 | -2.5 | -98.956 | Yes | Atom A and molecule BC approaches each other.
They possess enough kinetic energy to overcome the energy barrier. The reaction occurs |
|
| -2.5 | -5.0 | -84.956 | No | Atom A and molecule BC approaches each other.
They possess enough kinetic energy to overcome the energy barrier and trajectory passes TS region. The product is formed momentarily but revert back to vibrating reactants. The reaction is ultimately not successful. |
|
| -2.5 | -5.2 | -83.416 | Yes | Atom A and molecule BC approaches each other.
They possess enough kinetic energy to overcome the energy barrier and trajectory passes TS region. The product is formed and the reaction is successful. |
Observations from the table:
For all the conditions above, the reactants have same initial potential energy and whether the reaction is successful is dependent on the initial momenta of the reactants.
For an unsuccessful reaction, Increasing the initial momenta is likely to lead to successful reaction.
However, high initial momenta will not guarantee successful reaction as the product may only be formed momentarily and revert back to reactants(barrier recrossing)
Q5 State what are the main assumptions of Transition State Theory. Given the results you have obtained, how will Transition State Theory predictions for reaction rate values compare with experimental values?
Assumptions of Transition State theory1:
1.Electronic and nuclear motions are separated. ( The Born-Oppenheimer approximation)
2.In the transition state, motion along the reaction coordinate may be separated from the other motion and treated classically as translation.
3.A molecular system that has crossed the transition state in the direction of a product cannot turn around and reform reactant.
4.Even in the absence of equilibrium between reactant and product molecules, the transition states that are becoming products are distributed among their states according to the Maxwell-Boltzmann laws
The experimental results has shown that reformation of reactants is possible even after momentary formation of products(barrier recrossing). Hence the experimental rate of reaction will be smaller than that predicted by transition state theory due to this effect.
Ng611 (talk) 18:26, 30 May 2019 (BST) Good!
EXERCISE 2: F - H - H system
Q6: By inspecting the potential energy surfaces, classify the F + H2 and H + HF reactions according to their energetics (endothermic or exothermic). How does this relate to the bond strength of the chemical species involved? Locate the approximate position of the transition state.
 |
 |
|---|
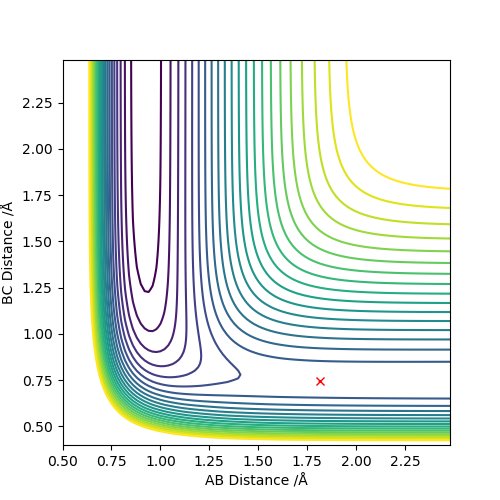
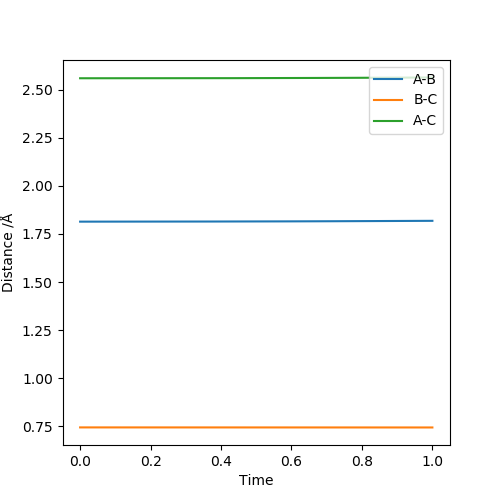
The two diagrams above illustrate the F + H2 → HF + H reaction. From the contour plot, it can be seen that when transition state is reached, F-H bond is long and H-H bond is short. Hence the transition state resembles the reactant (H2). According to Hammond's postulate, if the transition state resembles the reactant, the reaction is exothermic. This observation is supported by F-H and H-H bond strength.:H-H bond broken and F-H bond formed. ΔH=BE(H-H)-BE(H-F)=+436-565=-129KJ/mol
The approximate transition state position: r1=1.815Å r2=0.744Å. Under this condition, the internuclear distance does not change with time, as illustrated in the internuclear distance plot.
 |
 |
|---|
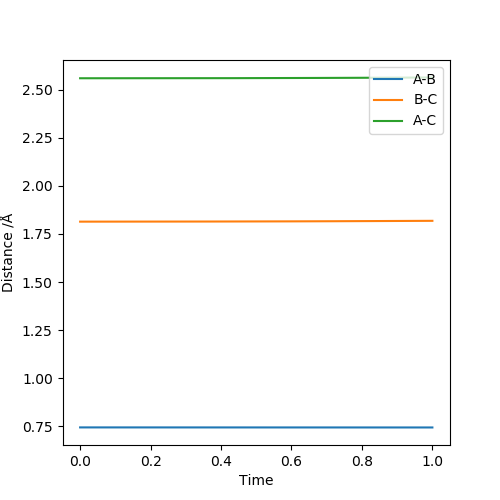
The two diagrams above illustrate the H + HF → H2 + F reaction. From the contour plot, it can be seen that when transition state is reached, F-H bond is long and H-H bond is short. Hence the transition state resembles the product (H2). According to Hammond's postulate, if the transition state resembles the product, the reaction is endothermic. This observation is supported by F-H and H-H bond strength.:H-H bond formed and F-H bond broken. ΔH=BE(H-F)-BE(H-H)=-436+565=+129KJ/mol
The approximate transition state position: r1=0.744Å r2=1.815Å. Under this condition, the internuclear distance does not change with time, as illustrated in the internuclear distance plot.
Q7:Report the activation energy for both reactions.
 |
 |
|---|
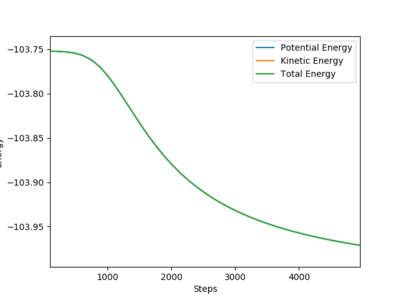
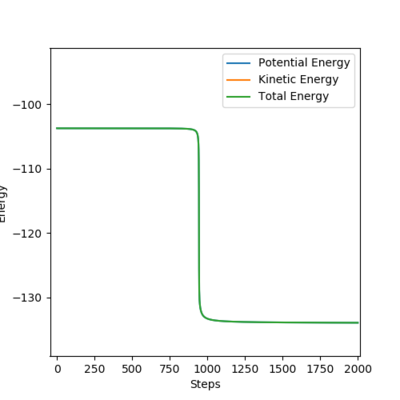
The transition states of the two reactions are identical as they are the foward and backward reaction of a reversible process.
Activation energy of F + H2 → HF + H reaction=0.21kcal/mol. This reaction is exothermic, reactants are closer to transition state, leading to a small activation energy.
Activation energy of H + HF → H2 + F reaction=31.11kcal/mol. This reaction is endothermic, reactants are further away from transition state, leading to a large activation energy.
Q8: In light of the fact that energy is conserved, discuss the mechanism of release of the reaction energy. Explain how this could be confirmed experimentally.

 |
 |
 |
|---|
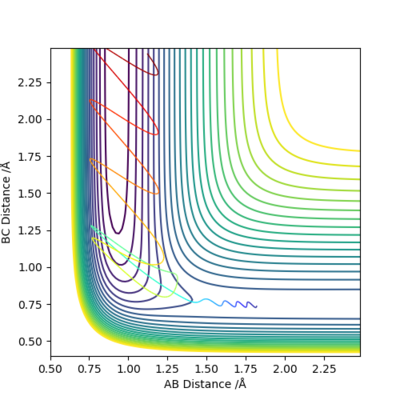
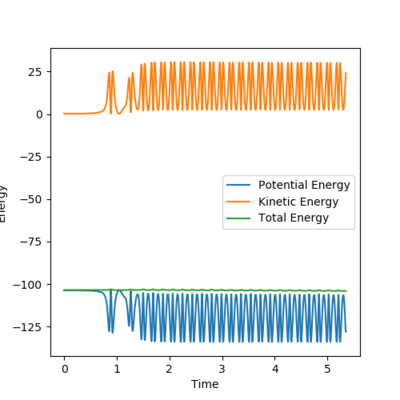
From the energy vs time plot, it can be observed that the potential energy of the system is decreased and the kinetic energy is increased. Increase in translational kinetic energy could be experimentally measured as an increase in temperature.
The increase in vibrational kinetic energy could be observed in the momenta vs time plot. The H-F bond in the product is vibrating more vigorously than the H-H bond in the reactant. The increase in vibrational energy may be measured by IR spectroscopy as an increase in vibrational wavenumber.
Ng611 (talk) 18:28, 30 May 2019 (BST) Additional vibrational energy would not actually affect the frequency of the IR bands. Think about what the frequency of an IR band determines and how it would change.
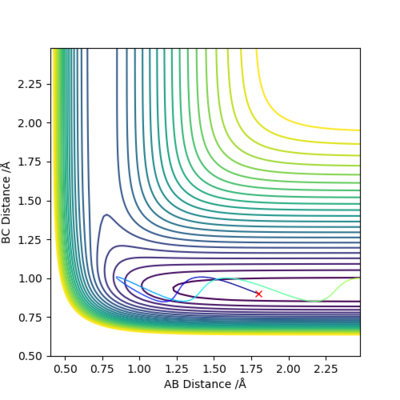
Q9: Discuss how the distribution of energy between different modes (translation and vibration) affect the efficiency of the reaction, and how this is influenced by the position of the transition state..
 |
 |
|---|
 |
 |
|---|
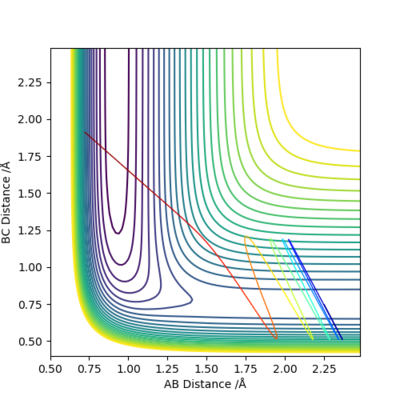
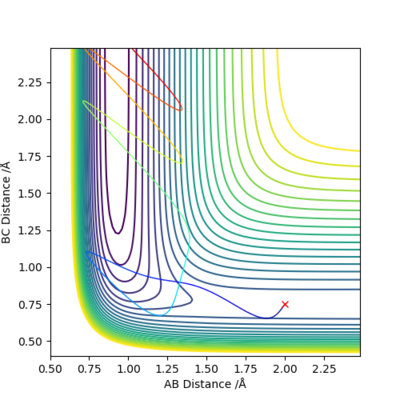
F + H2 → HF + H reaction is exothermic and has early transition state. Vibrational energy is more effective for crossing the energy barrier.
H + HF → H2 + F reaction is endothermic and has late transition state. Translational energy is more important for crossing the energy barrier.
Ng611 (talk) 18:29, 30 May 2019 (BST) Good.
Referrence
1. J. I. Steinfeld, J. S. Francisco, W. L. Hase, Chemical Kinetic and Dynamics, Prentice-Hall, New Jersey, 1998


