MRD:JHM
Molecular Reaction Dynamics
Part 1: H-H-H System
Throughout the following calculations, quantum effects have been neglected, as has the mass of the electron and a simple classical treatment has been adopted, which is within the Born-Oppenheimer approximation. Bond lengths are all in Angstroms. Presented below is the analysis of two systems involving a diatomic molecule colliding with a single atom.
Surface Potential Energy Diagrams
What Value do the different components of the gradient of the potential energy surface have at a minimum and at a transition structure? Briefly explain how minima and transition structures can be distinguished using the curvature of the potential energy surface.
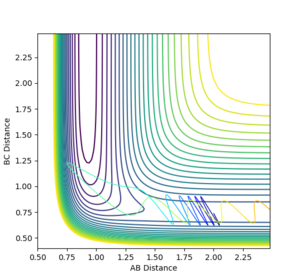
The reaction path follows the path of minimum energy through the surface plot, which can be used to monitor the progress of the reaction. A transition state occurs at the highest energy position on this path. This is a saddle point since the curvature is positive perpendicular to the reaction path and negative in the direction of the reaction path. The first partial derivatives in both directions at the transition state are zero.
At the minima (both reactants and products), the first partial derivatives are also zero, however, the minima and the transition state can be distinguished by examination of the second derivative. At the saddle point, the second derivative in one direction is positive, the other is negative, whereas both are positive at the minima.
More formally, the derivatives can be summarised as follows:
= 0 and are both true at the minima and stationary point.
and are true at the minimum point, whereas
and are true at the saddle point (transition state).
This part is good--Sw2711 (talk) 09:44, 1 June 2018 (BST)
Analysis of Transition State Geometry

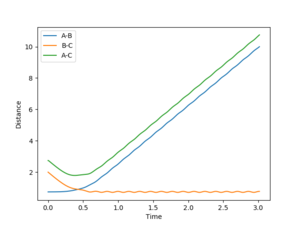
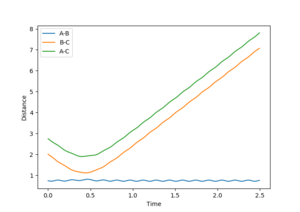
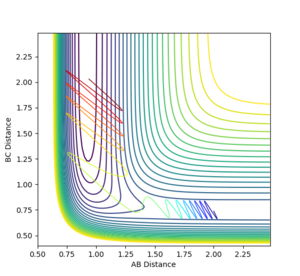
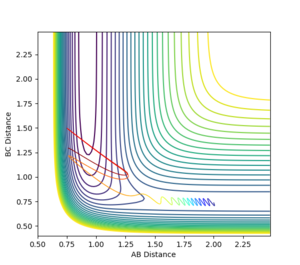
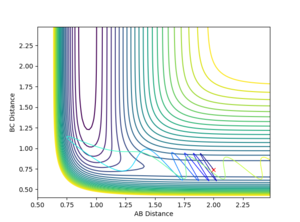
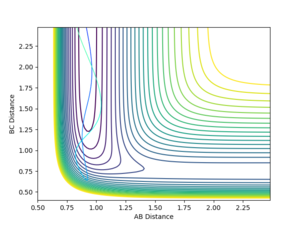
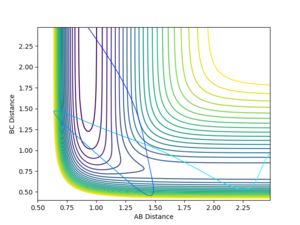
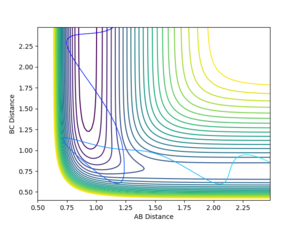
The bond distances were set to be equal in the transition state since is expected to be symmetric, and the momentum was set to be zero in order to show the stationary point. By varying the transition state bond length and examining the internuclear distance as a function of time, the optimum bond distance that caused a stable transition state was found to be 0.90774. The use of the momentum vs time plot allowed for more precise determination of the value of r than the internuclear distance vs time graph alone. The resultant internuclear distance vs time graph is shown in figure 1. Since the trajectory remains constant at this separation when the initial momentum is zero, this must be the transition state. To show that this is not indeed a minimum, a slight adjustment to either r1 or r2 shows the two bond distances diverging, as in figure 2. Similarly, a small starting momentum causes the reaction coordinate to proceed to a minimum, depending on the direction of the initial momentum.

This part is good--Sw2711 (talk) 09:44, 1 June 2018 (BST)
Reaction Path Analysis
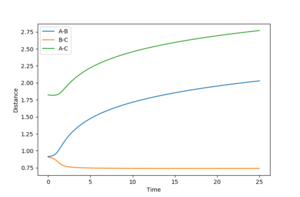
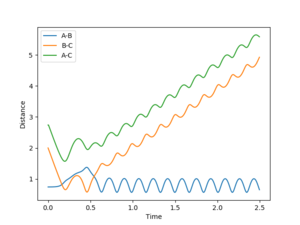
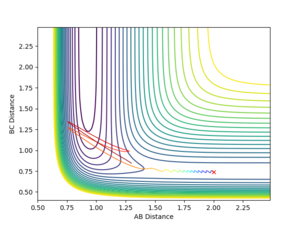
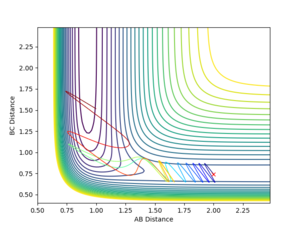
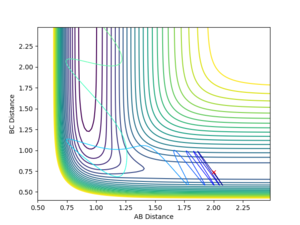
Using the MEP calculation, the minimum energy path was calculated from the transition state, and the plot is shown in figure 3. This method neglects vibration by resetting the velocity of the system to zero after each iteration. The final separations are AB = 2.029 and BC = 0.741. Momentum is conserved throughout this transition and is zero in the final state, as expected.
Difference between Dynamic and MEP Calculations
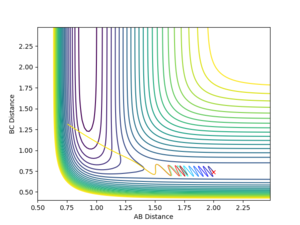
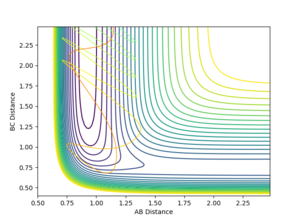
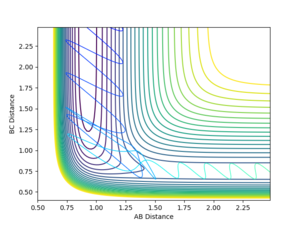
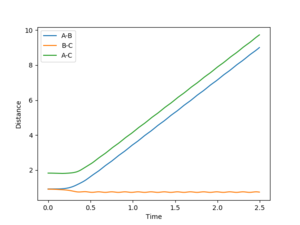
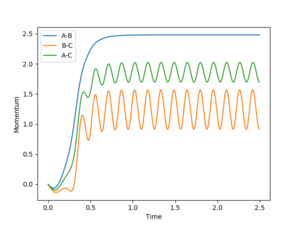
The dynamic calculation, which did not reset the velocity to zero after each iteration, provided a more realistic model of the behaviour of the system. Since momentum is allowed to increase, vibrations are seen in the diatomic component of the system, resulting in the oscillations observed in figure 5. These vibrations move the molecule out of the valley of the surface plot, hence a deviation from the minimum energy path. The BC bond length is found to be 0.740 after this calculation, in agreement with the MEP calculation above, despite fewer steps, however the AB bond distance is much greater at 9.00 since velocity is not reset after each step.
Good. What did you notice in terms of energy?--Sw2711 (talk) 09:47, 1 June 2018 (BST)
Reversed Calculations

With the initial momentum remaining zeroed, the distances were set such that AB = R(ts) and BC = T(ts) +0.01. The resulting internuclear distance vs time graph is shown in figure 8. As expected, this produces a similar graph with the bond distances interchanged. In this case, AB represents the H-H bond length as atom C moves away.
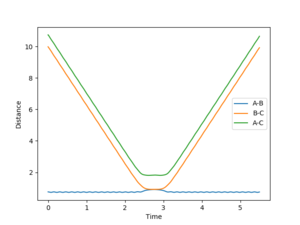
If we take the final positions (AB = 9.00, BC = 0.74, P(AB) = -1.30, P(BC) = -2.48 of this setup and reverse the direction of the momenta at this point, we obtain figure 7. This shows the formed H2 molecule coming towards the H atom, reaching a minimum separation before moving apart again without changing bonding configuration. This indicates the energy of the system is insufficient to cross the kinetic barrier, which is expected, considering the initial conditions were the transition state, and momentum is conserved throughout the process.
Good--Sw2711 (talk) 09:51, 1 June 2018 (BST)
Reactive and Unreactive Trajectories
This part is good--Sw2711 (talk) 09:52, 1 June 2018 (BST)
To summarise, the total amount of energy in the system is no guarantee of the reaction proceeding. In the lowest energy case, there was indeed insufficient energy to cross the kinetic barrier, however as the energy increased, the transition became more facile. Increasing the energy further allowed the barrier to be crossed multiple times. An even number of crossings resulted in no overall reaction, whereas an odd number of crossings resulted in the reaction going to completion.
What are the main assumptions of the Transition State Theory? Given the results you have obtained, how will TST predictions for reaction rate values compare to experimental values?
The analysis of the transition state allows us to predict the rate of reaction. By assuming the system is in equilibrium on each side of the transition state, once the transition state has been crossed, the reaction is expected to go to completion. This does not account for the fact that if the system energy still exceeds the kinetic barrier, the system can go back through the transition state, as discussed above.[1] Since TST considers each of these transitions to be a reaction, the rate of reaction in these cases is overestimated. Since such a reaction requires a large excess of energy compared to the kinetic barrier, this is likely to be the case for a particularly low kinetic barrier, or for reactions occuring at elevated temperatures.[2]
Good. Just one minor point, the term ‘equilibrium’ is not very applicable here. ‘equilibrium’ is mainly used in statistical thermodynamics. So like…thinking about a reaction A+B<=>C. Statistically speaking there is 80% molecules in this system reacts from the left to the right and 20% the other way around. (about obviously you should think about more like a Boltzmann distribution ). This reaction has reached an equilibrium. But in terms of your system, there are only 3 atoms. So, it is either one way or the other. --Sw2711 (talk) 09:53, 1 June 2018 (BST)
Part 2: F-H-H System
Inspection of Potential Energy Surface
Classify the F + H2 and H + HF reactions according to their energetics (endothermic or exothermic). How does this relate to the bond strength of the chemical species involved?
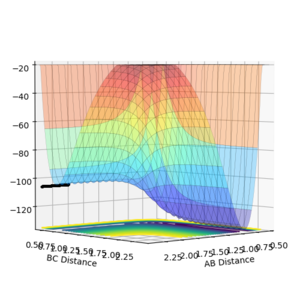
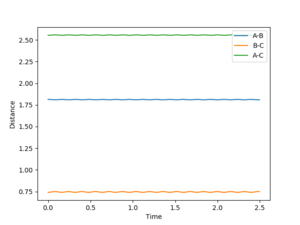
For the rection where H2 approaches an F atom, the surface plot shows the relative energies of the two species. This can be considered to be an entirely enthalpic contribution, since an equal number of species, one monatomic and one diatomic exists on each side of the reaction, making entropic contributions negligible. HF sits at around -136 kcal/mol compared to -105 kcal/mol for H2. H2 + F --> HF + H is therefore expected to exothermic, and the reverse is clearly endothermic. By Hammond's postulate, the transition state for an exothermic reaction will be early, resembling the reactants more. This indicates the transition state is on the H2 side of the valley. By fixing BC as the hydrogen bond length of 0.74, the AB distance was varied systematically to find the stationary point where final momentum was as close to zero as possible. The value for the H-F initial separation is 1.81356, giving the internuclear distance/time graph shown in figure 9.
Good--Sw2711 (talk) 09:58, 1 June 2018 (BST)
Report the activation energy for both reactions.
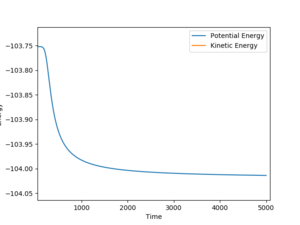
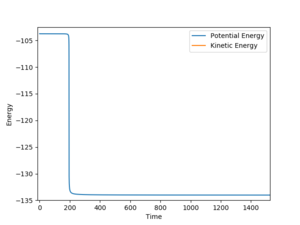
The HF initial separation was slightly displaced from the transition state to an AB bond distance of 0.8136. This gives an estimated activation energy of 0.262 kcal/mol. In the other direction AB was set to 0.8126 kcal/mol and for the reaction HF + H --> H2 + F, the activation energy was estimated to be 30.27 kcal/mol, from the graph in figure 11. In both cases, the transition state was found to be at -103.752 kcal/mol.
Good--Sw2711 (talk) 09:57, 1 June 2018 (BST)
Reaction Dynamics
Setting AB =2 and BC = 0.74 with P(AB) = -2 and P(BC) = -5 lead to a successful reaction H2 + F --> HF + H.
In light of the fact that energy is conserved, discuss the mechanism of release of the reaction energy. How could this be confirmed experimentally?

The energy released during the exothermic reaction is converted into kinetic energy, in the form of translational and vibrational motion. The momentum/time graph in figure 12 shows the oscillation of the HF molecule after formation dramatically increase. This is a major energy sink for this reaction. This could be experimentally confirmed by measuring the temperature increase of the reaction vessel as the reaction proceeds.
Good. A minor point is that, you could have added one more sentence explaining the relationship between the kinetic energy and the heat. -> That's why you are measuring the temperature. --Sw2711 (talk) 10:11, 1 June 2018 (BST)
Discuss how the distribution of energy between different modes (translation and vibration) affect the efficiency of the reaction, and how this is influenced by the position of the transition state.
For H2 + F --> HF + H
For HF + H --> H2 + F
Polanyi's rules tell us that if a reaction proceeds through an early transition state (i.e. it is exothermic), translational energy of the reactants is required for reaction efficiency. Late transition states, characteristic of endothermic reactions, on the other hand, require vibrational energy to ensure reaction efficiency. The H2 + F --> HF + H reaction is exothermic, so we expect an early transition state, and expect large translational energy to equate to a successful reaction. This is indeed what is observed, with most of the unsuccessful reactions having reactants undergoing large oscillations.
In the reverse reaction, we expect high vibrational energy to favour the late transition state. Again, these rules are well adhered to, with those reactions that display considerable vibrational energy of reactants often being successful. It was, however, possible to find cases where the outcome is the opposite of that predicted by Polanyi's rules, hence they serve as a guideline.[2]
This part is good--Sw2711 (talk) 10:12, 1 June 2018 (BST)

