MRD:JFG17 01347171
Molecular Reaction Dynamics Laboratory
Question 1 - On a potential energy surface diagram, how is the transition state mathematically defined? How can the transition state be identified, and how can it be distinguished from a local minimum of the potential energy surface?
A transition state is widely considered to be the point of maximum energy in a given reaction. As such, it is clear that the mathematical definition of a transition state should be inclusive of a description of a local maximum. However, to describe the true transition state on a potential surface, there must also be a local minimum at the very same point as the said local maximum; the transition state on a potential energy surface is a saddle point.
I sense confusion here. The transition state - as a first order Saddle point - is neither a local minimum nor a local maximum. You can think of it as a maximum in the direction of one coordinate and a minimum in all the others (hence 'first order'...).Fdp18 (talk) 08:14, 12 May 2019 (BST)
With respect to the systems under consideration:
If V(r1) > 0 ; there is a local minimum wrt. r1.
If V(r1) < 0 ; there is a local maximum wrt. r1.
OK I just realised that you intended to write V''(r1). Take a look at my wiki source code - the problem is that the two ' are not visible since wiki thinks that you want to use italics. Nevertheless, it is preferable to use the d/dx notation, which is more common in chemistry. You can also, for the sake of simplicity, use the fx to write df/dx in line with your second derivates below, but then you should define it somewhere.Fdp18 (talk) 08:20, 12 May 2019 (BST)
However, a potential energy surface is a multi-variable function: a function of both r1 and r2. As such, the second derivative test should be used to confirm that the point under consideration (eg:(rx,ry)) is a true saddle point, not just a local max/min.
Defining the function D as the discriminant for this test:
D(r1,r2) = Vr1r1(r1,r2)Vr2r2(r1,r2)-(Vr1r2(r1,r2))2
Where do you have that from? A reference would be nice. Also, if i see it correctly, then this gives you every saddle point, including the higher orders. On top of that, you missed the important additional criterion that the point you are looking at has to be stationary. Think back to curve sketching in secondary school - you need that "f'(x)", too. Just that in more dimensions you have more derivatives, and that the second derivative becomes the hessian.Fdp18 (talk) 08:26, 12 May 2019 (BST)
If D < 0, the selected point (rx,ry) is a true saddle point - the transition state of the potential energy surface.
If D > 0, the selected point is only a local max/min.
Question 2 - Report your best estimate of the transition state position (rts) and explain your reasoning illustrating it with a “Internuclear Distances vs Time” plot for a relevant trajectory.
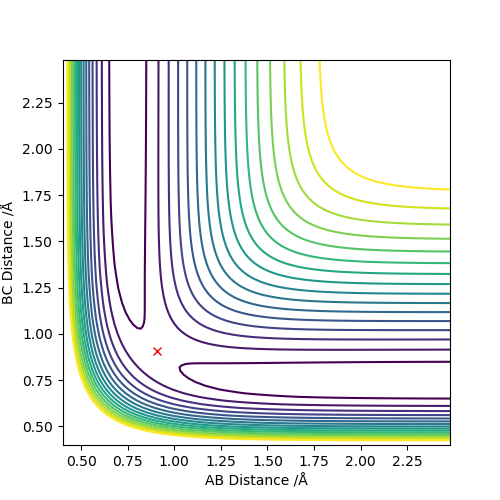
The transition state of the (H-H, H) system is found at approximately r1 = r2 = 0.90775 Angstrom.
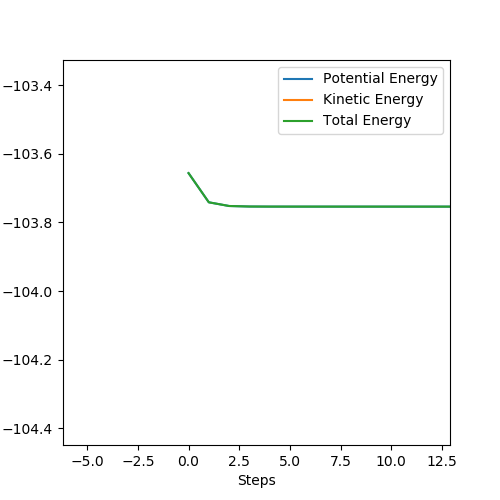
The internuclear distance vs time graph demonstrates that from the starting point of (0.90775, 0.90775), internuclear distance does not change with time. This indicates that the system is completely stable at this point. There is no propensity for the atoms to move because the gradient of the potential energy surface is zero, in all directions - this is a saddle point and as such can be determined as the TS. (Note: AB and BC) are overlayed in this graph.
I a missing the explanation of 'your reasoning' here. How did you arrive there? What did you use?Fdp18 (talk) 08:30, 12 May 2019 (BST)
Question 3 - Comment on how the mep and the trajectory you just calculated differ.
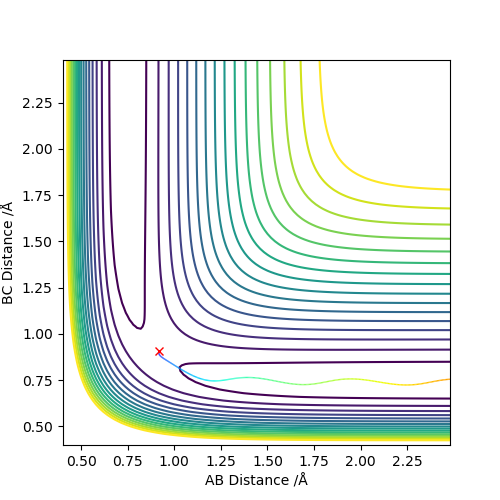
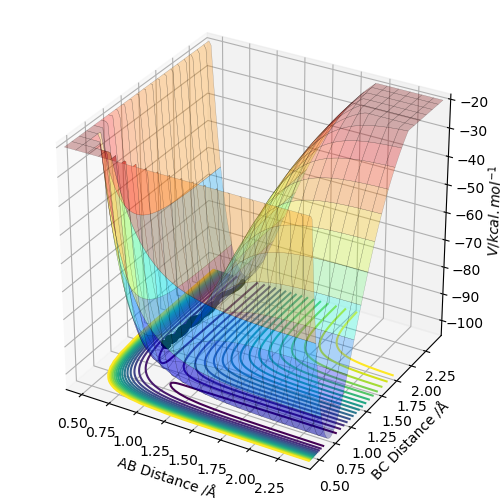
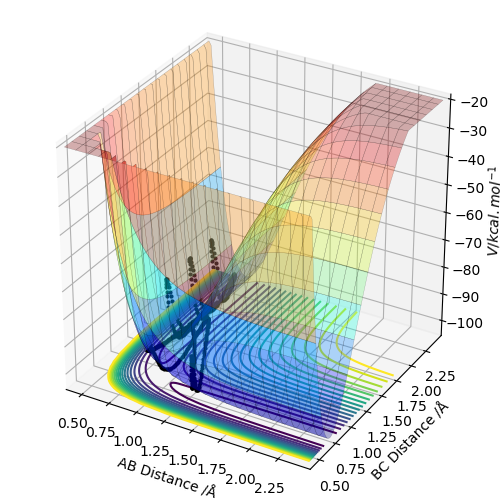
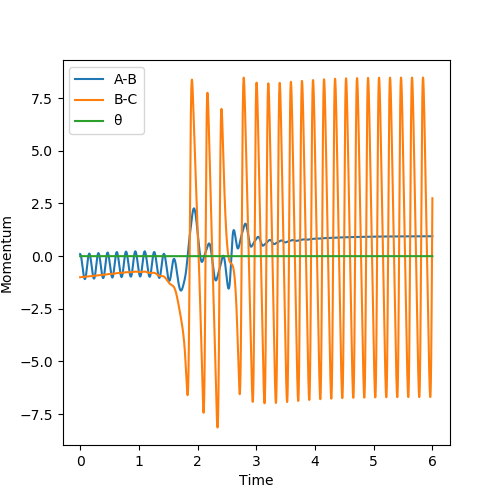
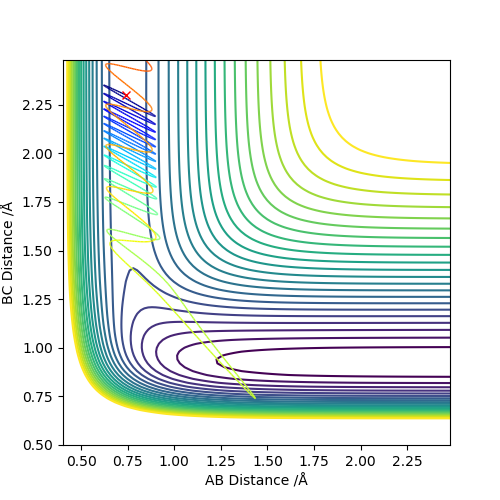
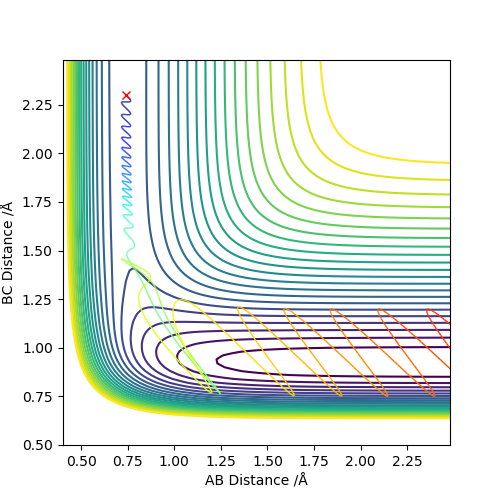
In a dynamic calculation, momentum is carried over from step to step. As such, vibrations in the bonded hydrogen atoms are visible because energy is carried forward. In the mep calculation, momentum is not carried forward from step to step. This causes any oscillations that would be present in the HH bond to become 'invisible' because each the calculation does not consider momentum. The mep calculation serves well to find energy minima because momentum is not carried forward by steps and only the gradient of the surface is considered - once a minimum is reached, there is no momentum to carry on past the well.
The visibility of oscillations in the two different calculation types can be seen in the images below - it can be seen that there is no oscillation in the mep calculated plot.
Question 4 - Complete the table above by adding the total energy, whether the trajectory is reactive or unreactive, and provide a plot of the trajectory and a small description for what happens along the trajectory. What can you conclude from the table?
The data in the table demonstrates that energy is not the only factor that determines whether this reaction occurs. In the fourth example in the table for example, there are momenta values but an unreactive calculation.
Question 5 - State what are the main assumptions of Transition State Theory. Given the results you have obtained, how will Transition State Theory predictions for reaction rate values compare with experimental values?
A key assumption usually associated with TS theory is that once the TS has been reached/overcome, the reaction will necessarily result in products. However, as exhibited under the fourth set of conditions in the table above, the TS can be overcome but momenta distribution between atoms can take the system back to reactants.
A second assumption of TS theory is that the system of species (reactants/TS/products) follow the Boltzmann distribution. However, when a particularly shortlived TS species is involved, it cannot populate the Boltzmann distribution properly. This could cause a discrepancy in calculated and observed reaction rates.
References for your statements? Where do you have them from? Another important assumption is missing. One that has something to do with the relative masses of electrons and nuclei.Fdp18 (talk) 08:35, 12 May 2019 (BST)
Question 6 - By inspecting the potential energy surfaces, classify the F + H2 and H + HF reactions according to their energetics (endothermic or exothermic). How does this relate to the bond strength of the chemical species involved? Locate the approximate position of the transition state. Report the activation energy for both reactions.
Bond energies: HH bond: 436 kJmol-1 HF bond: 569 kJmol-1
Where do you have these energies from? Are they from calculations? Measurements? Bear in mind that even if you measured or calculated them yourself, you have to explain or quote yourself, otherwise you are self-plagiarising.Fdp18 (talk) 08:37, 12 May 2019 (BST)
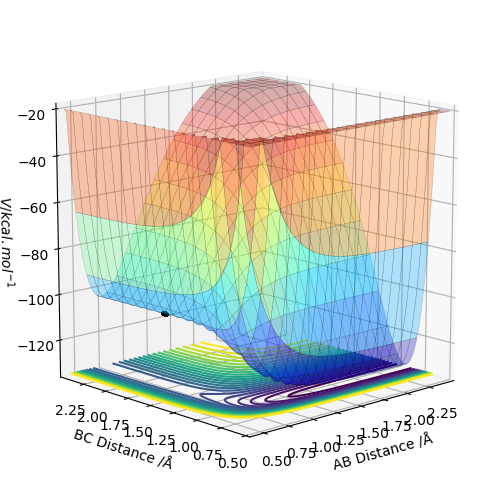
Using these values, it is predicted that the reaction from the (H-H, F) system to the (H, H-F) system will be exothermic; breaking the HH bond and making the HF bond corresponds to a reaction energy of -133 kJmol-1. This prediction is confirmed by the shape of the potential energy surface for the reaction, shown below. There is a clear drop in potential energy from the (H-H, F) system to the (H, H-F) system.
The z axis of the surface, the energy axis, clearly exhibits a higher energy system whilst the AB distance is approx. 0.75 A. In this calculation, the AB distance corresponds to a bonded pair of Hydrogen atoms. When this HH bond is broken, AB (HH) distance increases and BC (HF) distance decreases, the product region of the graph is entered and this can be seen to be lower energy.
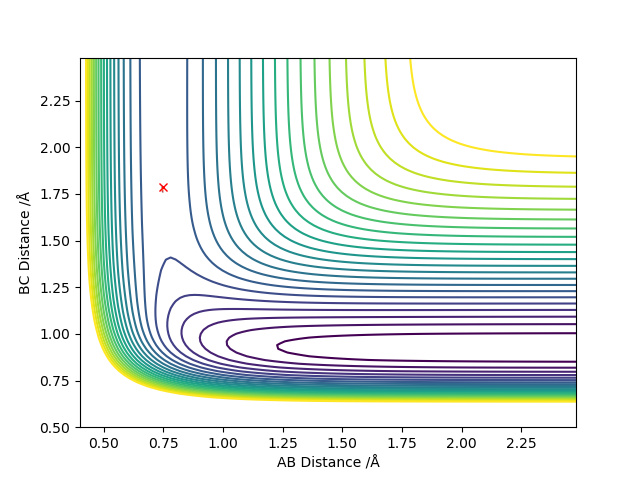
The transition state of the surface can be found at approximately (AB,BC) = (0.746 Angstrom ,1.789 Angstrom). Using Hammond's postulate helps to locate this TS as close to the (H-H, F) system because the reaction is exothermic and thus an early TS can be expected.
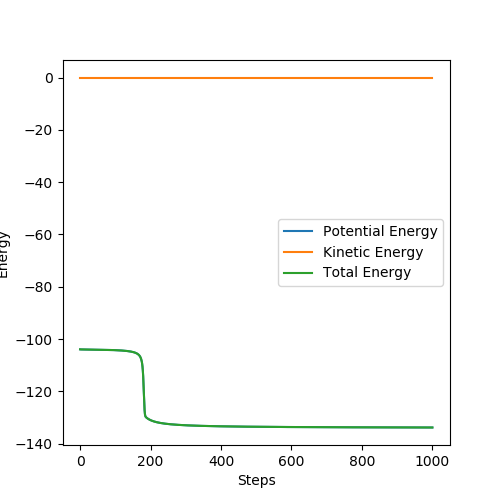
By using the mep calculation type to find the energy minima for the reactants and products regions, the energy difference between these minima and the TS can be calculated. As such, the activation energy for the exothermic and endothermic reactions can be calculated.
Using this method, the following activation energies were calculated:
Exothermic activation energy: approx. 0.1 kcalmol-1
Endothermic activation energy: approx. 28.5 kcalmol-1
The following energy vs time plots exhibit these activation energies visually.
(Bond energy reference: https://en.wikipedia.org/wiki/Bond-dissociation_energy.)
There it is. It is sensible to include the reference directly where you use the values. And, even better, use a proper reference.[1]Fdp18 (talk) 08:43, 12 May 2019 (BST)
Question 7 - In light of the fact that energy is conserved, discuss the mechanism of release of the reaction energy. Explain how this could be confirmed experimentally.
By establishing a reactive pathway from (H-H, F) to (H, H-F), the mechanism of the release of energy can be examined. Because the reaction is exothermic, the potential energy of the products is lower than the reactants. However, energy must be conserved and so the energy released by the reaction must adopt another form. The energy vs time graph shown below confirms that total energy remains constant, and that potential energy is reduced in the reaction. It also shows that excess energy is released as kinetic energy. Examining the momentum vs time graph helps to confirm that the energy is released into large vibrations in the HF bond in the products - kinetic energy.
I think you forgot the experimental confirmation part. There is actually a quite nice application.[2] Fdp18 (talk) 08:49, 12 May 2019 (BST)
Question 8 - Discuss how the distribution of energy between different modes (translation and vibration) affect the efficiency of the reaction, and how this is influenced by the position of the transition state.
Polanyi's rules theorise that for an early TS (an exothermic reaction), translational energy is effective for overcoming the TS and producing a reaction. Vibrational energy of a bond, for example in the AB (HH) bond, has very little effect on the ability of the system to overcome the TS barrier and complete the reaction. For a late TS (an endothermic reaction), the opposite set of ideas apply.
Considering Polanyi's rules for the exothermic reaction with a late TS, we can expect that increasing the vibrational energy of the AB (HH) bond will be ineffective for overcoming the TS and resulting in products. This is demonstrated in the plots below, which XXX.
In plot 1, AB momentum = -3 and BC momentum = -0.5. In plot 2, AB momentum = -3 and BC momentum = -0.8. Comparing to plot 1 shows the effect of increasing the magnitude of momentum in the BC distance (translational energy; effective). In plot 3, AB momentum = 0.1 and BC momentum = -0.8. Comparing with plot 2 shows the effect of decreasing the magnitude of the AB (decreased vibrational energy; little effect on reactivity).
Polanyi's rules are certainly supported by the evidence provided for the exothermic reaction - that translational energy has a tremendously greater effect on the successful reactivity of am exothermic reaction than does vibrational energy.
nice explanation and good examples. Even more impressive if you'd provided an example where you start with HF and managed to get it uphill to H2. Tip to more easily find starting conditions for that: a good MD trajectory is time reversible. Fdp18 (talk) 08:58, 12 May 2019 (BST)
Similarly considering the rules for the endothermic reaction with a late TS, we can expect that increasing the vibrational energy of the BC (HF) bond will be effective in producing a reactive pathway.
Reference for Polanyi's Rules: Zhang, Z., Zhou, Y., Zhang, D., Czakó, G. and Bowman, J. (2012). Theoretical Study of the Validity of the Polanyi Rules for the Late-Barrier Cl + CHD3 Reaction. The Journal of Physical Chemistry Letters, 3(23), pp.3416-3419.
here the reference section. It is so nice that wikis have this convenient built-in referencing system, so feel free to use it. It adds value to your reports at almost no expense. Fdp18 (talk) 08:44, 12 May 2019 (BST)
- ↑ The inorganic wiki page!
- ↑ Cite error: Invalid
<ref>tag; no text was provided for refs namedthefluorinelaser

