MRD:JC5516
Molecular Reaction Dynamics
H + H2
1.What value do the different components of the gradient of the potential energy surface have at a minimum and at a transition structure? Briefly explain how minima and transition structures can be distinguished using the curvature of the potential energy surface.
A potential energy surface models how the potential energy of a reaction alters with changing interatomic coordinates. At the transition state the potential energy surface is at a saddle point where the gradient and partial derivatives with respect to r1 and r2 are equal to 0 along the reaction trajectory, the reaction minima too have a gradient of 0. The minima and transition state can be differentiated by calculating the second derivatives at the respective reaction coordinates. Any minima will have a positive second derivative or the Hessian is will be positive definite, any saddle points will have positive and negative eigenvalues for the Hessian.
Ng611 (talk) 15:38, 1 June 2018 (BST) You should illustrate what r1 and r2 are with a diagram of the PES.
2.Report your best estimate of the transition state position (rts) and explain your reasoning illustrating it with a “Internuclear Distances vs Time” plot for a relevant trajectory.
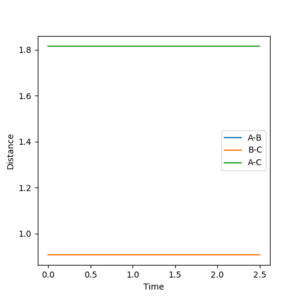
Initially the transition state for the reaction of H2 + H = H + H2 can be approximated by assuming the inter-nuclear distances between two non exchanged hydrogen atoms to be equal at the transition state during a reaction. this can be done as the potential energy surface is symmetrical (reactants and products have the same energy).The transition state for the reaction is thought to occur when the inter-nuclear distances are at 0.9078 angstrom. in the figure below the it can be seen that there is no oscillation of the internuclear distance at 0.9078 angstrom which indicates an energy minimum has been achieved for when r1=r2, this corresponds to the transition state along the lowest energy reaction trajectory as the bond lengths are effectively constant, the momenta are also set to zero in this instance.
3.Comment on how the mep and the trajectory you just calculated differ.
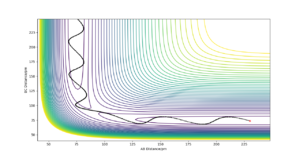
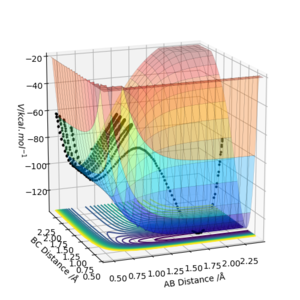
The reaction pathway (MEP) proceeds along the valley floor from the transition state to the products(Figure 2). The MEP trajectory does not show oscillating motion along the potential energy surface as the velocity is reset to zero at each step in the calculation of the pathway. In the dynamic calculation of reaction trajectory, oscillation is observed along the potential energy surface valley to the products (Figure 3). As the potential energy decreases away from the transition state it is converted to vibrational and translational kinetic energy in the products, this is why oscillation is observed in the dynamic calculation.
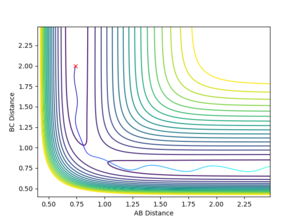
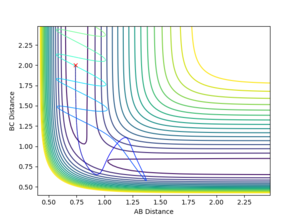
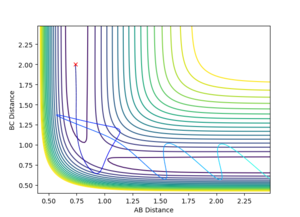
4.Complete the table by adding a column with the total energy, and another column reporting if the trajectory is reactive or unreactive. For each set of initial conditions, provide a plot of the trajectory and a small description for what happens along the trajectory.
| p1 | p2 | total energy | reactive? |
|---|---|---|---|
| -1.25 | -2.5 | -99.018 | Yes |
| -1.5 | -2.0 | -100.456 | No |
| -1.5 | -2.5 | -98.956 | Yes |
| -2.5 | -5.0 | -84.956 | No |
| -2.5 | -5.2 | -83.416 | Yes |

5.State what are the main assumptions of Transition State Theory. Given the results you have obtained, how will Transition State Theory predictions for reaction rate values compare with experimental values?
In transition state theory there are 2 general and 3 unique assumptions. The first is that the the motion of electrons is independent of the motion of the nuclei (Born Oppenheimer approximation), the second is that the reactant molecules energy state distribution follows that predicted by the Maxwell Boltzmann distribution. The first unique assumption is that once the molecular system has crossed over the transition state toward the products it cannot then revert to the reactants by crossing back over, in cases 4 and 5 the experimental data clearly contradicts this assumption as the transition state is passed multiple times. The second unique assumption is that when a transition state occurs, motion along the reaction coordinate is independent of all other motion in the molecule and can be assumed to be classical translational motion. The final assumption is that the transition states passing through to products have state populations distributed in accordance with the Maxwell Boltzman distribution despite any reaction equilibrium [1] . The model fails to account for experimental data as tunneling through the potential energy surface to bypass the transition state is not considered.
Ng611 (talk) 15:39, 1 June 2018 (BST) ...And because TS recrossing is not accounted for. Of tunnelling and TS recrossing, which do you think is the more significant of the two?
H + HF
PES inspection
6.Classify the F + H2 and H + HF reactions according to their energetics (endothermic or exothermic). How does this relate to the bond strength of the chemical species involved?
F + H2 is an exothermic reation as the energy of the product HF and H molecules are deeper in energy than the reactants, this is illustraed in Figure 4. This means that the energy released from the formation of the new bonds outweighs the energy taken in to break the reactant bonds, this equates to the new bonds being deeper in energy and hence stronger,
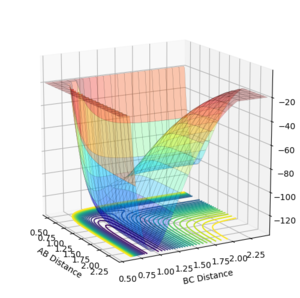
HF + H is an endothermic reaction as the energy of the products is higher in energy than that of the reactants, thus more energy is taken in to break bonds than is released from forming new ones in the products, this indicates a weaker HH bond strength compared to HF. This is backed up in the literature with H-H at 432 kJ/mol and H-F at 565 kJ/mol. [2]
7.Locate the approximate position of the transition state.
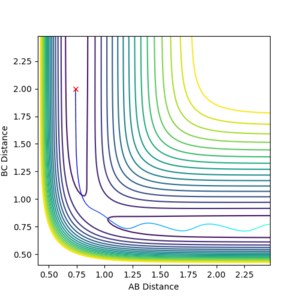
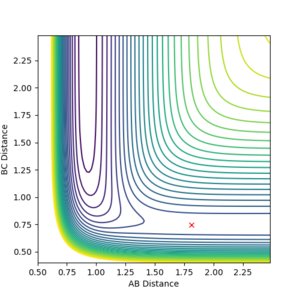
The transition state for HF + H was estimated to be at r1= 0.7447 and r2= 1.8109, as this reaction is endothermic Hammond's postualte can be evoked to reveal a late transition state that resembles the products. from those coordinates a trial and error approach can be undertaken to find the transition state through the same method used earlier. The transition state for F + H2 was estimated to be at r1= 1.81095 and r2= 0.74454 which confirms that the transition state for both reactions share the same coordinates but are just reversed. Figure 15 shows the transition state location on a contour map.
8.Report the activation energy for both reactions.
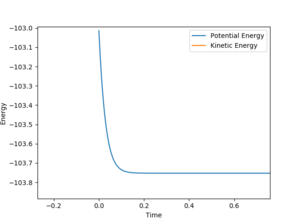
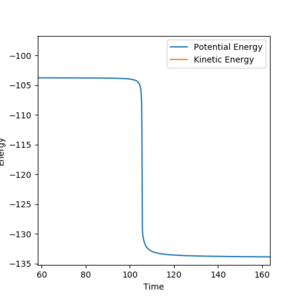
the activation energy for the reaction was found by nudging the reaction coordinates towards the reactants from the transition states such that the reactants are formed, the energy of this process is the activation energy. The value of the activation energy can be calculated by looking at a plot of energy vs time for this process. For F+H2 the activation energy was +0.733 kcal/mol where AB= 1.81095 , BC= 0.79 (figure 5). For HF + H the activation energy was found to be -30.144 kcal/mol AB= 1.81095 , BC= 0.73 ( atom A = F atom B/C =H)(figure 6).
Reaction dynamics
9.In light of the fact that energy is conserved, discuss the mechanism of release of the reaction energy. How could this be confirmed experimentally?
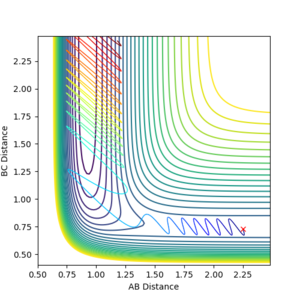
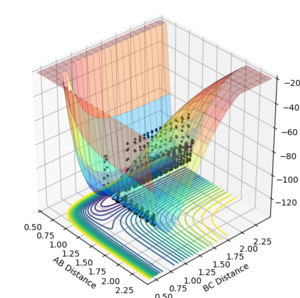
The reactive trajectory plotted in figure 7 for F + H2 the reactive trajectory had an AB distance of 2.25 angstrom , a BC distance of 0.73 angstrom, the AB momentum was -1.2145 kgm/s and the BC momentum was -2.1 kgm/s ( Atom A was F and atoms B/C were H). In the potential energy surface and the plot of internuclear distances ( figure 8) it can be seen that the oscillatitary motion of the formed HF molecule is greater than the H2 recatant oscillation indicating that the potental energy lost in the exothermic process has been converted to kinetic energy in the vibrations of the molecule. The excited vibrartional state would then relac down to the vibrational ground state to release heat energt. This is in accordance with the conservation of energy and can be seen in the energy vs time plot where the sum of kinetic and potential energy is always constant. Experimentally the energy convereted will be lost from reaction system as heat energy, this can be measured via the use of a calorimter.
Ng611 (talk) 15:41, 1 June 2018 (BST) Yes but a calorimeter only measures changes in the average KE. What technique could you use to distinguish between vibrational and translational KE?
10.Discuss how the distribution of energy between different modes (translation and vibration) affect the efficiency of the reaction, and how this is influenced by the position of the transition state.
The distribution of energy between vibrational and translational modes in reactant mleculs effects how efficient a reaction will be. The explantion comes from Polanyi's empirical rules, the rules state that having more energy distributed vibrationally will lead to a more efficient crossing of a late transition state as seen in endothermic reactions, conversely having more energy distributed translationaly will promote more efficent crossings of early transitions states (i.e where the transition state more closely resembles the rectants) as seen in exothermic reactions.
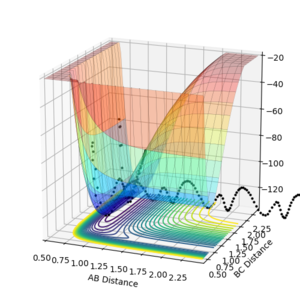
Polanyi's rules can be applied to the two reactions studied earlier (HF + H and F + H2). In the HF + H potential energy surfaces plotted below it can be seen that when the reactants have a higher vibrational energy there is a more efficient crossing of the late transition state (as predicted from the endothermic nature of the reaction). When the vibrational energy is set to a large value the reaction proceeds over the transition state (Figure 9,AB momentum=-8, BC momentum =-2), however at low vibrational energies the reaction does not occur despite variatons in the translational energy (figures 10,AB momentum=-8, BC momentum =-0.3 and figure 11, AB momentum=-0.3, BC momentum =-0.3 ).


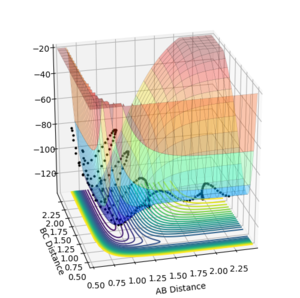
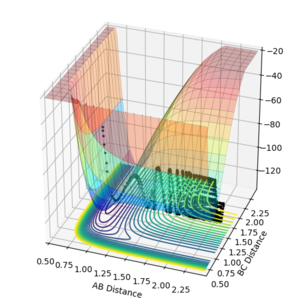
The opposite is observed in the reaction of F + H2 where a large transtional energy leads to a successful crossing of the transiton state (figure 12,AB momentum=-6, BC momentum =-0.3 ) and a low translational energy does not (Figures 13,AB momentum=-0.3, BC momentum =-5 and figure 14, AB momentum=-0.3, BC momentum =-0.3).

Ng611 (talk) 15:44, 1 June 2018 (BST) Overall, a very good report. You should aim to structure your work more as a 'report' rather than simply answering the questions. Also take care regarding your choice of experimental method -- think carefully about what information your experiment would give you.
