MRD:IM915
Theory of Molecular Dynamics
Chemical reactions can be simulated by assuming motion of particles follows Newton's laws of motion (as atom mass is large enough to ignore relativistic effects without causing too great an error, although this neglects quantised vibrational effects), and describing their relative motion. Interatomic interactions govern the relative motion of particles and can be expressed as a potential energy surface V(r1,r2,....rn-1) where n is number of particles. In diatomic systems this is simply the potential energy curve described by the Lennard-Jones potential V(r), where r is the interatomic distance. Force will depend on the derivative with respect to time of the potential - therefore the force on the system will equal 0 at turning points (minima or maxima in the 2D case).
Diatom collisions can be studied using a 3D potential energy surface, where for the reaction A + BC → AB + C, the surface is defined by V(r1,r2) where r1 is the distance between A and B, and r2 is the distance between B and C. Initially, the distance r1 will be large and will decrease as molecule A approaches BC, while r2 will remain relatively constant, oscillating around the equilibrium bond length due to vibrational energy. After the reaction, r1 will now be small as the bond AB has been formed, while R2 will be large and increasing as atom C moves away from AB. During the reaction, the system will pass through a transition state A--B--C, which will be a saddle point on the potential energy surface in the minimum energy path (i.e. from one minimum energy channel at equilibrium bond length to the other).[1]
As the triatomic system is expressed as a 3D surface, calculating the minima (equilibrium bond lengths) and the saddle point (transition state) is more complicated than for the simple 2D case. For a 3D surface, a stationary point is where the gradient in all directions is zero.
Stationary points on a surface can be many types, however the most common are minima, maxima, and saddle. These can be differentiated from each other using a second derivative test.
For a maximum point; and
For a minimum point; and
For a saddle point;
(Very nice writeup! Well done. Fjs113 (talk) 17:58, 3 June 2018 (BST))
H + H2 system
Potential Energy Surface
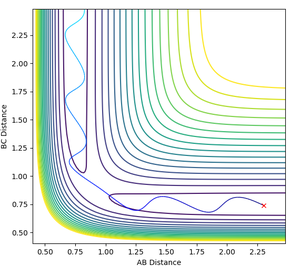
The potential surface was generated for the H + H2 system. As the start and end products of the reaction are the same, the surface plot is perfectly symmetric. Plotted on the surface is the reactive trajectory for the initial conditions chosen (r1 = 2.3, r2 = 0.74, ρ1 = -2.7, ρ2 = 0). The surface is shown as both a contour plot and a 3D surface plot.
 |
|
| Surface plot for H + H2 | Contour plot for H + H2 |
Determining the Transition State
Finding the transition state requires finding the saddle point between the two minima channels of the start and end products. As the system is totally symmetric, in the transition state r1 = r2. The transition state can be determined by testing the trajectory for different values of r1, keeping both initial momenta equal to 0. As on the saddle point there is no gradient at right angles to the ridge, on the transition state ridge the trajectory will oscillate on the ridge but not 'fall off' into either product or reactant channels. At the exact transition state, there will be no oscillation and the trajectory will remain constant.
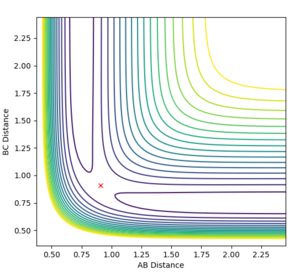
Using a simulation with 1000 steps, the transition state was determined to be at r1 = r2 = rTS = 0.90774 Å. At this rTS, the trajectory does not fall down to either products or reactants, and the graph of Internuclear Distances vs Time shows no oscillation and is a straight line.
 |
 |

|
| Surface plot showing transition state | Contour plot showing transition state | Plot of Internuclear Distances vs Time |
Comparison of dynamics and mep
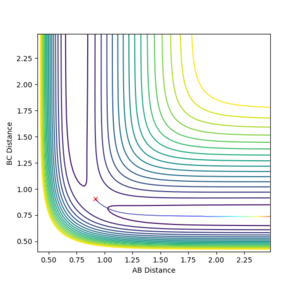
The mep (minimum energy path) is a trajectory corresponding to infinitely slow motion. By setting the initial conditions to slightly displaced from the transition state (r1 = rTS + 0.01, r2 = rTS, the minimum energy path can be plotted.
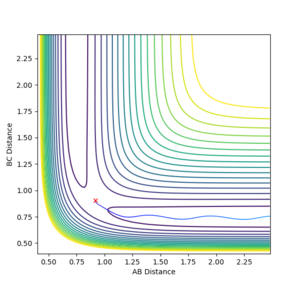
The mep does not provide a realistic account of motion of atoms in a reaction- using the dynamics calculation type, mass of atoms (and therefore inertial motion) can be taken into account. The same initial conditions were used for a dynamics simulation as used for the mep.
 |
|
| Contour plot of the minimum energy path | Contour plot of the dynamics calculated trajectory |
The differences are best seen in the contour plot- the mep simply follows a straight path along the bottom of the channel, wile the dynamics trajectory results in an oscillation in the final trajectory so it oscillates up and down the sides of the product channel.
 |

|
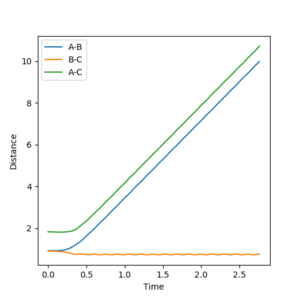
| Intermolecular Distances vs Time | Intermolecular Momenta vs Time |
Trajectories
The final value of r2 oscillates around r2 = 0.74 Å, which is the equilibrium bond length for the H-H molecule formed. The final value of r1 = 9.01 Å, although this value is steadily increasing and will continue to increase as the newly formed H-H molecule and H atom move away from each other.
The average momentum ρ2 oscillates around roughly ρ2 = 1.24, while ρ1 is constant at ρ1 = 2.48.
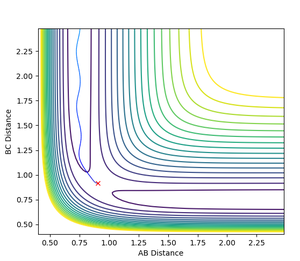
If the inital conditions were swapped (i.e. r1 = rTS and r2 = rTS + 0.01), the final values for r1 and r2 would be swapped, as would the momentum values. The trajectory would be down the other channel, i.e. the bond formed would be AB rather than BC- the starting point of the trajectory would be offset from the transition state towards the other channel from that of the first set of conditions.
|
| Dynamics for swapped initial conditions |
Using the final positions of the previous trajectories as the new initial positions, and using the final momenta as initial momenta with reversed sign, a new simulation was run. This simulation shows a trajectory that reaches almost the top of the transition state but does not have enough energy to make it over the barrier- it returns to the point at which the previous trajectory was started (slightly post barrier) before falling back down to the starting channel.
 |

|
| Trajectory | Distance vs Time |
Reactive and Unreactive Trajectories
From previous calculations it can be concluded that trajectories with initial conditions in the range r1 = 0.74 Å, r2 = 2.0 Å with -1.5 < ρ1 < -0.8 and p2 = -2.5 are reactive. Hypothetically all trajectories with the same initial positions and higher momenta would be reactive as they possess enough kinetic energy to overcome the activation barrier.
Transition state theory and it's limitations
Transition state theory is a highly useful tool for analysis of chemical reaction dynamics. Also referred to as activated complex theory, it provides a way to relate rate constants of reactions to models of the cluster of atoms formed when reactants come together (the transition state / activated complex) and the rate at which this transition state is formed.[2]
The main assumptions of transition state theory are;
• Intermediates are long-lived and reach a Boltzmann distribution of energies before continuing to the next step of the reaction. Short-lived intermediates result in deviations from transition state theory.
• Atomic nuclei follow newton's laws of motion and can be described by classical mechanics. This ignores quantum tunneling effects (especially for reactions with low energy barriers (low activation energy) as tunneling probability is higher for lower barrier heights). Classical mechanics also ignores the quantisation of vibrations.
• The reaction is carried out at low temperature. At high temperatures, molecules have a large amount of vibrational energy and can proceed via transition states far from the lowest energy saddle point, resulting in very different trajectories to those predicted.
Transition state theory will compare best with experimental values when activation energy of the studied reactions is high (to reduce tunnelling effects), when the transition state is long-lived (slow reactions), and when the reaction is carried out at a low temperature.
(Very good! One more thing is important: TST ignore barrier recrossing effects, which you can see happening in the previous question in cases 4&5. This will lead to overestimating the reaction rate. Fjs113 (talk) 17:58, 3 June 2018 (BST))
F-H-H system
Potential Energy Surface
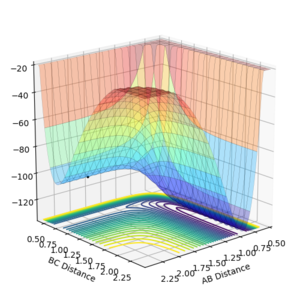
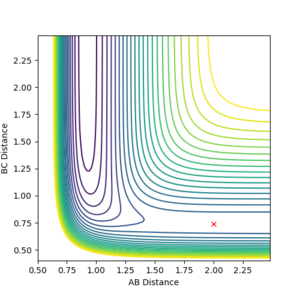
The potential surface was generated for the F-H-H system. The surface is shown as both a contour plot and a 3D surface plot. (AB = H-F, BC = H-H)
 |
|
| Surface plot for F-H-H system | Contour plot for F-H-H system |
The energy of the AB bond channel is lower than the energy of the BC bond channel- i.e. the energy of the system with an H-F bond and lone H is lower than that of the system with an H-H bond and lone F. Therefore it can be concluded that the reaction F + H2 → F-H + H is exothermic, while the reverse reaction F-H + H → F + H2 is endothermic. Therefore the H-F bond is stronger than the H-H bond as the forward reaction is exothermic. This is due to the high electronegativity of fluorine resulting in a polar bond with a great amount of ionic character.
Locating the Transition State
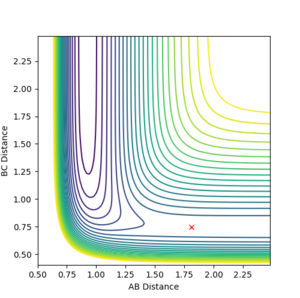
This reaction is asymmetric therefore the transition state is harder to find than for the symmetric H + H2 system. As the activation energy of the forward reaction is so low, the transition state will be an early transition state and thus by Hammond's postulate the transition state will be very similar to the reactants i.e. the H-H distance (r2) will be very close to equilibrium bond length while the H-F distance (r1) will be far larger than the equilibrium bond length.
By observation of the potential energy surface, an initial guess could be made for the location of the transition state. By then adjusting the distances r1 and r2 the transition state was located as the initial conditions which did not result in any change in trajectory. A dynamics simulation with 1000 steps was used to determine the position at which the trajectory remained constant and did not fall down into either the product or reactant channels, and internuclear distances did not oscillate. The transition state was determined to be at r1 = 1.8107 Å and r2 = 0.745 Å.
 |
 |

|
| Surface plot showing transition state | Contour plot showing transition state | Plot of Internuclear Distances vs Time |
Determining activation energies
The activation energy for each reaction can be determined by calculating the difference in energy between the transition state and either the product or reactants. The energy of the transition state is -103.752 kcal/mol.
The energy of the products and reactants can be determined by choosing a position on the potential energy surface far enough from the transition state in the relevant channel. The energy of H2 + F is found by using r1 = 10 Å and r2 = 0.74 Å and is determined to be -104.020 kcal/mol; while the energy of H + H-F is found using r1 = 0.92 Å and r2 = 10 Å and is determined to be -134.025 kcal/mol.
| System | Energy (kcal/mol) |
|---|---|
| F + H2 | -104.020 |
| F-H + H | -134.025 |
| F--H--H | -103.752 |
Therefore the activation energy for H2 + F → H + H-F is 0.268 kcal/mol and the activation energy for H + H-F → H2 + F is 30.273 kcal/mol.
Reaction Dynamics
F + H2 → F-H + H
A reactive trajectory was found for the F + H2 → F-H + H reaction using the initial conditions r1 = 2 Å, r2 = 0.74 Å, ρ1 = -0.8 and ρ2 = 0.5 (where r1 = F-H, r2 = H-H).

|

|
| Reactive trajectory for F + H2 → F-H + H | Internuclear momentum vs time |
This reaction is exothermic- energy is released in the reaction. This energy can be calculated as the difference between the energy of the reactants and products, which is equal to -30.005 kcal/mol. Therefore around 30 kcal/mol worth of energy is released in the reaction, mostly as vibrational and kinetic energy in the products- this is predicted in the trajectory which has a high vibration in the products. This increased kinetic and vibrational energy results in increased temperature of the system, so energy is dissipated as heat.
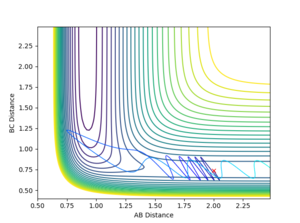
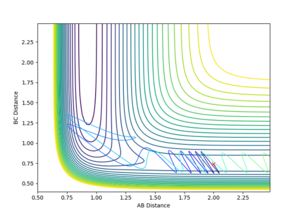
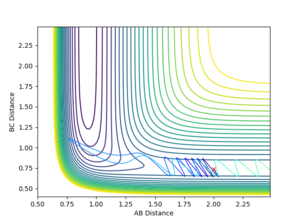
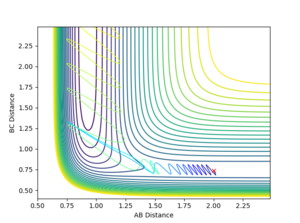
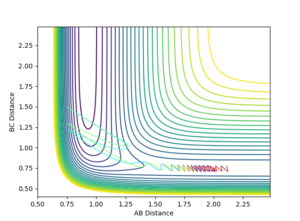
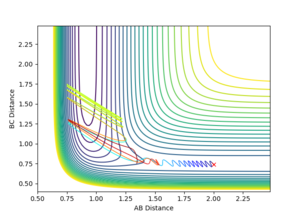
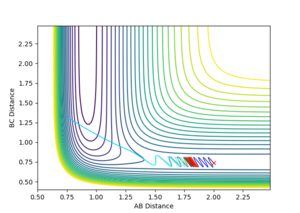
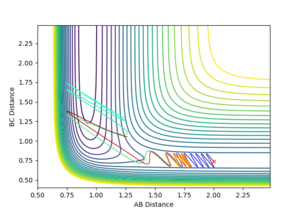
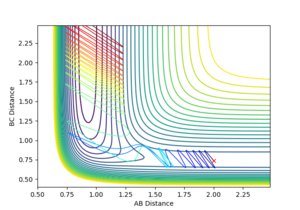
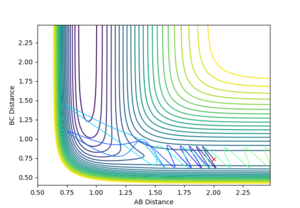
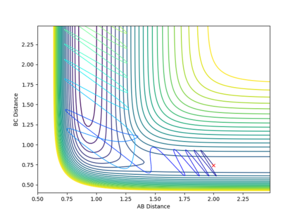
Using the initial conditions of rHH = 0.74 Å, rFH = 2 Å and ρFH = -0.5, the effect of changing ρHH within the range -3 < ρFH < 3 was investigated.
 |
 |
 |
 |
|
| ρHH = -3 | ρHH = -2.9 | ρHH = -2.5 | ρHH = -2 | ρHH = -1.5 |
 |
 |
 |
 |
|
| ρHH = -1 | ρHH = -0.5 | ρHH = 0 | ρHH = 0.5 | ρHH = 1 |
 |
 |
 |
 |

|
| ρHH = 1.5 | ρHH = 2 | ρHH = 2.5 | ρHH = 2.9 | ρHH = 3 |
Varying ρHH gives various reactive and unreactive trajectories. From -3 to -2.5, the trajectories are unreactive as they pass cross over the barrier but then cross back as the molecule is shaken apart by a large amount of vibrational motion. ρHH = -2 and -1.5 are reactive, while between ρHH= -1 and ρHH = 1.5 the trajectories are non-reactive as the trajectory crosses the barrier multiple times but finishes in the reactants channel. ρHH = 2 is a reactive trajectory but ρHH = 2.5 crosses back over the barrier and so is unreactive. ρHH = 3 is unreactive as it crosses back over the barrier after reacting and finishes in the reactants channel. A large amount of vibrational motion is needed to give a reactive trajectory : |ρHH| > 1.5
For the same initial positions, the momenta were changed to ρHH = 0.1 and ρFH = -0.8.
F-H + H → F + H2
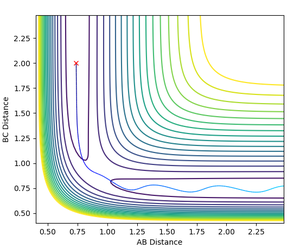
Initial conditions were chosen at the bottom of the entry channel with a low HF vibration and high HH momentum to give a reactive trajectory: rFH = 0.92 Å, rHH = 2 Å, ρFH = 0.1 and ρHH = -9.

|
| Initial conditions: high momentum, low vibrational energy |
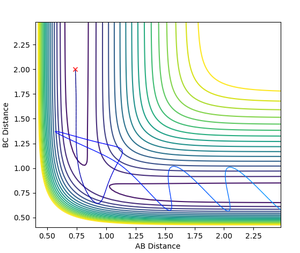
Decreasing the momentum of the incoming H atom to ρHH = -7 results in a non-reactive trajectory, however then increasing vibration of F-H to ρFH = 1.5 results in a reactive trajectory again.

|

|
| ρHH = -7, ρFH = 0.1 | ρHH = -7, ρFH = 1.5 |
Polanyi's Empirical Rules
An asymmetric reaction such as the H2 + F → H + H-F system will have an asymmetric potential energy surface and depending on the energies of each side of the system the transition state will either resemble the reactants or the products of a system (predicted using Hammond's Postulate). If the transition state resembles the reactants, the reaction is said to be an early barrier reaction; if the transition state resembles the products the reaction is said to be a late barrier reaction. For the forward reaction H2 + F → H + H-F, the transition state resembles the reactants and so this is an early barrier reaction. The reverse reaction is therefore a late barrier reaction.
In a typical chemical reaction there is both translational and vibrational energy, both of which can contribute to crossing the energy barrier. The Polanyi rules, based off theoretical studies of triatomic systems (like those studied in this report) relate the type of barrier to which type of energy is most important for crossing this barrier.
Polanyi's rules [3]
- Vibrational energy is more efficient in promoting a late-barrier reaction
- Translational energy is more efficient in promoting an early-barrier reaction
Therefore, the forward reaction will be promoted more by increasing translational energy (rFH) than by increasing vibrational energy (rHH), while the reverse reaction will be promoted more by increasing vibrational energy (rFH than by increasing translational energy (rHH).
This is seen above- for the forwards reaction a large magnitude of vibrational energy was need to give a reactive trajectory when translational energy was small, however a relatively small increase in translational energy with a low vibrational energy was sufficient to give a reactive trajectory.
(Overall, a very impressive report! Very well done indeed. Fjs113 (talk) 17:58, 3 June 2018 (BST))
References
- ↑ P. Atkins and J. de Paula, in Atkins’ Physical Chemistry, Oxford University Press, 10th edition, 2014.
- ↑ P. Atkins and J. de Paula, in Atkins’ Physical Chemistry, Oxford University Press, 10th edition, 2014.
- ↑ Z. Zhang, Y. Zhou, D. H. Zhang, G. Czakó and J. M. Bowman, Theoretical Study of the Validity of the Polanyi Rules for the Late-Barrier Cl + CHD 3 Reaction, J. Phys. Chem. Lett., 2012, 3, 3416–3419. DOI:10.1021/jz301649w

