MRD:Harry01076895
Molecular Reaction dynamics: Computational analysis
H + H2 system
Finding the transition state in and it's physical significance:
At a minimum and at a transition structure (a saddle point), the total gradient of the potential energy is 0. This is the characteristic of stationary points.
(What is 'z' here? Tam10 (talk) 14:24, 1 June 2017 (BST))
By differentiating the Potential energy, it is possible to get more information about these points. The second partial derivatives (with respect to x and y) are calculated and tested where all the points had a total gradient equal to zero (first total derivative=0). This second value will give us more information about what kind of stationary point is.
This is resumed below:
If and:
, ( is a local minimum
, is a local maximum
(You need to explain this derivative notation, as it's not clear what you are differentiating against Tam10 (talk) 14:24, 1 June 2017 (BST))
and (or and
The transition structure is the highest point along the minimum energy path, which is a saddle point when plotted in three dimensions. If placed at this point, theoretically it is only possible to oscillate up and down the sides of the saddle.
The lowest energy path of the reaction is given by a line going along the bottom of the three dimensional "source" created by the potential energy surface plot.
Estimating the transition state position:
As seen previously, the transition state is found at a saddle point where the total gradient is 0. This point is pseudo stable. If anything is placed at this point with no other forces acting upon it, or if the atoms placed with their energy equal to 0 at this point (therefore at the transition state of the reaction), they will remain there.
In the system analyzed, the initial bond length of AB and BC are both set to 1 angstrom. These parameters simulate a transition state for a system where all the atoms are the same, and the two exterior hydrogen atoms vibrated around the central one, but remaining at the transition state.
The following plot was observed:
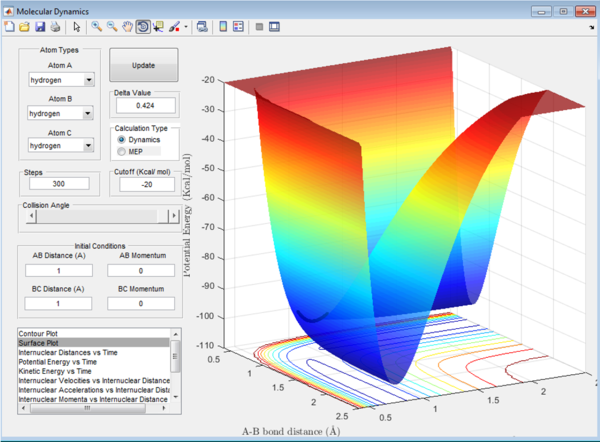
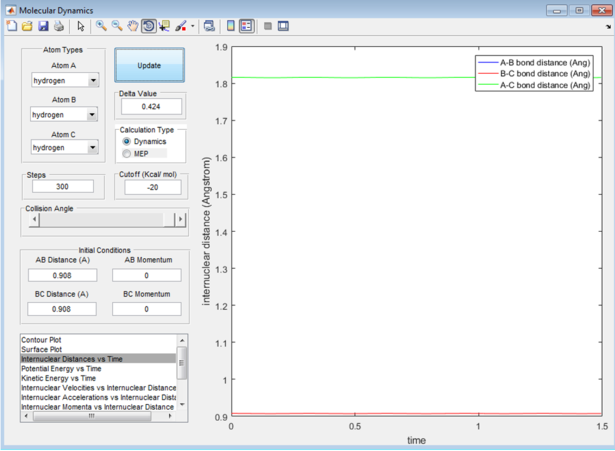
As seen previously, the energy of the transition state is always trying to minimize. To find the position where the atoms are oscillating the least, the distances are varied. A length of 0.9 angstroms significantly decreased the oscillation (see figure 2), but to be sure that this was the most accurate estimation (assuming that the energy transition state is following the lowest energy path) the internuclear distances are plotted against time in a 2 dimensional graph, readjusting the bond length to get straight lines at 0.908 angstroms (see figure 3).

Comparing with the MEP:
Figure 4 shows the dynamic variation of the potential energy with initial momentum of all hydrogen atoms set to 0 and initial internuclear distances set to r1=rts+0.01 angstroms and r2=rts.
Figure 5 shows the MEP of the system with the same initial conditions.
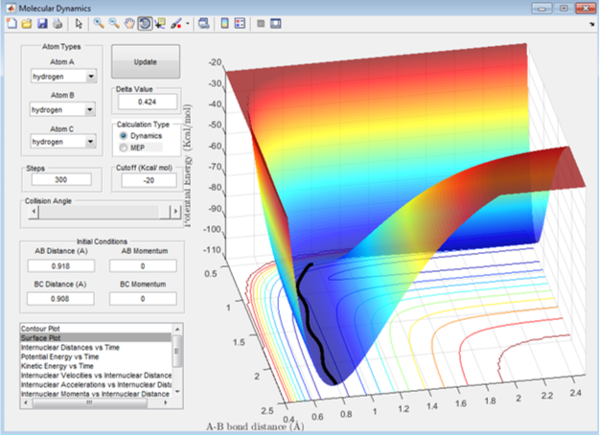
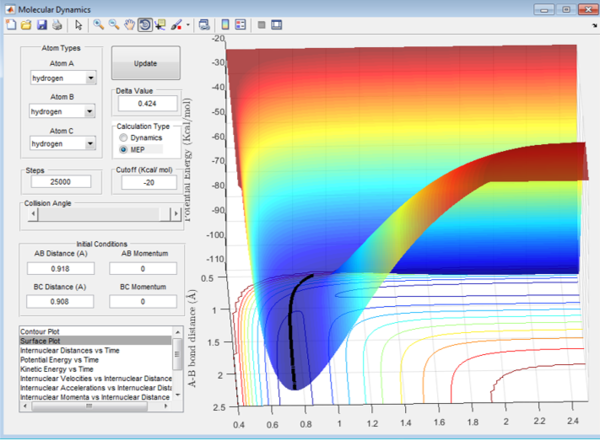
In the mep plot the velocity is always reset to 0 between each measurement. There is never any increase in momentum as the change in momentum is proportional to the change in velocity if the mass is constant (see equation below).
(Easier to just say that the momentum is just velocity times reduced mass Tam10 (talk) 14:24, 1 June 2017 (BST))
The initial offset of the bond lengths resulted in a force that was capable to displace the hydrogen from the stable transition state saddle point.
In the dynamic plot, the same force displaces it from the transition state, but the potential energy is transformed into kinetic energy making the bonds vibrate, as seen in the plot on figure 5. The vibration is repeated to ensure the conservation of energy, going between kinetic and potential (unlike the MEP plot when the energy is reset to 0 at each data point)
The reactive trajectories:
The initial conditions were varied and calculations were performed to find out if the reaction would occur. As seen in the table below, 5 different combinations of momentum were tested for a system of 1 hydrogen molecule and 1 hydrogen atom, all with bond lengths r1=0.74 and r2=2.0.
| p1 | p2 | Reactions proceeds | Figure |
|---|---|---|---|
| -1.25 | -2.5 | yes | 6.1 |
| -1.5 | -2.0 | no | 6.2 |
| -1.5 | -2.5 | yes | 6.3 |
| -2.5 | -5.0 | no | 6.4 |
| -2.5 | -5.2 | yes | 6.5 |
In all these examples, the molecule AB starts off bonded, approached by hydrogen atom C, whilst varying it's momentum.
A plot for each set of conditions is shown below:
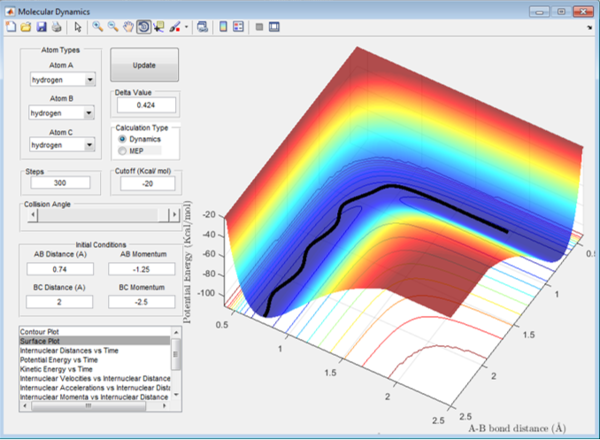
In Figure 6.1, the hydrogen molecule was approached by the hydrogen atom, the activation energy was overcome and the reaction was able to proceed. Therefore in this reaction, the initial momentum was high enough to overcome the energy barrier imposed by the transition state, and break the bond between A and B. Once the new molecule is formed, the atom A, no longer bonded, has gained in momentum and moves away from the system.

In Figure 6.2, when C approaches, it does not have enough momentum, it's energy is too weak to overcome the transition state energy, resulting in A and B remaining bonded. This is the first example where there is no reaction.
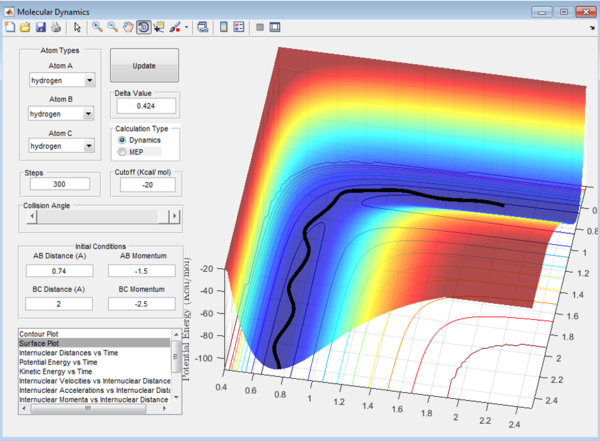
In Figure 6.3, similar to the first case, C approaches the molecule AB with enough energy to react, after the reaction AB bond is broken and A moves away.

In figure 6.4 (see above) the molecule C approaches with a relatively high momentum, and the transition state activation energy is initially overcome. But C's initial energy was to high and once bonded to B, C still has enough energy to overcome the activation energy a second time. The molecule reacts again, but this time A comes back and breaks the BC bond. Therefore a reaction did occur with this set of initial conditions, but there was no overall reaction as the products and the reactants did non change.

In Figure 6.5, similar to the previous case, the initial momentum of C is high. It has no problem overcoming the activation energy to react a first time with AB, breaking its bond and forming BC. The energy is still quite high, and just like previously the reverse reaction proceeds, but this time, even a 3rd reaction is energetically favored. So in the reaction, BC is generated, but then reacted to reproduce AB, and finally reacted again to reform the final BC molecule (product), as A continues to move away. Overall the reaction AB + C did go to BC + A.
In all these plots, it is possible to observe the vibrations of the molecule. Also a general conclusion that can be made at this point is that the the probability of overcoming the activation energy is proportional to the initial energy of the reactants, but that a higher energy does not ensure that an overall reaction proceeds.
The transition State Theory:
The transition state theory(1) is based on two important assumptions;
-the transition state and the reactants are in equilibrium, this is also know as the "local equilibrium" assumption,
-the reaction only goes through the transition state once, this is also called the "non-recrossing" assumption.
It was previously seen that the reaction could go through the transition state many times in one reaction, due to high initial momentum, for reaction in figure 6.4 and 6.5 for example.
In the case of this theory, if the transition state passed through more than once, the transition state of the overall reaction must be higher in energy. Once this transition state formed, now higher in energy than before, the energy can decay down forming the products. It was also seen that not all highly energetic atoms and molecules react. Due to the non recrossing assumption, it can be explained by the high energy transition state decaying back down to products, or possibly decaying back down to the reactants.
F - H - H system
F + H2 → H-F + H, energetics of reaction and bond strengths:
It is possible to classify the forwards and reverse reaction of F + H2 going to F-H + H as exothermic or endothermic respectively by evaluating the potential surface of the reactions.
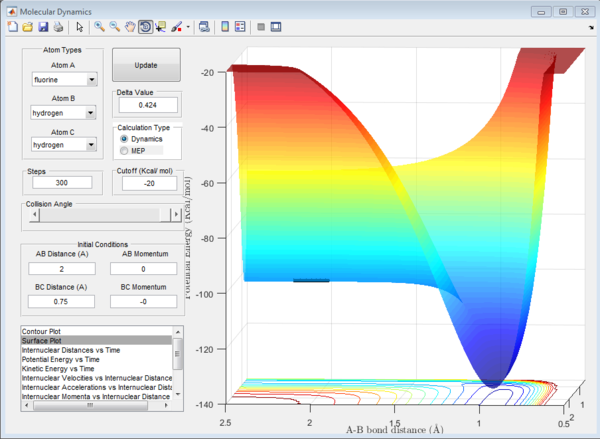
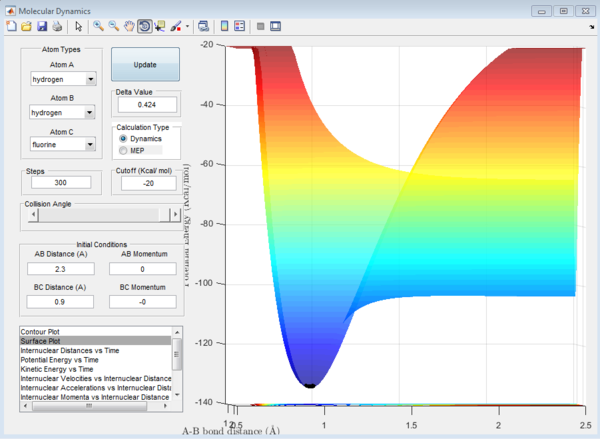
As seen in the plots above, in the forwards reaction (figure 7), the energy of the reactants is higher than the energy of the products along the bottom of the potential energy surface. This will result in an exothermic reaction.
In Figure 8, representing the reverse reaction, the opposite is observed, the products being higher in energy than the reactants will lead to an endothermic reaction. This is also very logical, if a forwards reaction is exothermic, it's reverse reaction should be endothermic, ensuring a conservation of energy.
If we relate these conclusions to the bond energies, as the forwards reaction is exothermic, the formation of the bond H-F bond releases energy, therefore must be lower in energy, making it more stable, and finally stronger. For the reverse reaction, we are generating a H-H bond. Therefore the energy released by the formation of this bond was lower than the cost in energy to break the H-F bond. It is therefore higher in energy and less stable, being a weaker bond and an endothermic process.
Transition states:
To find the transition state, first the saddle point of the H-H-F system must be found on the potential energy surface. To do so, first the momenta were set to 0, ensuring the lowest energy path. The bond lengths had to be guessed initially, the "local equilibrium" assumption of the transition state theory was used to guess the H2 bond length. The bond length of hydrogen at the transition state (saddle point) is closer to the bond length of H2. When the reaction would go one way, the bond length were decreased for the atoms that didn't form a molecule, always trying to readjust them to get the saddle point.
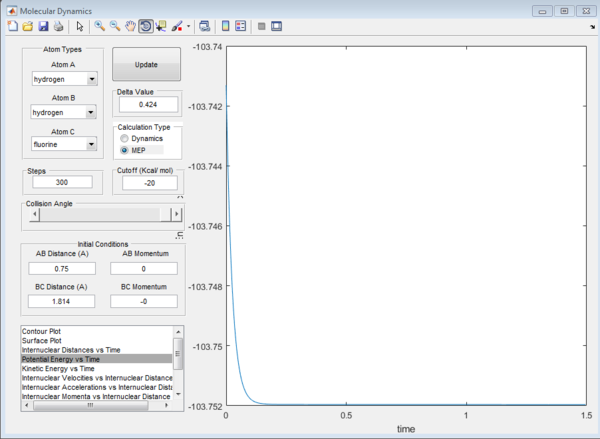
After many guesses, the saddle point was found when the initial conditions of the system were stable with no initial momentum. This was found at H-H = 0.740 angstroms, H-F = 1.814 angstroms. A plot of the saddle point and the potential energy against the time is shown below in figure 9 and 10.

Activation energies of both reactions:
The activation energy is the amount of energy required to reach the transition state from the reactants. To calculate it, first the energy at the saddle point must be found, before subtracting the energy of the reactants.
Both forward and reverse reactions have the same transition states. The energy of that transition state can be calculated for; the saddle point previously found. The energy at this saddle point is -103.752 kcal/mol (see Figure 11).

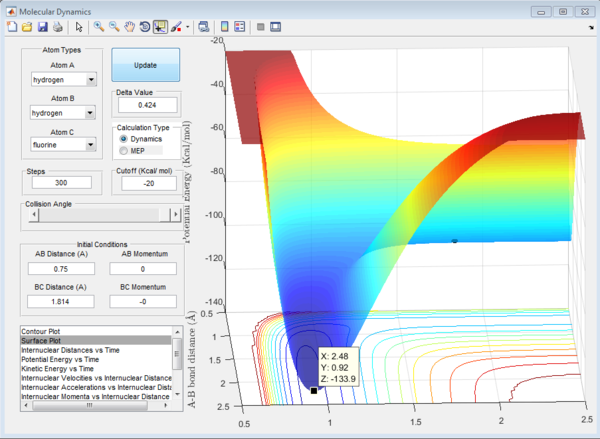
For the forward reaction: The energy of the reactants along the minimum energy path of the H2 bond is -103.9 kcal/mol. Therefore the activation energy Ea=0.15 kcal/mol (see Figure 12).

For the reverse reaction: The energy of the reactants, along the path of minimum energy of the H-F bond is -133.9 kcal/mol. Therefore the activation energy of the reverse reaction is Ea(rev)=30.15 kcal/mol (see Figure 13).
Mechanism of release of energy:
When the energy is released in an exothermic reaction, this is represented by a difference in height between the reactants and the products in the potential energy plot. It can be represented by a ball going along the surface, when it goes down the hill it will gain considerable amounts of kinetic energy. This will result in much higher oscillations once the transition state has been reached. For the system with the atoms, this results in much larger vibrations. The energy could also be transferred as translation energy. However, the energy could not be transferred as rotational energy though as the collision is linear.
To measure this in an experiment, IR spectroscopic methods could be used to observe the vibrations of the molecule, as they come at the infrared part of the electromagnetic spectrum.
To measure the total amount of energy released by the reaction, calorimetry techniques could be used, determining the release of cost in energy of each reaction.

Distribution of energies:
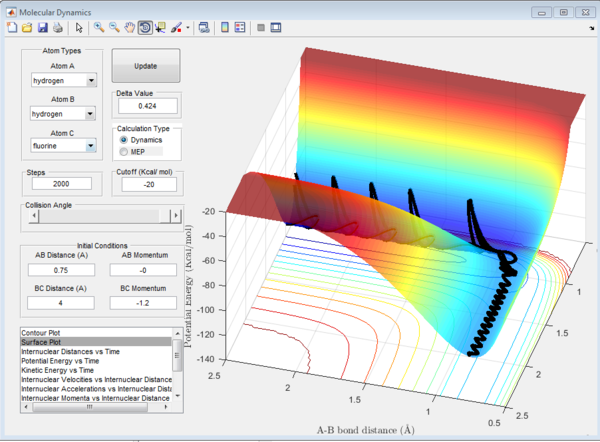
An incoming atom does not always react with a molecule, even when it has enough energy. This depends on many different factors, such as the amount of vibrational energy the incoming atom has. Two different things can happen, the atom comes in with more vibrational energy, the saddle point occurs late; this will favor endothermic reactions (see figure 14). On the other if the atom comes in with more transnational energy, the transition state will occur early and exothermic reaction will be favored (see figure 15). This can be thought of using the previous 3D plot of the potential energy, by throwing a ball in a straight line or more up the sides, and in which case it is more likely to come back to us (good analogy for understanding how these plots work).
(An individual atom cannot possess vibrational energy Tam10 (talk) 14:24, 1 June 2017 (BST))

References:
1- D. G. Truhlar, B. C. Garrett and S. J. Klippenstein, .
