MRD:HaoyuanZhang
What value do the different components of the gradient of the potential energy surface have at a minimum and at a transition structure? Briefly explain how minima and transition structures can be distinguished using the curvature of the potential energy surface.
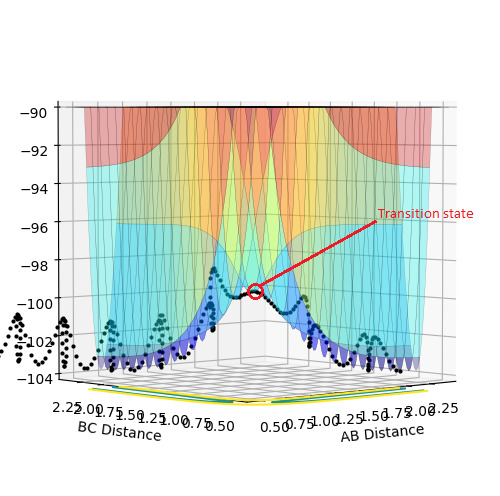
The transition state is the saddle point of the potential energy surface. it is the maximum point in the total energy curve and also the minimum point in the potential energy curve.
Good--Sw2711 (talk) 16:53, 16 May 2018 (BST)
To describe the transition state and minimum more precisely, we need to define the coordinates first.
You just copied this part directly from the lab script. Do you actually know what that means? --Sw2711 (talk) 16:53, 16 May 2018 (BST)
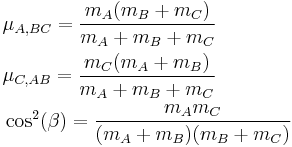
The coordinates Q1 and Q2 are defined as:
with
where β is the so called Skew angle setting the angle of the oblique mesh. The advantage of this set of coordinates is that the dynamics of the system can be analysed as a rolling sphere on a potential surface, where the force acting on the trajectory is orthogonal to the contour lines
Therefore, for a minimum:
d2E/dq2 > 0 for all q.
For a transition state:
d2E/dq2 > 0 for all q.
Except along the reaction coordinate, and
d2E/dq2 < 0 along the reaction coordinate.
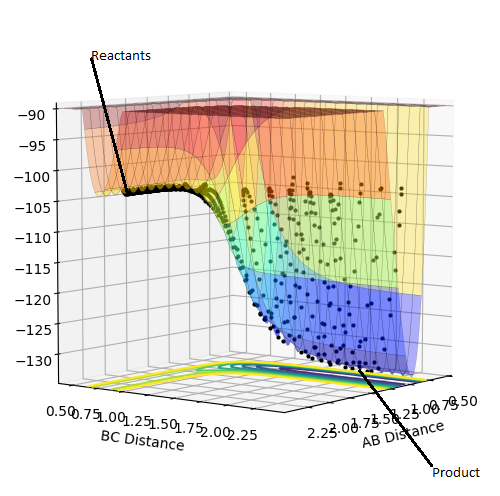
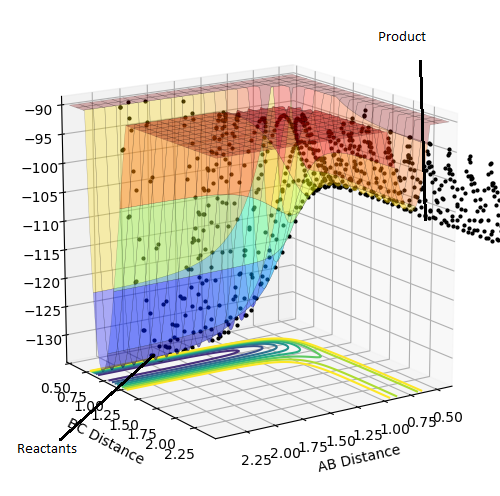
Plot 1. The plot of transition state;
Report your best estimate of the transition state position (rts) and explain your reasoning illustrating it with a “Internuclear Distances vs Time” plot for a relevant trajectory.
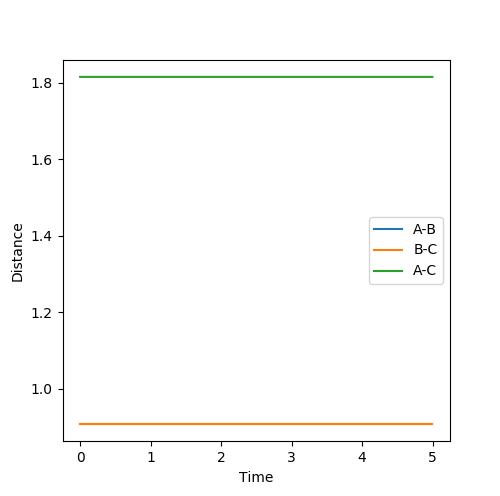
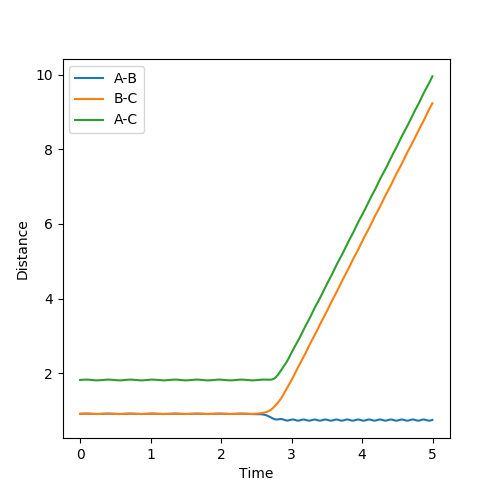
The estimate of the transition state position rts is around 0.9077. At this value, the distance between each atoms should be the same and no oscillation should be found between each atoms in the transition state. In the internuclear distance vs time curve, a linear line should be observed. In addition, the momentum should be kept at 0 while the r is changing. If not, oscillation will also be created in the plot of potential energy surface. The plots are shown below:
Good--Sw2711 (talk) 16:56, 16 May 2018 (BST)
Plot 2. The internuclear vs time plot with the momentum is kept at 0;
Plot 3. The internuclear vs time plot with the momentum is not 0;
Comment on how the mep and the trajectory you just calculated differ.
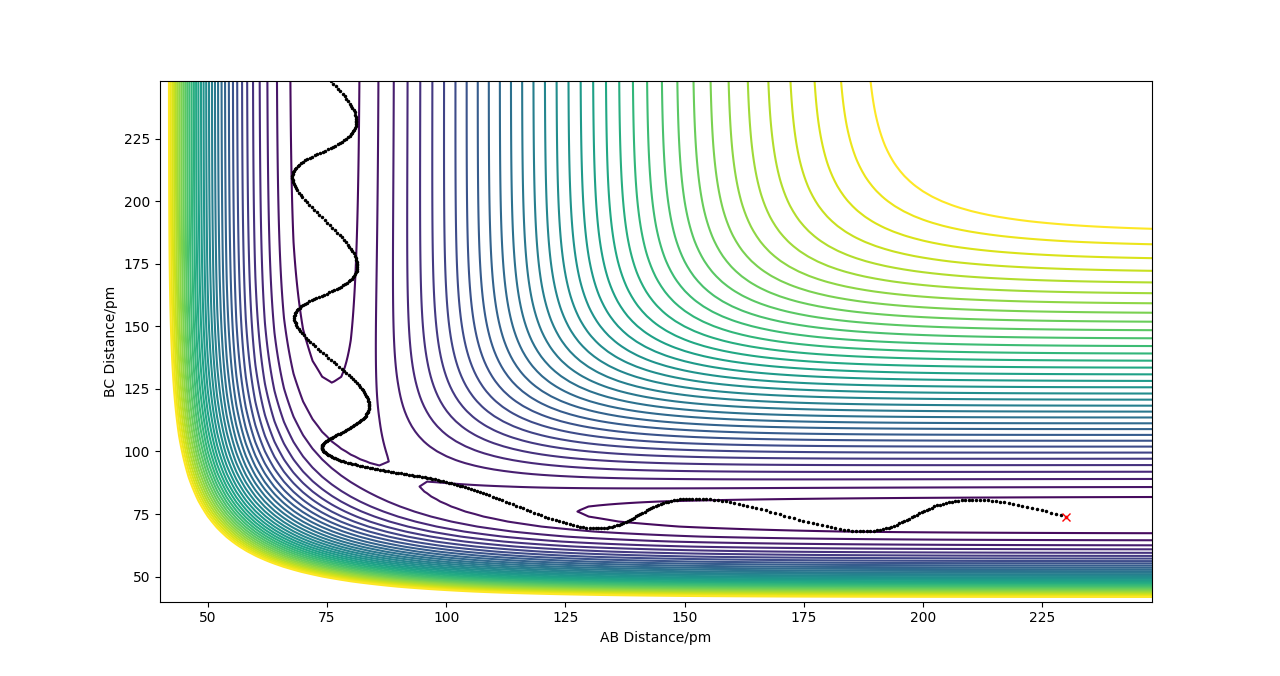
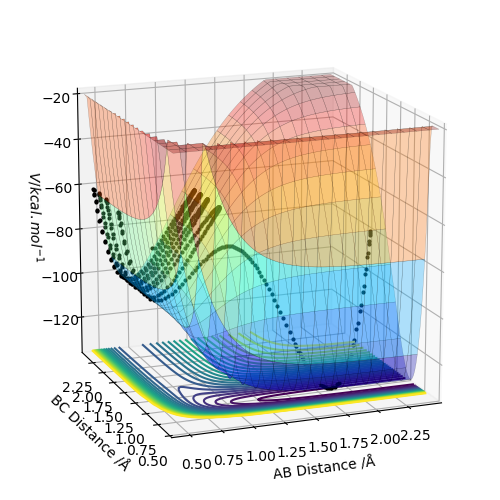
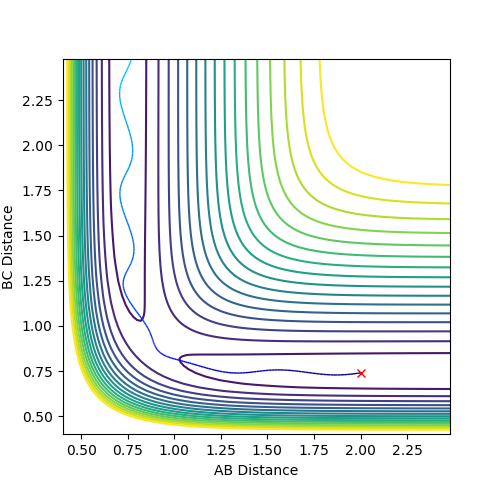
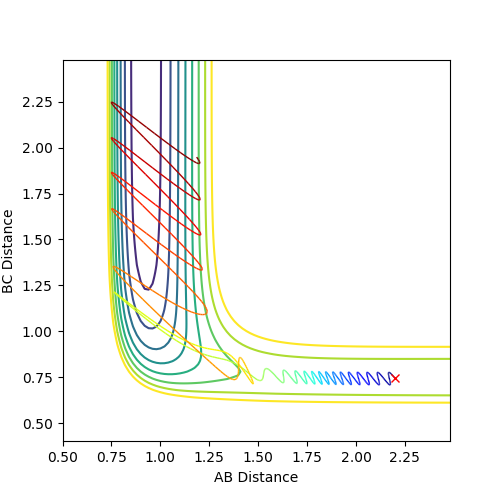
The difference in the surface plot: mep follows the lowest energy path being 0. What is being 0?--Sw2711 (talk) 17:03, 16 May 2018 (BST)Therefore, in the plot of surface diagram, mep always shows an smooth linearly line with no oscillation. In comparison, the dynamic calculation describes the real reaction trajectories and how the reaction path actually going. Thus, oscillation can be observed in the surface plot.
The difference in the contour plot: by using the mep calculation, no oscillation can be observed in the contour plot as the mep calculation always follow the lowest energy path. However, by using the dynamic calculation, the oscillations was induced in the plot of contour plot. This is because the dynamic calculation always takes the diatomic vibration into account.
The difference in the Internuclear distance VS time curve: with the low number of calculation steps, the internuclear distances that were calculated in the mep mode are much smaller than that were calculated in the dynamic mode. The reason is that each step in the dynamic calculation correspond to 1 point in the trajectory line, but in the mep calculation, 1 point in the trajectory may correspond more than 10 steps. You can understand in this way, but why is that? --Sw2711 (talk) 17:03, 16 May 2018 (BST) In consequence, when the steps is large enough, the internuclear distances which is calculated in both mep and dynamic mode are the same.
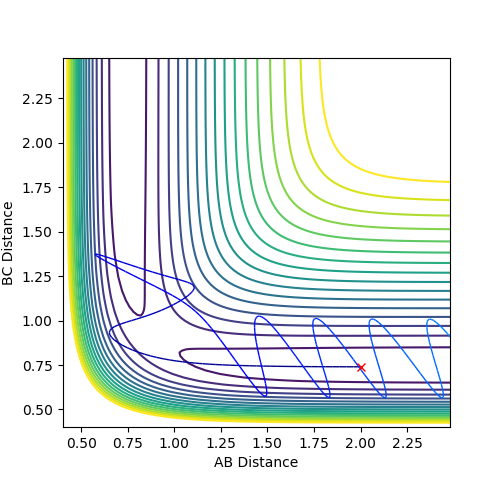
Complete the table by adding a column with the total energy, and another column reporting if the trajectory is reactive or unreactive. For each set of initial conditions, provide a plot of the trajectory and a small description for what happens along the trajectory.
| Factor | p1 | p2 | total energy | pathway |
|---|---|---|---|---|
| 1 | -1.25 | -2.5 | -99.119 | reactive |
| 2 | -1.5 | -2.0 | -100.456 | unreactive |
| 3 | -1.5 | -2.5 | -98.956 | reactive |
| 4 | -2.5 | -5.0 | -84.956 | unreactive |
| 5 | -2.5 | -5.2 | -83.461 | reactive |
Plot 4. The reaction trajectory starts from the reactant, passes through the transition state and moves the the product;
Plot 5. The reaction trajectory starts from reactant. After reaction path reaches the transition state, it goes back to the reactant;
Plot 6. The reaction trajectory starts from the reactant, passes through the transition state and moves to the product;
Plot 7. The reaction trajectory starts from reactant. After reaction path reaches the transition state, it goes back to the reactant;
Plot 8. The reaction trajectory starts from the reactant, passes through the transition state and moves to the product.
State what are the main assumptions of Transition State Theory. Given the results you have obtained, how will Transition State Theory predictions for reaction rate values compare with experimental values?
- Rates of reaction can be studied by examining activated complexes near the saddle point of a potential energy surface. The details of how these complexes are formed are not important. The saddle point itself is called the transition state.
- The activated complexes are in a special equilibrium (quasi-equilibrium) with the reactant molecules.
- The activated complexes can convert into products, and kinetic theory can be used to calculate the rate of this conversion.
I think the term ‘equilibrium’ is not very applicable here. ‘equilibrium’ is mainly used in statistical thermodynamics. So like…thinking about a reaction A+B<=>C. Statistically speaking there is 80% molecules in this system reacts from the left to the right and 20% the other way around. (about obviously you should think about more like a Boltzmann distribution ). This reaction has reached an equilibrium. But in terms of your system, there are only 3 atoms. So, it is either one way or the other. So you need to think about what TST means to your system. You haven’t really answered how will TST predictions compare with experimental results. --Sw2711 (talk) 17:14, 16 May 2018 (BST)
Classify the F + H2 and H + HF reactions according to their energetics (endothermic or exothermic). How does this relate to the bond strength of the chemical species involved?
The reaction of F + H2 is an exothermic reaction as the energy level of the reactant is higher than the energy level of the product. Therefore, it is clear that the energy needed to break the H-H bond is lower than the energy which was released by the formation of H-F bond. In consequence, the bond strength: H-F>H-H.
The reaction of H + HF is an endothermic reaction as the energy level of the reactant is lower than the energy level of the product. Therefore , it is clear that the energy needed to break the H-F bond is higher than the energy which was released by the formation of H-H bond. In consequence, the bond strength : H-F>H-H.
Locate the approximate position of the transition state.
I think I need some evidence here. Numbers are not enough.How you found those numbers is more important--Sw2711 (talk) 17:35, 16 May 2018 (BST)
The approximate position of the transition state for the reaction F + H2:
rAB = 1.8086 Å and rBC = 0.7500 Å
The approximate position of the transition state for the reaction of H + HF:
rAB = 0.7449 Å and rBC = 1.8107 Å
Report the activation energy for both reactions.
Same here. Numbers are not enough. Evidence and methods are more important.--Sw2711 (talk) 17:35, 16 May 2018 (BST)
The Activation energy of a reaction = the potential energy of the transition state- the potential energy of the reactant
The activation energy of the reaction: F + H2 = -103.742 Kcal/mol - (-104.025 Kcal/mol) = +0.283 Kcal/mol
The activation energy of the reaction: H + HF = -103.752 Kcal/mol - (-133.960 Kcal/mol) = +30.208 Kcal/mol
In light of the fact that energy is conserved, discuss the mechanism of release of the reaction energy. How could this be confirmed experimentally?
rAB = 2.199 Å and rBC = 0.744 Å, AB momentum = -0.7 and BC momentum = 0.35;
As the reactants pass through the transition state, the oscillation of momentum and kinetic energy of H2 became smaller, the plot of internuclear momentum vs time was shown below; For the product, the oscillation of momentum and kinetic energy increases a lot. From the plot of energy vs time, we can see that the kinetic energy of the product increases from 0 Kcal/mol to approximately 30 Kcal/mol and the potential energy shows a decrease trend. This illustrates the exchange between the potential and kinetic energy. In addition, from the plot of animation, it is obvious that the molecule of product oscillates much more stronger and faster than the molecule of reactant, which indicates that the product has a higher vibrational kinetic energy.
I think from your observation here. We can see the energy is conserved. Now knowing that the energy is conserved, how do we find out whether reaction is endothermic or exothermic in a practical web lab? --Sw2711 (talk) 17:35, 16 May 2018 (BST)
Setup a calculation starting on the side of the reactants of F + H2, at the bottom of the well rHH = 0.74, with a momentum pFH = -0.5, and explore several values of pHH in the range -3 to 3 (explore values also close to these limits). What do you observe? Note that we are putting a significant amount of energy (much more than the activation energy) into the system on the H - H vibration.'
During the calculation, as the pHH is varied, even though the energy is high enough, there are still some reactions which are unreactive.
For the same initial position, increase slightly the momentum pFH = -0.8, and considerably reduce the overall energy of the system by reducing the momentum pHH = 0.1. What do you observe now?
The reaction with pFH = -0.8 and pHH =0.1 is a reactive reaction and lower in energy with -103.398 Kcal/mol. In comparison, the reaction with pFH = -0.5 and pHH = 2.4 is unreactive and higher in energy with -96.733 Kcal/mol.
Same both here. If you are making some statements, I need to see some evidence.--Sw2711 (talk) 17:35, 16 May 2018 (BST)
Discuss how the distribution of energy between different modes (translation and vibration) affect the efficiency of the reaction, and how this is influenced by the position of the transition state.
The position of the transition state affects the efficiency of the reaction largely. In the late transition state, the translational energy is not efficient to allow the reaction trajectory passes through the transition state as the translational energy is not enough to let the reaction trajectory to reach the turning point. In comparison, the vibration energy induces the oscillation of reaction trajectory, which therefore makes the reaction trajectory passes through the turning point more easily. On the circumstance of the early transition state, the translational energy is high enough to reaches the energy barrier. Thus, the translational energy allows the trajectory passes through the transition point more straight forward. For the vibrational energy, there are too many oscillations which makes the trajectory less likely to pass through the transition state. In consequence, to ensure the reaction could be happened successfully. It is not only just have enough energy but also the right combination of translational energy and vibrational energy.
This part is good. But do you have any experiments to support your idea?--Sw2711 (talk) 17:35, 16 May 2018 (BST)


