MRD:HNA4117
H + H2 system
Transition State on the PES
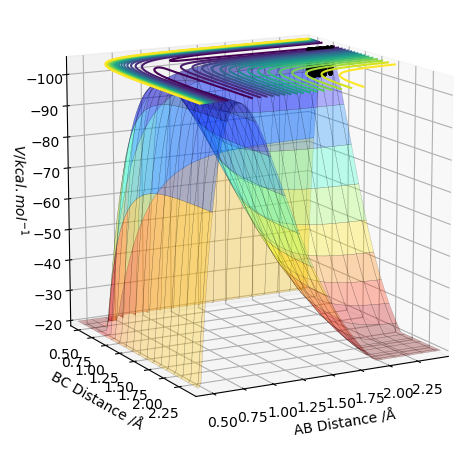
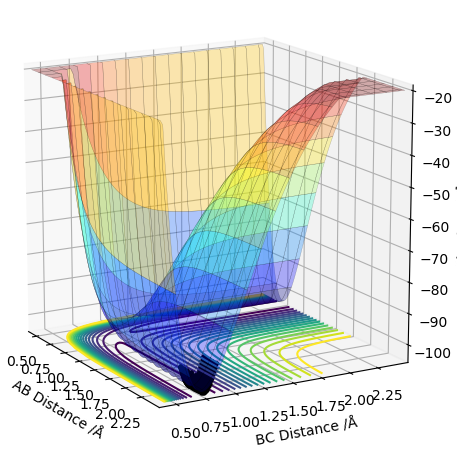
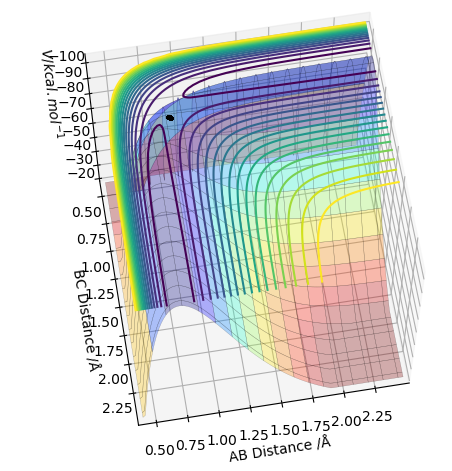
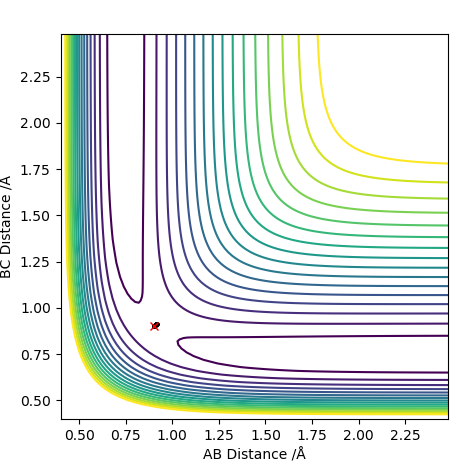
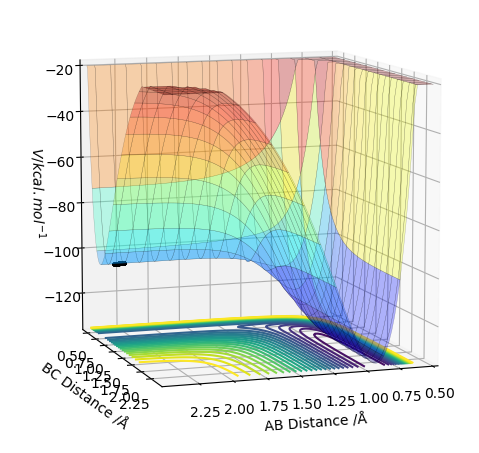
The potential energy surface has a transition state that is a saddle point - it can be both a maxima and a minima relative to the direction you are looking at (shown in the pictures below). Whether it is a maxima or a minima, its gradient is always 0. The TS can be distinguished from a local minima on the PES using a second derivative of the gradient. How do you use the second derivative of the gradient? Pu12 (talk) 21:18, 30 May 2019 (BST)
I'm not sure what you mean by this diagram. Pu12 (talk) 21:18, 30 May 2019 (BST)
TS value - locating the TS
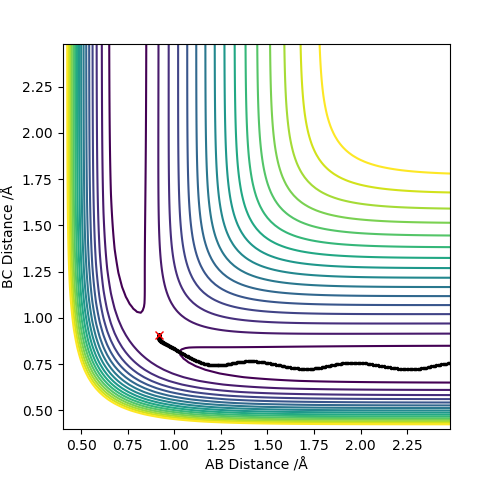
0.91 seems to be a good estimate of the bond distance of TS where the atoms don't seem to fall off. When increased or decreased slightly to 0.90 or to 0.92 respectively, it seems to be inclined to one side or the other with the potential to fall off.
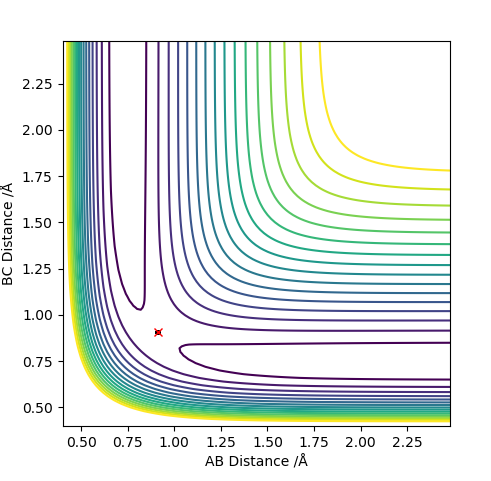
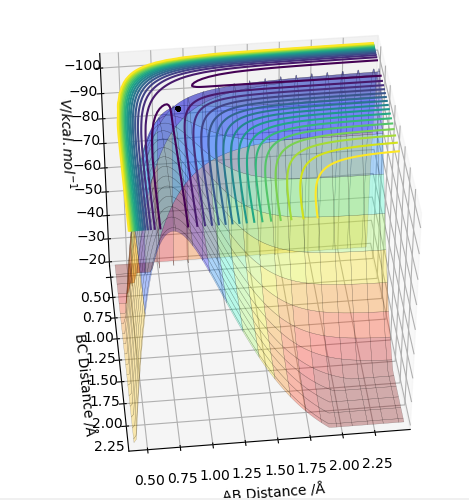
The pictures above a contour plot and a surface plot when r1=r2=0.91 Correct, but you should include an intermolecular distances vs time plot as the question asks. Pu12 (talk) 21:18, 30 May 2019 (BST)
The pictures above a contour plot and a surface plot when r1=r2=0.90. The atoms seems to be inclined to fall off on one side of the ridge.
Calculating the reaction path (MEP vs Dynamic)
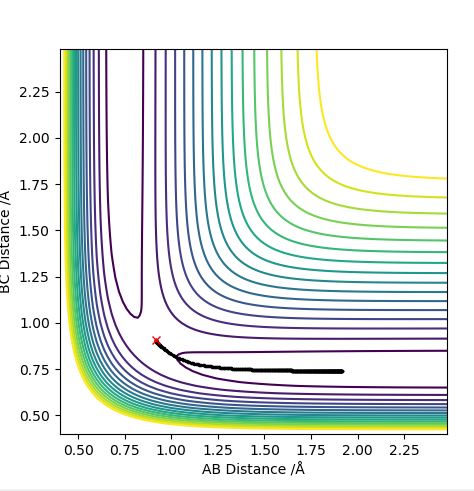
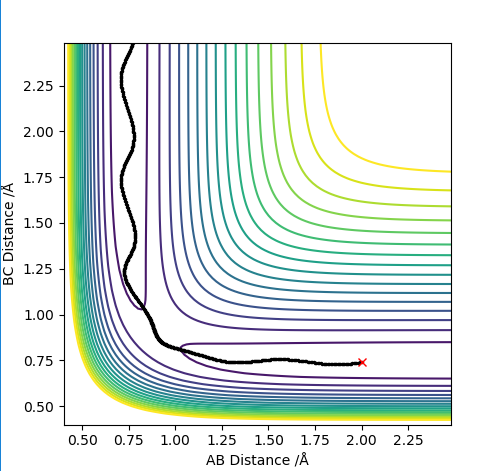
The picture on the left shows the trajectory of atoms run on a dynamic energy path and the right picture, run on MEP. MEP is the lowest energy path and it shows a straight line trajectory which deviates from the true energy path. When calculating this, r1 was maintained at the TS length while r2 was increased by +0.01 to 0.92. The MEP produces a straight line because it disregards the interactions (vibrations) between the atoms.
What causes the MEP to disregard vibrations between the atoms? You should mention how re-setting the momentum to 0 after each step in the MEP causes the path to stay on the valley floor (no vibration). Pu12 (talk) 21:18, 30 May 2019 (BST)
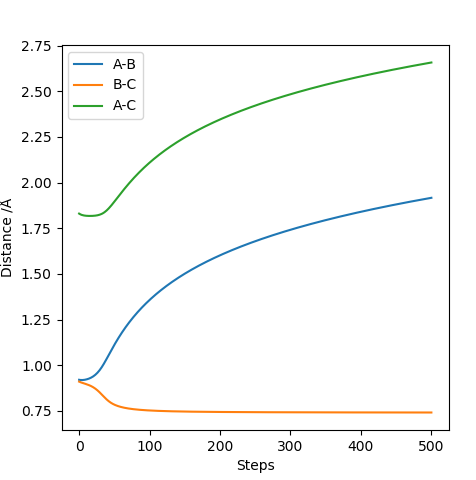
The picture above is the internuclear distance vs time plot. For the very first few steps, the bond distances remained constant. Then, the internuclear distance between B-C quickly decreases then plateaus indicating that bond is formed and remained that way. The bond distances between A-B and A-C increases at the same rate showing bonds are broken and they are moving away from each other at the same rate.
Reactive and Unreactive Trajectories
What can you conclude from the table? Pu12 (talk) 21:18, 30 May 2019 (BST)
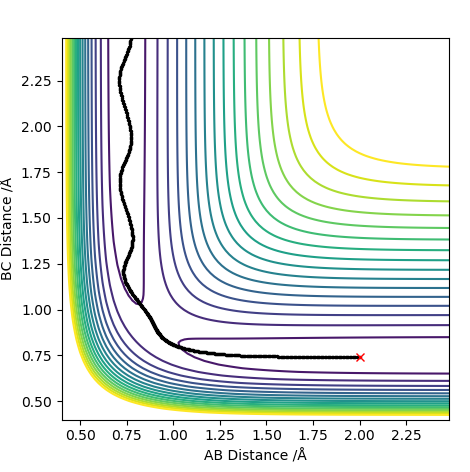
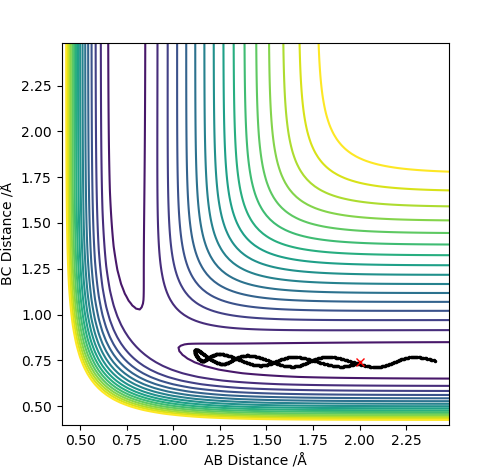
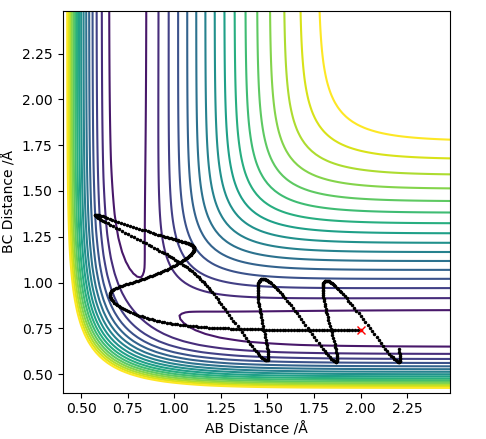
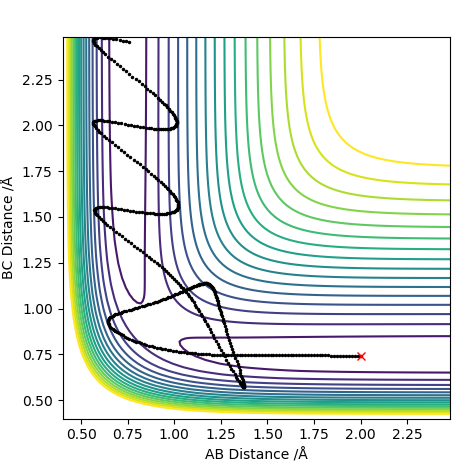
The Transition State Theory assumes that reactant nuclei follow the rules of classical mechanics. As we know now, this is inaccurate. At molecular levels, atoms follow the rules of quantum mechanics. For example, in reaction 4, the atoms have enough energy to form TS but did not proceed. According to classical mechanics, this should've formed product. But the reactants recrosses the activation barrier. What are the specific assumptions of transition state theory? It isn't enough to say that classical mechanics is followed because not all of the assumptions are purely based on mechanics. Pu12 (talk) 21:18, 30 May 2019 (BST)
F-H-H system
PES Inspection
F+ H2 ---> F-H + H The reaction of F + H2 is exothermic. The product, H-F form is more stable hence lower in energy than the reactant. H-F bond is very strong due to the electronegativity difference between H and F. This gives rise to polar bond which is much stronger than a covalent H-H bond. The PES is illustrated below.
F-H + H ---> H2 + F
On the other hand, the reaction of H-F + H is endothermic. The strong H-F bond results in highly positive enthalpy which causes the reaction to have net endothermic reaction.
The PES is illustrated below. 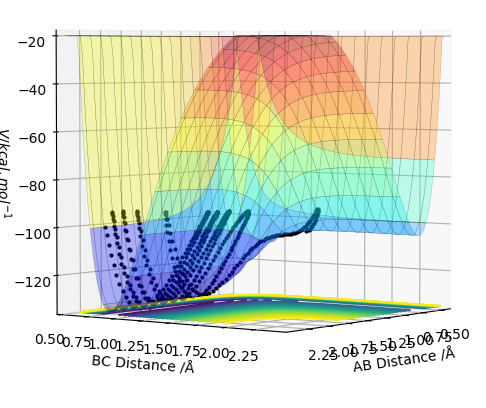
The last 4 questions are missing. Pu12 (talk) 21:18, 30 May 2019 (BST)

