MRD:HMB01532415
Exercise 1: H + H2 System
On a potential energy surface diagram, how is the transition state mathematically defined? How can the transition state be identified, and how can it be distinguished from a local minimum of the potential energy surface?
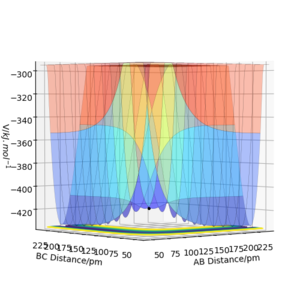
The transition state is mathematically defined as a saddle point on the potential energy surface plot. A saddle point is a stationary point with gradient = 0.It is a local maximum on the minimum energy pathway (MEP); as it is a saddle point it is also a minimum in the orthogonal direction to the MEP. This pathway links the potential energy of the reactants with the products via the transition state. In order to identify and distinguish a local maximum from a local minimum, the second derivative test is used. If a turning point is a maximum, the result of the second derivative test will be negative, f"(x) < 0 . On the other hand, if it is a minimum then the result will be positive, so f"(x) > 0 .

Good and clear. Pu12 (talk) 18:12, 21 May 2020 (BST)
Report your best estimate of the transition state position (rts) and explain your reasoning illustrating it with a “Internuclear Distances vs Time” plot for a relevant trajectory.
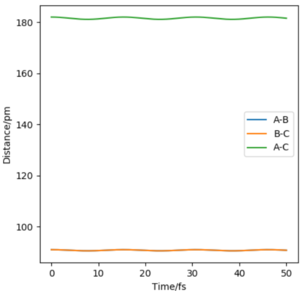
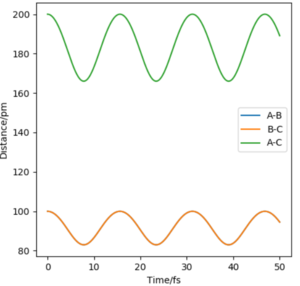
The transition state must be symmetrical, i.e r1 = r2, because the H + H2 surface is also symmetric with the reactants and products having equal energies. Using "Internuclear Distances vs Time" plots it is possible to predict the exact length of r1 and r2 in the transition state, rts. (Table 1) At this point, there is no oscillation of the AB and BC bonds and the internuclear distance of each bond is constant. This point is at a potential energy minimum as the atoms are positioned so that attractive forces and repulsive forces are minimised. By plotting internuclear distance for AB and BC against time, the potential energy is at a minimum for rts = 90.775 pm which corresponds to V = -415.378 kJmol-1. This also coincides with forces along AB and BC of 0.00 kJmol-1pm-1.
| r = 80 pm | r = 90.775 pm | r = 91 pm | r = 100 pm |
|---|---|---|---|
 |
 |
 |
|
Comment on how the mep and the trajectory you just calculated differ.
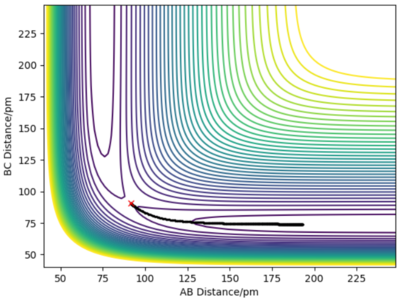
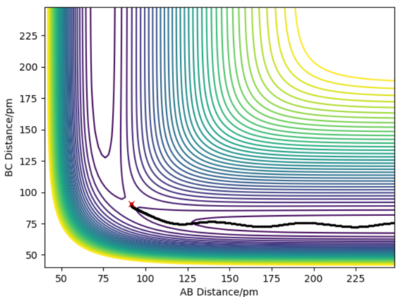
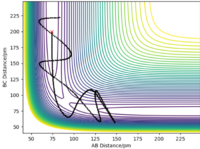
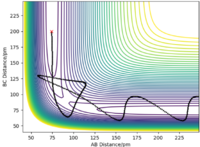
The minimum energy path (MEP) represents the trajectory at infinitely slow motion. This means that it is a calculation where the atoms and molecules in the reaction do not accumulate kinetic energy. Kinetic energy is reset to 0 kJmol-1 for each step number. By setting r1 to 91.775 pm and keeping r1 as 90.775 pm, a smooth trajectory is given when the MEP calculation is plotted on a contour plot and there is no oscillation of the H-H bond. Alternatively, the dynamic calculation type shows a more realistic trajectory whereby there is oscillation of BC (r2) as A approaches, i.e r1 decreases. (Table 2) As the surface plot is symmetric, swapping the values of r1 and r2 gives the same trajectory, reflected in the line y = x, and the approach is from the opposite direction.
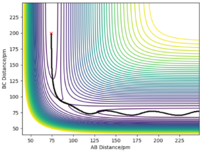
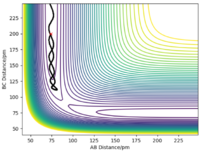
Complete the table by adding the total energy, whether the trajectory is reactive or unreactive, and provide a plot of the trajectory and a small description for what happens along the trajectory. What can you conclude from the table?
r1 = 74 pm which is the internuclear distance in AB and r2 = 200 pm is the internuclear distance between BC.
In general, the trajectory for each pair of momenta shows that a larger (more negative) momentum increases the chance that BC will form from AB + C. It must also be noted that when the bond momenta are too large, the reaction is reversible and as a result, there will be more than 1 exchange of the central atom, B. Good, but more commentary on changes in vibrational energy would improve descriptions. Pu12 (talk) 18:12, 21 May 2020 (BST)
Given the results you have obtained, how will Transition State Theory predictions for reaction rate values compare with experimental values?
Transition State Theory is based on 4 main assumptions. [1]
1) The energy distribution of the reactants is the same as that in the Boltzmann distribution.
2) Once a molecular system has passed through the transition state to form products, this cannot be reversed to form the reactants again.
3) The translational motion of the system can be separated from the other motions linked to the activated complex, e.g vibrational energy.
4) The chemical reaction can be treated classicially, and quantum effects can be ignored - e.g QM tunnelling
Based on the calculations made above, it can be seen that some of the products can undergo recrossing to reform the reactants, depending on the conditions. Therefore, it is not always true that the reactants cannot be reformed once the products have passed through the transition state. If recrossing occurs and some molecules go back to form the reactants in an unreactive trajectory, then Transition State Theory will overestimate the rate constant for the reaction when compared to experiment values.
Exercise 2: F - H - H System
By inspecting the potential energy surfaces, classify the F + H2 and H + HF reactions according to their energetics (endothermic or exothermic). How does this relate to the bond strength of the chemical species involved?
(AB = HH BC = HF) For F + H2 → H + HF, when AB distance is long, the reaction has formed HF, and when BC is long this corresponds to HH + F. By inspecting the surface plot for F + H2 → H + HF, it can be seen that this is an exothermic reaction as the products are lower in energy than the reactants. H + HF is the reverse of this reaction, it is an endothermic reaction and the products (F + H2) are higher in energy than the reactants.
As H + HF is lower in energy than F + H2, this shows that the HF bond is stronger and thermodynamically more stable than that in H2.

Locate the approximate position of the transition state.
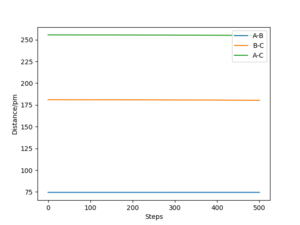
According to the Hammond postulate, the transition state must resemble the reactants of the exothermic reaction and the products of the endothermic reaction. In both cases, the transition state must therefore resemble F + H2, where the H - H bond is formed more than the F - H bond. Using this, the bond length for a typical H - H bond is a good prediction for the H - H bond length in the transition state. By manually changing the bond lengths, as in the H + H2 exercise, the transition state approximately occurs when the H-H distance is 74.49 pm and the F-H distance is 181.0 pm. (Fig 4, Fig 5) The total energy for this transition state is -433.981 kJ.mol-1 where the momentum for each bond is set to 0 g.mol-1.pm.fs-1.

Report the activation energy for both reactions.
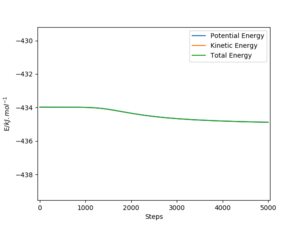
The activation energy was calculated by comparing the total energy of the reactants for each reaction to the energy of the transition state (-433.981 kJmol-1). By varying the distance between H and F (BC), it's possible to find the energy of the reactants (H2 + F) and the activation energy is the difference between the energy of the reactants and the energy of the transition state. (Figure 6) The reactants were found to have an energy of -435.059 kJmol-1 when the BC distance was increased until there was no further change in the total energy. (BC was increased up to 700 pm). Therefore for the reaction H2 + F → HF + H, Ea = 1.078 kJmol-1.
To find the activation for HF + H → H2 + F, an internuclear distance of 91 pm was used for the H-F bond and then AB distance was increased until there was no further change in the potential energy. (AB was increased up to 700 pm). The reactants for this reaction were found to have energy -560.404 kJmol-1. As both reactions have the same transition state, the activation energy for this particular reaction is the difference between -433.981 kJmol-1 and -560.404 kJmol-1. Overall, Ea = 126. 423 kJmol-1.
In light of the fact that energy is conserved, discuss the mechanism of release of the reaction energy. Explain how this could be confirmed experimentally.
Initial conditions of AB = 74.49 pm and BC = 250 pm, p1 = -1 and p2 = -3 were found to produce a reactive trajectory.
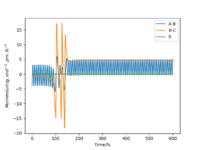
These conditions ensure that F approaches H-H before passing through the transition state. It is clear from the momentum vs time plot that there is a change from H-H bond oscillation to H-F bond oscillation as the reaction progresses and forms the products. There is much more momentum in the H-F bond and as energy must be conserved in the reaction and the HF + H products are lower in energy than the reactants, this suggests the products are in a higher (excited) vibrational state, so HF oscillates more than HH in the reactants. (Figure 7)
Calorimetry is a useful technique for calculating the total energy a molecule releases but it is not sensitive enough to differentiate between the translational and excited vibrational contribition to the total energy. Vibrational excitation can be seen with infrared spectroscopy instead. The main excitation is from the ground state to the first excited state, v = 0 → v = 1. This is the most prominent absorption seen as most molecules will be in the ground state. A less intense overtone of v = 1 → v = 2 will be seen at a lower frequency to v = 0 → v = 1 because the energy gap is slightly smaller for this transition. Any v = 1 → v = 0 transitions will not be seen in the IR because this is an emission, not an absorption. Raman scattering is a specific technique that can be used to identify whether molecules are in an excited state and also determine the energy of the transition. [2]
Good discussion of the different possible ways to measure the vibrational increase. Pu12 (talk) 18:12, 21 May 2020 (BST)

Discuss how the distribution of energy between different modes (translation and vibration) affect the efficiency of the reaction, and how this is influenced by the position of the transition state.
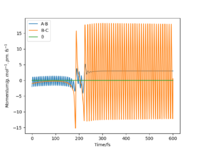
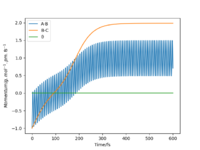
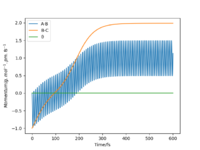
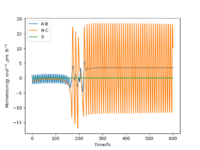
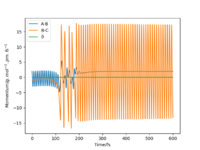
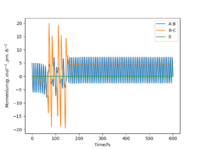
Starting on the side of the reactants, F and H2: rHH = 74 pm, rHF = 210 pm, where momentum pHF = -1.0 g.mol-1.pm.fs-1 and pHH was varied within the range -6.1 to 6.1 g.mol-1.pm.fs-1. The trajectories were plotted along with momentum vs time graphs to see if the reaction proceeded under different momentum conditions. In these cases, the energy supplied to the H2 bond was significantly above the activation energy. Momentum vs time graphs were plotted to show the overall outcome of the reaction and whether the product was a HF or HH oscillating bond. (Table 4)
For the reactants F and H2, pHF relates to the translational motion of F moving towards H2 and pHH relates to the vibrational motion (oscillation) of the H-H bond. It is important to note that this reaction is exothermic and so it has an early transition state. Increasing the momentum for the H-H bond did not always result in a successful reaction and most of the trajectories were unreactive. This is because increasing the momentum actually increased the vibrational energy of the bond causing it to oscillate more, and the translational energy was kept constant.
| pHH = -6.1 | pHH = -4 | pHH = -3 | pHH = -2 | pHH = -1 | pHH = 0 |
|---|---|---|---|---|---|
| Unreactive | Unreactive | Reactive | Reactive | Unreactive | Unreactive |
 |
 |
 |
 |
 |
|
| pHH = 1 | pHH = 2 | pHH = 3 | pHH = 4 | pHH = 5 | pHH = 6.1 |
|---|---|---|---|---|---|
| Reactive | Reactive | Unreactive | Unreactive | Unreactive | Unreactive |
 |
 |
 |
 |
 |

|
For the same initial conditions rHH = 74 pm and rHF = 200 pm, the initial momentum conditions were changed to pFH = -1.6 g.mol-1.pm.fs-1 and pHH = 0.2 g.mol-1.pm.fs-1. This reaction was found to be successful. In this particular case, the vibrational energy of the reactants is low, and the translational energy was increased compared to the tested conditions above. (Figure 8)
Studying the reverse reaction of HF + H → F + H2, pHF now relates to the vibrational energy of the HF bond and pHH is linked to the translational energy of the approaching H atom. This reaction, as discussed before, is endothermic and therefore has a late transition state. The initial conditions for internuclear distances were set to: rHH = 200 pm and rHF = 91 pm. (Table 5) Successful reactions were found to occur when pHH translational energy was much lower than the vibrational energy given by pHF. The plots show that these reactions are efficient compared to those in Table 4.
| pHH / g.mol-1.pm.fs-1 | pHF / g.mol-1.pm.fs-1 | Contour Plot |
|---|---|---|
| -20 | 0 | 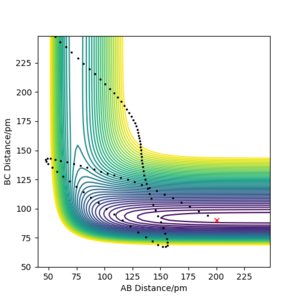
|
| -30 | -10 | 
|
The cases studied above are examples of Polanyi's Empirical Rules [3] which state that if a reaction has an early transition state, like F + H2 → HF + H, then a successful, efficient reaction is achieved when the vibrational energy is low and the translational energy is high for the reactants. Conversely, the rules also state that for a reaction that has a late transition state, the ideal conditions for a successful reaction are when vibrational energy is high and translational energy is low and therefore an efficient reaction. This highlights that the success of a reaction is based on the energy distribution of the system and the vibrational energy is just as important as the kinetic energy
Top tier report, well done. Pu12 (talk) 18:12, 21 May 2020 (BST)
Bibliography
- ↑ K. J. Laidler Chemical Kinetics 3rd ed., Harper-Collins, 1987, 88-98.
- ↑ Tom, S., Jin, H.-E., Lee, S.-W. Aptamers as Functional Bionanomaterials for Sensor Applications. Engineering of Nanobiomaterials; Elsevier, 2016, 181−226.
- ↑ K. J. Laidler Chemical Kinetics 3rd ed., Harper-Collins, 1987, 460-471.

