MRD:HJW116
Exercise 1
Transition state
A potential energy surface graph is gained from a function with two variables, in this case distance of AB, and BC. The transition state is seen at "saddle points" on the plotted graph. These are the maxima and minimas of the energy plot. These occur when the derivatives of each variable is equal to 0.
To determine whether it is a maxima or minima, take the double derivative; a positive value gives a minima, and negative, the maxima.
Mm10114 (talk) 16:07, 29 May 2018 (BST) This is a good attempt. However, the answer lacks essence. First you refer to the saddle points on the plotted graph, but you don't provide the graph. You wrote "saddle points", was there more than one saddle point on the graph? It is a quite common mistake, but it is minima, not "minimas". It is already plural. (minimum -> minima, maximum -> maxima). Which variables do you mean in the following sentence? I think you mean second derivatives, not double derivatives, in the second paragraph? And you don't specify how the negative or positive value correspond to the curvature, and also in respect to the TS in which direction the second partial derivative would be negative/positive. A much thorough answer is required here showing you have a good grasp of what is happening on the potential energy surface.
Locating the Transition State
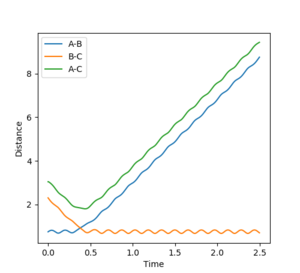
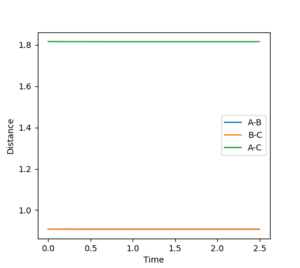
In order to maintain a set distance over time, AB and BC were made equal and set to a variety of values; 0.908 giving a straight line (non-changing distance)
Mm10114 (talk) 16:11, 29 May 2018 (BST) This is a correct estimate for the transition state. Well done. However, you could explain how the straight lines in the "internuclear distances vs time" confirm this is a TS.
MEP and Dynamic Calculations
The plot of the MEP follows the lowest energy path for the reaction, where the velocity of the molecule is continuously returned to 0 as to remove inertia from making any effect. This is seen on the MEP plot, not the dynamic.
Mm10114 (talk) 16:13, 29 May 2018 (BST) Nicely done providing the necessary plots. However, this is a very limited answer. Why is inertia taken out of the picture in MEP? What is the reason behind it? Why the trajectory path in MEP is much shorter than in dynamics?

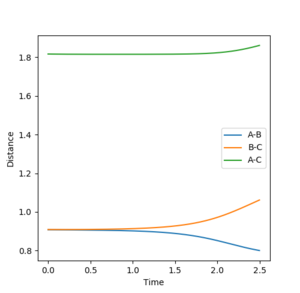
Reactive and Unreactive Trajectories
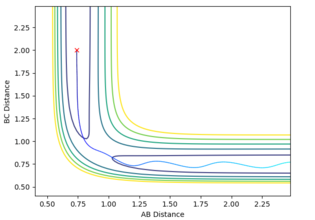
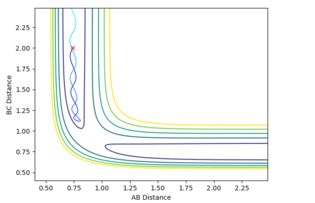
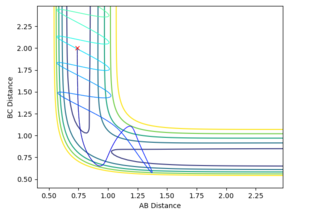
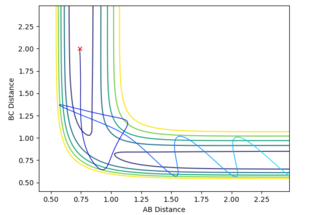
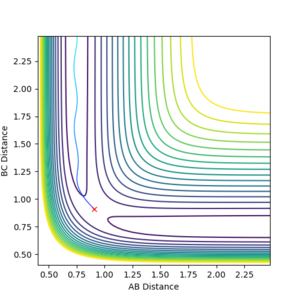
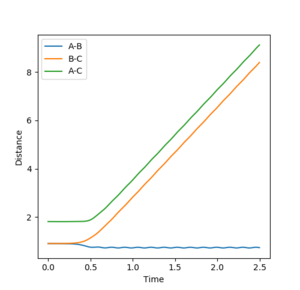
Mm10114 (talk) 16:15, 29 May 2018 (BST) Nice observations. In the 4th and 5th case, what happened in the transition state area? You should relate it to the re-crossing effect (might require further reading).
Transition state theory
A key point to the theory is that the atoms follow the Born-Oppenheimer approximation and ignores the effects of quantum tunneling. It is also assumed that the starting products are equlibrating as according to the energies given by the Boltzmann Distribution. The theory also separates the products and reactants into separate "spaces" with the transition being the middle point of this, where the theoretical product is a mix of the two. Once the state has collapsed and the product is formed, the reaction is irreversible under the same conditions.
My 4th and 5th reaction however, shows the making of product, followed by the state transition back to reactants. Thus breaking the theory. This could be attributed to the calculation being run assuming an isolated system, where as the theory accounts for the external factors as well to determine the equilibrium.
Mm10114 (talk) 16:18, 29 May 2018 (BST) Nicely done with relating it and discussing in respect to the 4th and 5th case from the previous exercise. I would be careful with claiming this "breaks the theory". It is a result of the assumptions of the TST, whereas these are limited to describe properly the real world behaviour.
Exercise 2
As the H-H bond is (-432 kJ/mol), and the F-H is higher in energy (-565 kJ/mol) [1], the reaction (F + H2 ⇌ H + HF) is, therefore exothermic, as the energy released from the making of the H-F bond is greater than that taken from the H-H being broken. This can be attributed due to the increased ionic character between the F-H bond due to the change in electronegativity. The reverse direction is therefore endothermic.
In order to determine the transition state the saddle state was needed. This was, again, determined via the maximum of an MEP graph of IN distance vs Time (derivative = 0). Through trial and error, this gave values of AB=1.812 Å and BC=0.745 Å in which A is Flourine, and B,C are both Hydrogen. (Momenta was set to zero.) This gave a straight line graph, thus showing the correct value had been obtained.
Mm10114 (talk) 16:19, 29 May 2018 (BST) You discuss the graph, but you do not provide it? You need to support your claims of finding the TS with appropriate plots.
Activation Energy
By slight alteration of the equilibrium settings (AB being changed to 1.91 Å) we can force the reaction to one side. In this case, due to the extended bond length, towards the F + H2 side.
Using an MEP (Energy vs Time) graph the activation energy was seen to be to be 29.16 kcal/mol (121.99 kJ/mol).
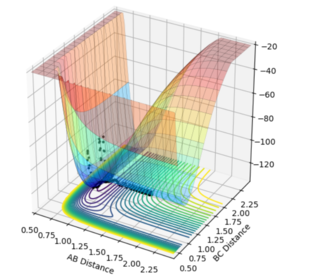
Dynamics
From the graph it was seen the AB distance, for determining the trajectory, was 1.81 Å and BC was 0.75 Å, with momenta of -0.5 and 0.8 kg.m/sec respectively. The contour plot of which is shown:
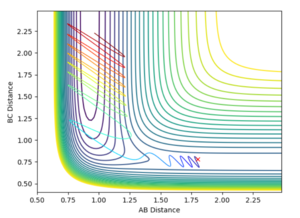
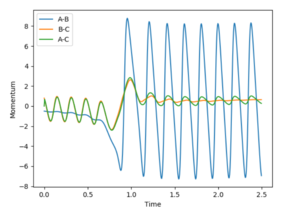
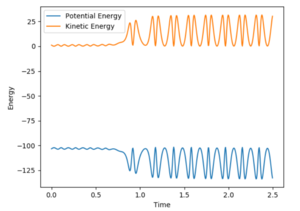
From the contour and momenta graphs, it can be seen the high level of vibrational energy, showing the energy released form the exothermic process is being transferred into kinetic vibrations. The energy plot clearly shows the conservation of energy, as the kinetic rises, the potential falls et vice versa.
Polanyi's rules
When a transition state is seen, it can mimic the products or reactants; these rules follow the effects of vibrational, and translational, vibrations have on this. [2] It is seen that high vibrational energy leads to an late Ts, with the early Ts being highly disfavoured. Exothermic reactions are late transition states, therefore has products with increased amount of vibrational energy, and lower translational as energy must be conserved. [3] For an endothermic reaction, this is simply reversed.
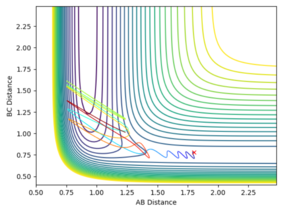
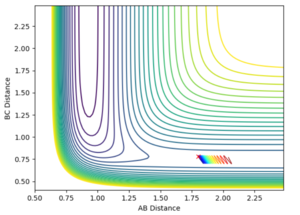
A set up of AB=1.8 and BC=0.78 were used to see the rules for our exothermic reaction. The momenta were set to -0.55 and 0.15 respectively, followed by a run of the inverse of this. Run 1 showed product being formed, however run 2 showed no product being formed, mainly due to it's initial momentum being in the wrong direction. This being the exothermic part of the reversible reaction, it has a late transition state, therefore the vibrational energy is seen to show the best efficacy towards driving the reaction on.
References
- ↑ http://www.wiredchemist.com/chemistry/data/bond_energies_lengths.html (Assessed on 16/05/2018 18ː53).
- ↑ Evans, M. G.; Polanyi, M., J. Chem. Soc., Faraday Trans., 1936, 32, 1340.
- ↑ Z. Zhang et al, J.Phys. Chem. Lett., 2012, "Theoretical Study of the Validity of the Polanyi Rules for the Late-Barrier Cl + CHD3 Reaction", Vol. 3 (23) p.3416–3419.

