MRD:FMJ17
Exercise 1
On a potential energy surface diagram, how is the transition state mathematically defined? How can the transition state be identified, and how can it be distinguished from a local minimum of the potential energy surface?
The transition state is defined as the point at which the potential gradient is zero, δV(ri)/δ(ri)=0. Contrary to local minima in the enrgy surface, the transition state will be at the point along the reaction path where the energy is maximum.
Not sure you fully understand this by reading your statement. Strictly, first of all, transition state is the maximum point along the MINIMUM energy reaction path way. Not any reaction pathway. Second, you also need to demonstrate what is going on with the second derivatives. Overall, a saddle point, in this case, the TS point, is a point where in a 3-dimensional space, it is both a maximum and a minimum at the same time, depending on which plane you are looking at. That differentiates from a local minimum or a maximum, because whichever plane you are looking at, it's always a minimum or a maximum. Please check the figure that I attached.  Sw2711 (talk) 12:45, 30 May 2019 (BST)
Trajectories from r1 = r2: locating the transition state
transition state position, rts=0.90775 Å
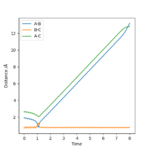
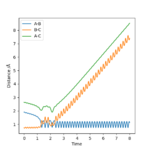
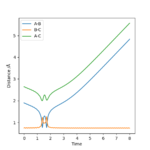
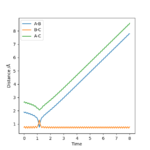
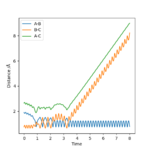
Internuclear Dictances vs Time Plot
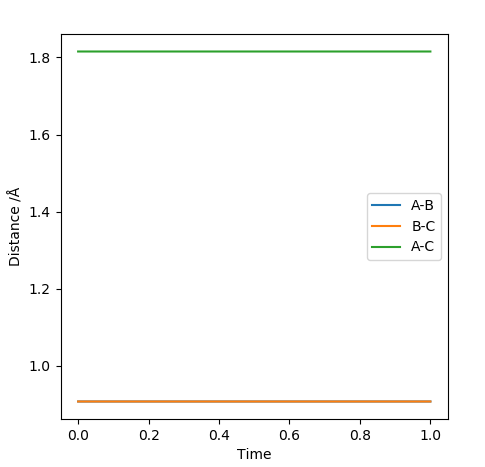
Yes, you have confirmed it. But you need to tell your approach to 0.90775 A too.Sw2711 (talk) 12:46, 30 May 2019 (BST)
Calculating the Reaction Path
Minimum Energy Pathway Calculation
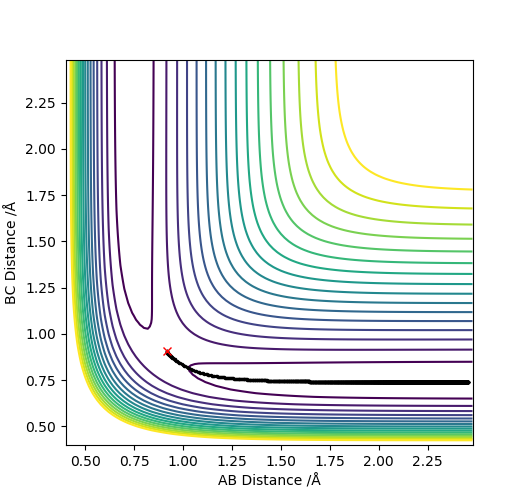
The figure below shows a surface plot obtained using the MEP calculation type. The black line illustrates the reaction path (from the transition state to the products).
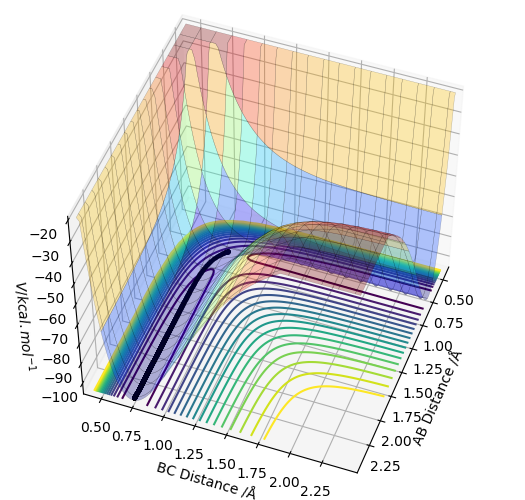
Below is the contour plot, showing the same reaction path. (black line)
Comparing Dynamics and MEP Calculation Types
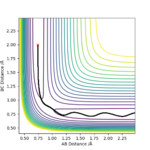
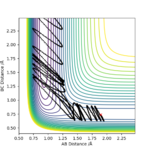
Below is a surface plot obtained by using the dynamics calculation type.
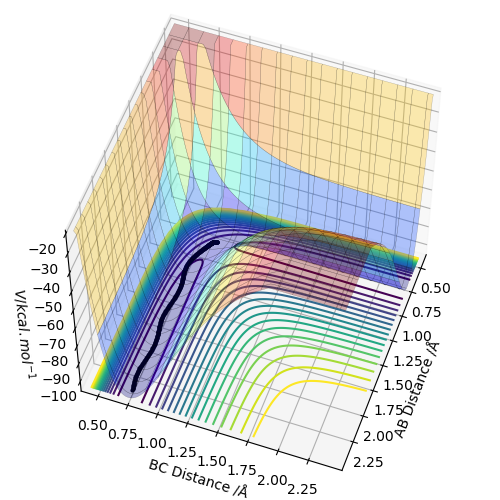
Again, the black line shows the the reaction path (from the transition state to the products). This calculation was made using the same initial conditions as the MEP calculation above.
The two trajectories calculated using the two calculation types are different. The dynamic calculation indicates vibrations (curves on the line), while the MEP calculation does not (no curves).
Are there any more differences? What caused those differences? What's the difference in each algorithm? Sw2711 (talk) 12:48, 30 May 2019 (BST)
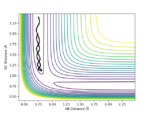
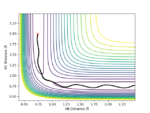
Reactive and unreactive trajectories
Good enough, but where is your answer for the question about the transition state theory? Sw2711 (talk) 12:50, 30 May 2019 (BST)
Exercise 2
Potential Energy Surface inspection of F-H-H system
Below is a surface plot for the F-H-H system.
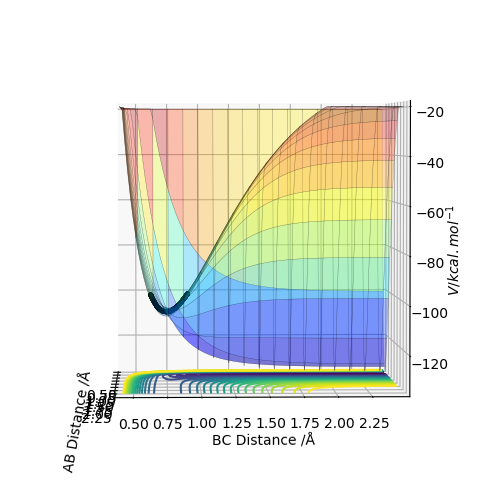 It shows H-H and F as being more energetic than F-H and H. This indicates that the reaction between H-H and F is exothermic and that the H-F bond is stronger than the H-H bond. It also indicates that the reaction between H-F and H is endothermic, again because the H-F bond is stronger than the H-H bond.
This part is good. Sw2711 (talk) 12:51, 30 May 2019 (BST)
Transition State
Below is a surface plot showing the position of the transition state (black dot) of the H-H + F reaction.
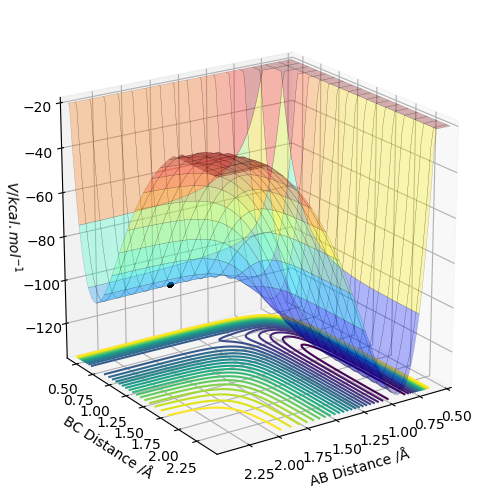
Again, where is your approach? Sw2711 (talk) 12:51, 30 May 2019 (BST)
Activation Energy
The activation energy for the H-H + F reaction is 30 kcal/mol.
The activation energy for the H-F + H reaction is 0.15 kcal/mol.
This part is alright. But you still need to improve your methodology descriptions. Not everyone knows what those two pictures mean or how to interpret the pictures. Sw2711 (talk) 12:52, 30 May 2019 (BST)
Reaction dynamics
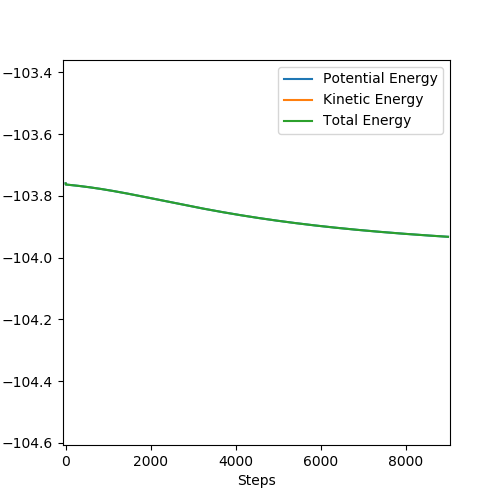
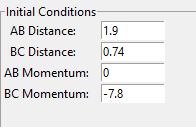
A set of initial conditions which result in a reaction is shown below.
This is the momentum vs Time graph for the reaction trajectory resulting from the initial conditions above.
In light of the fact that energy is conserved, discuss the mechanism of release of the reaction energy. Explain how this could be confirmed experimentally.
The formation of HF is an exothermic process. The formation of the H-F bond releases more energy than is used to break the H-H bond. This can be confirmed by observing an increase in temperature corresponding to the release of energy.
So why is that conserved? You need to explain better. Sw2711 (talk) 12:56, 30 May 2019 (BST)
Polanyi's Empirical Rules
For a reaction with a late transition state, that is the transition state is closer in structure to the products than it is to the reactants, it's success will depend more on the vibrational energy of the reactant molecule than it will on the translational energy of said molecules. For a reaction with an early transition state, the opposite is true; translational energy will be at the main promoter of the reaction. So based on your experiments above, do you agree or disagree with the Polanyi's rules?Sw2711 (talk) 12:58, 30 May 2019 (BST)

