MRD:FHT14INMD
Molecular Reaction Dynamics: Applications to Triatomic systems
Exercise 1: H + H2
Assessing Transition States & Minima by Potential Energy Surface Curvature
What value does the total gradient of the potential energy surface have at a minimum and at a transition structure? Briefly explain how minima and transition structures can be distinguished using the curvature of the potential energy surface.
At a transition structure, the geometry of system is stable—it moves towards neither the products nor the reactants. If it is given some small momentum—or the geometry changed—in order to favour one side, then the system will continue to move towards that side. This defines the transition state as a simple saddle on the Potential Energy surface. As such we know that the gradient at such a point is zero.
(Correct Je714 (talk) 11:17, 15 May 2017 (BST))
The same is also true at a minimum. We can imagine that if one placed a ball at a point on the energy surface, then the wells where the ball rolls to are the minima, and where the ball is unstably balanced we have the transition state.

(The ball analogy is not wrong and is useful to understand the concept, but is not really rigorous. We're looking for a discussion (either in English or with maths) about the difference in curvatures between a minimum, a maximum and a saddle point in a two-dimensional function. For this, you need to discuss the signs of bot the first and second partial derivatives in the directions of the two variables upon which the function depends. See this for more information: https://www.wikiwand.com/en/Second_partial_derivative_test Je714 (talk) 11:17, 15 May 2017 (BST))
Locating the Transition State
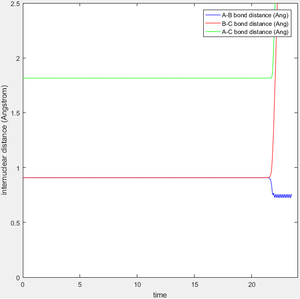
Report your best estimate of the transition state position (rts) and explain your reasoning illustrating it with a “Internuclear Distances vs Time” screenshot for a relevant trajectory
As stated above, the transition state position is where system does not move towards the products or reactants. As the system is of three linear hydrogen atoms we can intuit that the transition state is symmetrical about the central atom. This means that the A-B bond length will be equal to the B-C bond length. Taking an arbitrary point where rAB = rBC results in an oscillation along the saddle point. This oscillation could be well visualised in an Internuclear Distance v Time plot. The transition state position is the point on this ridge with the lowest Potential Energy, which must be the centre of this ridge-oscillation. Looking at the coördinates of this centre allows us to further refine a value for this transition state internuclear separation, rts. Following this process resulted in a value rts = 0.90774248725 Å, a system which remained at the transition state for >22 seconds before ultimately forming HAHB + HC.
(How much more decimals you can report? You can do that forever with sufficient time and patience -- the TS is a mathematical definition, it's a 0-dimensional point on a two-dimensional surface. You can always get arbitrarily close to it, and you'll still be infinitesimally far away from it. Je714 (talk) 11:20, 15 May 2017 (BST))
Trajectories from near the Transition State
Comment on how the mep and the trajectory you just calculated differ.
Two different calculation types can be used for a set of initial conditions—Dynamics and MEP. Dynamics follows the trajectory of the initial conditions across the Potential Energy surface. MEP differs by setting the velocity, and therefore momentum, to zero at each step in the calculation. This means that the system only ever can decrease in energy—it would need momentum to "roll up" the surface, i.e. increase its Potential Energy. This also means that the system never oscillates—stretching or contracting the bond from its equilibrium length would increase the energy. As such in a Dynamics simulation, as the system moves away from the transition point its velocity builds—it is falling down a slope. As it moves firmly into either the reactants or products side, the gradient decreases, but the system keeps its momentum—continuing to move increasing the separation. We compare this for an MEP simulation, where as this gradient decreases, the system increases its separation slower and slower.
Below are the Dynamics and MEP Internuclear Separation v Time for the initial conditions r1 = rts + 0.01, r2 = rts, p1 = 0, p2 = 0. In both of calculations the end result is HBHC + HA. The main difference is the speed at which the system reaches this result. As expected Dynamics reacts faster than MEP—the H2 and H are 17.7 Å apart after 5 seconds for Dynamics, versus 1.4 Å for MEP.

(Good explanation. Je714 (talk) 11:22, 15 May 2017 (BST))
Reactive and Unreactive Trajectories
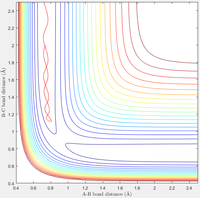
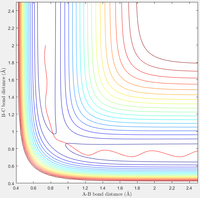
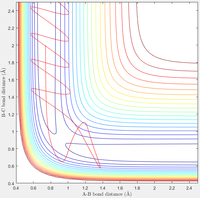
Complete the table by adding a column reporting if the trajectory is reactive or unreactive. For each set of initial conditions, provide a screenshot of the trajectory and a small description for what happens along the trajectory.
| Contour Plot |  |
 |
 |
 |
 |
|---|---|---|---|---|---|
| Reactive? | Yes | No | Yes | No | Yes |
| p1 | -1.25 | -1.5 | -1.5 | -2.5 | -2.5 |
| p2 | -2.5 | -2.0 | -2.5 | -5.0 | -5.2 |
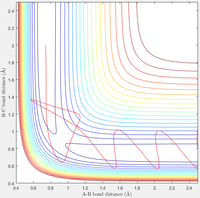
A: Here the reaction easily moves from the reactants to the products
B: Now when given more vibrational energy, but less translational energy, the reaction does not occur—the system ultimately falls back to the reactants
C: When given the same original translational energy the reaction now does occur, demonstrating the more significant impact of translational energy than vibrational
D: Here both energies have been doubled, but the reaction no longer occurs. Notably now though, the system does cross the Transition State, but recrosses it and falls back to the reactants
E: Finally, by slightly increasing the translational energy we achieve the reaction. albeit via crossing the Transition State three times. This demonstrates, along with D, that for high energy conditions the result becomes increasingly unintuitable
The Transition State Theory
State what are the main assumptions of Transition State Theory. Given the results you have obtained, how will Transition State Theory predictions for reaction rate values compare with experimental values?
The main assumptions of the Transition State Theory are described well in Truhlar et al (1996).[1] Speaking of them in terms of our Potential Energy surfaces they are that we can divide the surface into a region corresponding to the reactants, and one corresponding to the products. In the above table we take the reactants to be the top region, and the products the section of the valley on the right. These two regions are separated by the transition state region. The second assumption is that a system does not cross and then recross this transition state region. Looking at the penultimate simulation in the table above, we see that we can cross this region multiple times. As such the TST would treat this example as a reaction, despite the fact that it ultimately ends up remaining on the reactants side. This means that the TST prediction of reaction rate will be higher than it is in actuality.
http://pubs.acs.org/doi/abs/10.1021/jp953748q
(Good. Barrier recrossing is the main limitation of TST which you do observe in some of your previous trajectories. Je714 (talk) 11:23, 15 May 2017 (BST))
Exercise 2: The F-H-H System
Potential Energy Surfaces and Reaction Energetics
Classify the F + H2 and H + HF reactions according to their energetics (endothermic or exothermic). How does this relate to the bond strength of the chemical species involved?
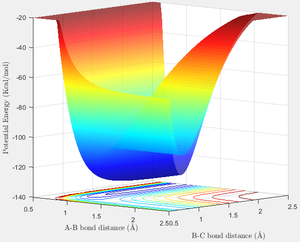
Below is the Potential Energy surface for the system A(F), B(H), C(H). From this it is clearly seen that the side with a low A-B bond length is region where F-H + H is found, and the side with low B-C bond length is for F + H2. Imagining a path from the F + H2 side to F-H + H therefore describes the reaction F + H2 → F-H + H. This corresponds to a decrease in Potential Energy, and is therefore exothermic. Similarly moving in the opposite direction, F-H + H → F + H2, follows an endothermic reaction path.
We can corroborate this by looking at the bond energies. The F-H bond has a strength of 568 kJmol-1, and the H-H of 436 kJmol-1. Clearly the cleavage of H-H and the formation of F-H results in a net release of energy—132 kJmol-1.
Then going back to the PE surface plot we can find a rough estimate for this reaction energy. The reactants side sits at -103.9 kcalmol-1, and the products at -133.9 kcalmol-1—a difference of 30 kcalmol-1, or 126 kJmol-1, approximately what was determined above.
Locating the Transition State
Locate the approximate position of the transition state.
Similarly to when finding the Transition State for the HAHB + HC → HA + HBHC, a set of coördinates for which the system could stably sit was sought. It is not readily clear from the PE surface shown above where this transition state is, except that it will be on the H2 + F side—and close to it in energy. As such we know that by Hammond's Postulate that the geometry of the Transition State will resemble that of H2 + F, due to their closeness in energy.
An initial BC bond length was thereby chosen to be near the H-H bond length, 0.74 Å. The AB bond length corresponding to this value in the valley was therefore approximately 1.8 Å. The nearby region was scanned through, seeking higher energy, stabler, initial coördinates.
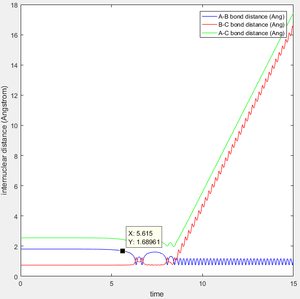
The result of this search were the bond lengths of rAB = 1.8107 Å, and rBC = 0.7448727 Å. From the below Internuclear Distances v Time plot (Dynamics), we can see that these coördinates were stable for 5 seconds, before reacting to form F-H and H.
Activation Energies
Report the activation energy for both reactions.
Now that coördinates for the Transition State have been determined, we can readily find its Potential Energy. The easiest way to do this was by doing a Potential Energy v Time plot for a very low number of steps. The PE at any point is easier to read here than from the original Surface Plot. This give a value of -103.752 kcalmol-1.
A more precise value for the Potential Energy at either 2.5 Å side can be similarly found. An MEP plot ensures that we are taking the PE from the base of the valley in the surface. This give values of -103.932 kcalmol-1, and -133.940 kcalmol-1, for the H2 and F-H sides respectively.
From these the activation energies are readily calculated—they are merely the differences between each side and the Transition State.
(Good use of MEP from the TS geometry to accurately report the Ea values. Je714 (talk) 11:25, 15 May 2017 (BST))
Release of the Reaction Energy
In light of the fact that energy is conserved, discuss the mechanism of release of the reaction energy. How could this be confirmed experimentally?
In the following section these initial conditions were used: r1 = 1.85, r2 = 0.75, p1 = -0.5, p2 = 0. This corresponds to starting on the F + H2 side, giving it a small amount of translational energy, and giving it no vibrational energy. These conditions ultimately result in the formation of FH + H, the exothermic reaction.
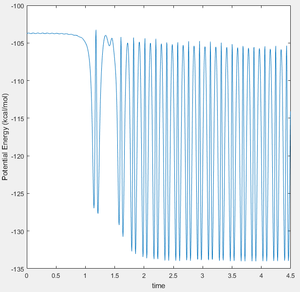
Below are the resulting Kinetic Energy and Potential Energy v Time plots for this reaction. As energy is conserved in a reaction, we know that the Potential Energy has been transformed into Kinetic Energy. Also both of these plots have a high level of oscillation—due to the deep well one must cross to reach the reactants—but it is still clearly visible that the system has gained a lot of kinetic energy.
Molecules having high kinetic energy corresponds to a high system temperature. As such one could confirm this mechanism for reaction energy release by measuring the temperature increase of the F + H2 → F-H + H reaction—a simple calorimetry would suffice.
| KE v Time | PE v Time |
|---|---|
 |
 |
Vibrational v Translational Energy
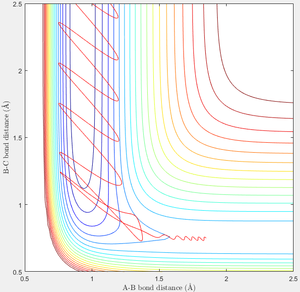
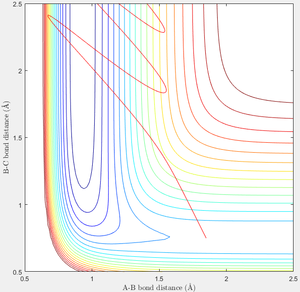
In the above reaction, F + H2 → F-H + H, in order to cross the Transition State, the system needs to move negatively along the A-B axis—it is already at a similar BC coördinate. The momentum corresponding to this change is a negative AB momentum—translational energy. Vibrational energy does effectively achieve this. A significantly larger positive BC momentum would be required to cross the transition state when no translation energy is present. These two cases—p = -0.5, p = 0, and p = 0, p = 7—are displayed below.
| Translational | Vibrational |
|---|---|
 |
 |
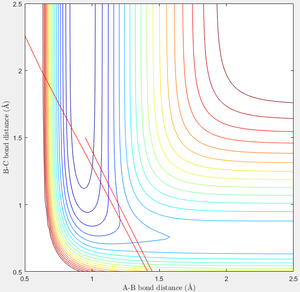
When seeking to perform the reverse reaction, F-H + H → F + H2, what is required differs. From the bottom of the F-H + H well the system is further away from the transition state in the BC direction than the AB direction. As such it requires an incredibly negative BC momentum, or a large positive AB momentum—the opposite requirements to the forwards reaction. Below are the cases—p = 14, p = 0, and p = 0, p = -90. Here it is seen that even with an incredibly high BC momentum, the transition state is not crossed. Looking at the contour plots it is clear that the amount of AB deflection gained from hitting the bottom wall is less than the amount of BC deflection gained from hitting the left wall—this demonstrates why AB momentum is more effective at reaching the transition state.
| Translational | Vibrational |
|---|---|
 |
 |
This relates to Polanyi's empirical rules which state that translational energy favours the exothermic reaction, and vibration favours the endothermic.[2] AB momentum—translation—more readily causes the forwards reaction, and AB momentum—vibration—more readily causes the reverse reaction. The most effective energy is the one which results in a faster approach of the Transition State.
(GJ on the discussion with examples.Je714 (talk) 11:26, 15 May 2017 (BST))
