MRD:ED2618
Molecular Reaction Dynamics
In this lab, molecular dynamic trajectories are used to study the reactivity of triatomic systems; namely, when an atom collides with a diatomic molecule.
EXERCISE 1: H + H2 system
For this exercise, the following reaction is analysed and discussed: HA + HBHC → HAHB + HC, where r1 = BC and r2 = AB.
Dynamics from the transition state region
Question 1: On a potential energy surface diagram, how is the transition state mathematically defined? How can the transition state be identified, and how can it be distinguished from a local minimum of the potential energy surface?
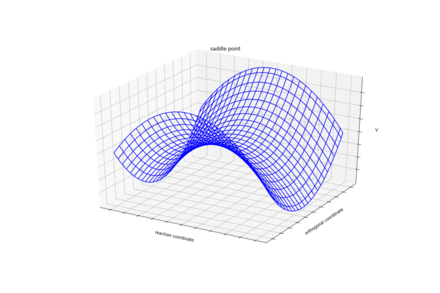
Answer 1: On a potential energy surface diagram the transition state is defined, mathematically, as a saddle point. A transition state is the maximum energy present in the minimum energy pathway taken from reactants to products. A saddle point is of symmetric configurationIt isn't symmetric if different atoms are used. Pu12 (talk) 21:23, 11 June 2020 (BST)
at which the distance between three separate atoms is the same.
A saddle point is different to a local minima. For both, the first partial derivative is equal to zero:
∂V(ri)/ ∂ri = 0
However, the saddle point and local minima may be distinguished though inspection of their second partial derivatives. For a local minima, calculating partial second derivatives in orthogonal directions to the saddle point will give a result that is greater than 0, independent from which plane it has been measured. By contrast, for the saddle point, its second partial derivative will either be greater than zero or smaller than zero, dependent on which plane it has been measured. This explanation is summarised below:
For a local minima: ∂2V(ri)/ ∂ri2 > 0
For a saddle point: ∂2V(ri)/ ∂ri2 > 0 or ∂2V(ri)/ ∂ri2 < 0[1]
Caution. When looking at the second derivatives, it is not the A-B and B-C distances that you necessarily want to be using as variables. It will be the reaction coordinate (in this case rAB-rBC or -rAB+rBC) and the orthogonal direction (in this case rAB+rBC). João (talk) 11:19, 14 June 2020 (BST)
An example of a saddle point can be seen in Figure 1.
Trajectories from r1 = r2: locating the transition state
Question 2: Report your best estimate of the transition state position (rts) and explain your reasoning illustrating it with a “Internuclear Distances vs Time” plot for a relevant trajectory. Good answer overall. Pu12 (talk) 21:23, 11 June 2020 (BST)
Answer 2: The transition state occurs at the saddle point, which is of symmetric configuration. Hence, r1 = r2 as the H + H2 surface is symmetric, where, r1 = BC and r2 = AB. At the transition state p1 = p2 = 0 g.mol-1.pm.fs-1. Through trial and error an estimate for the transition state position is when AB = BC = 90.775 pm. Using this distance produces the contour plot below. It can be seen that there is no trajectory of motion orthogonal to the point of the transition state (red cross). There are no forces acting along either AB or BC, thus confirming that this is a transition state.
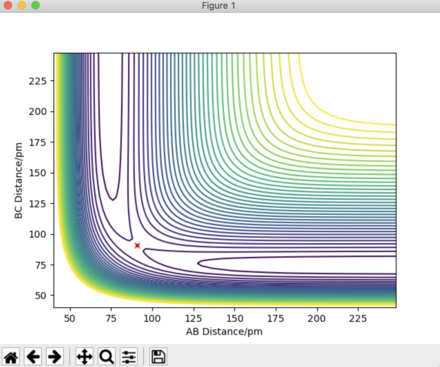
The plot of 'Internuclear Distances vs Time' below shows the distances of A-B, B-C, and A-C constant with time, consolidating the fact that this is the transition state position. Running an animation with the r1 = r2 = 90.775 pm shows the species as stationary, as there are no fluctuations of internuclear distance with time.

Good. Pu12 (talk) 21:23, 11 June 2020 (BST)
Trajectories from r1 = rts + δ, r2 = rts
Question 3: Comment on how the mep and the trajectory you just calculated differ.
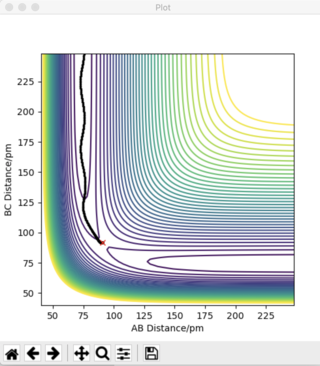
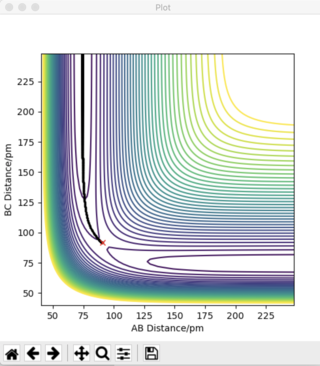
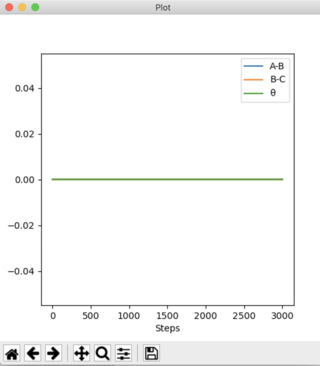
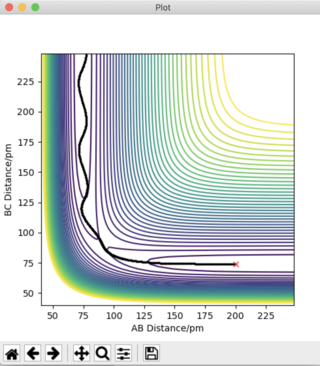
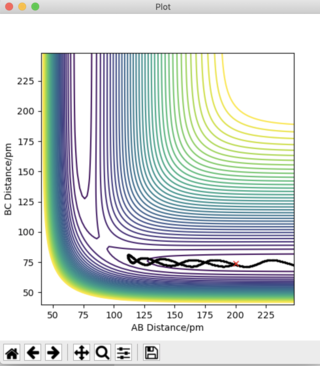
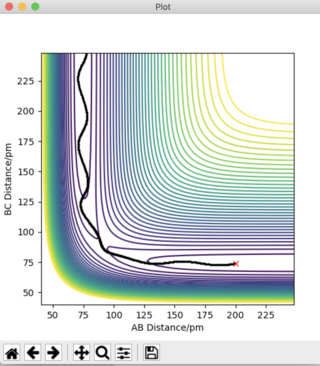
Answer 3: The initial conditions are set so that the system is slightly displaced from the transition state, and so that the system has no momentum. r1 = rts + 1 pm, r2 = rts and the momenta p1 = p2 = 0 g.mol-1.pm.fs-1. This is shown in the figures below, where r1 (BC) = 91.775 pm and r2 (AB) = 90.775 pm. To obtain a complete MEP the step number was increased to 3000.
It can be deduced that the trajectory is greatly dependent on calculation type. Using the MEP calculation, the momentum is reset to zero after each step. This provides an unrealistic account of the motion of the atoms during the reaction thus, explaining the absence of any type of oscillation in the MEP calculation. The Dynamics calculation accounts for the vibrational energies possessed by the molecules, highlighting the presence of oscillations along the trajectory in Figure 4a.
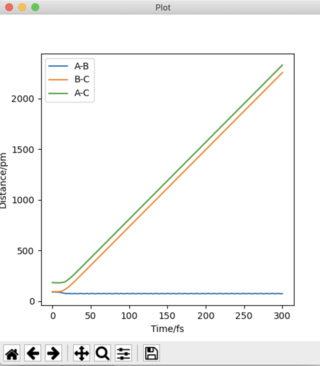
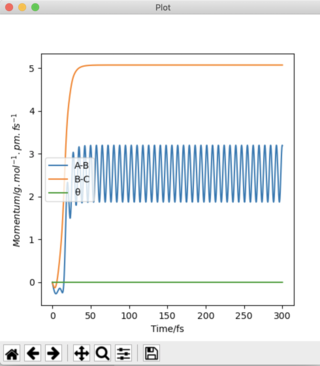
Plots of "Internuclear Distances vs Time” and “Momenta vs Time” are also provided and more clearly depict the differences in these calculation types.
The Dynamics calculation accounts for the extra kinetic energy obtained after bond formation, which manifests itself into excess vibrational energy. This can be seen in the small oscillations of the A-B bond in Figure 4b. Using the MEP calculation, this A-B bond distance remains constant over time, indicating the excess vibrational energy has not been accounted for. The increased momentum of the B-C bond indicates HC moves with translational energy. In addition, the oscillating momentum of the A-B bond indicates the new HAHB bond moves with increased vibrational energy.
Figure 5c shows a straight line at 0 g.mol-1.pm.fs-1. The momentum is zero for the reaction pathway. This calculation type resets the momentum to zero after every step, hence this result is expected. Figure 4c shows an oscillation of momentum with time, as through this calculation type, momenta is not reset to zero after each step.
If the initial conditions were changed so that r1 = rts pm and r2 = rts + 1pm, the blue and orange lines would swap positions in Figures 4b, 4c, 5b, and 5c.
Reactive and unreactive trajectories
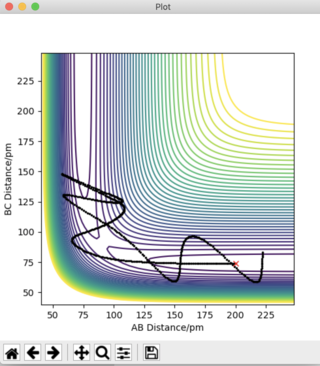
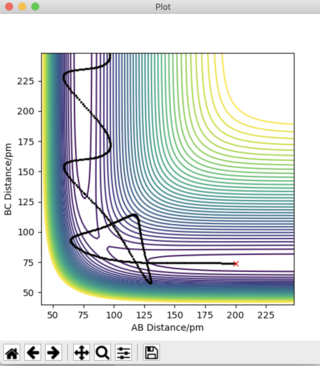
Question 4: Complete the table below by adding the total energy, whether the trajectory is reactive or unreactive, and provide a plot of the trajectory and a small description for what happens along the trajectory. What can you conclude from the table?
With the initial positions r1 = 74 pm and r2 = 200 pm, reaction trajectories were run with the following momenta combination:
From this table it may be concluded that the reactants must have sufficient energy to overcome the activation barrier to reach and surpass the transition state. This, however, is not the only factor that has to be considered for reaction success. The products must not have too much vibrational energy or they could convert back to the reactants. This example is observed in row 4 of the above table. Good. Pu12 (talk) 21:23, 11 June 2020 (BST)
Transition State Theory[2]
Question 5: Given the results you have obtained, how will Transition State Theory predictions for reaction rate values compare with experimental values?
Answer 1: Transition State Theory is derived through the postulated quasi-equilibrium between a transition state species and the reactant molecules. There are a number of assumptions that are made upon derivation of the Transition State Theory rate expression:
- Electronic and nuclear motions are separated, similar to the Born-Oppenheimer approximation in quantum mechanics.
- Reactant molecule are distributed among their states in accordance with the Maxwell-Boltzmann distribution.
- Once a molecular system has crossed a transition state, in a direction towards the products, it is unable to turn around and re-form the reactants.
- In the transition state, any motion that occurs along the reaction coordinate can be treated independently of other motions. This motion is treated classically as a translation.
- Even in the absence of an equilibrium between reactant and product molecules, the transition states in the process of becoming products are distributed among their states in accordance with the Maxwell-Boltzmann laws.
In rows 4 and 5 of the table above, the transition state is crossed and re-crossed numerous times thus, contradicting the assumption made by the Transition State Theory that a molecular system cannot regress back to the reactants once it has passed the transition state towards the products. The recrossing of the transition state ultimately lowers the rate of reaction, and thus Transition State Theory predicts a reaction rate that is larger to what is experimentally observed. Transition State Theory fails to evaluate molecular systems using quantum mechanical phenomena such as tunnelling, hence highlighting the discrepancy between the observed and theoretical reaction rates.
EXERCISE 2: F - H - H system
In this exercise A=F, B=H, and C=H. r1 = BC and r2 = AB.
PES inspection
Question 1: By inspecting the potential energy surfaces, classify the F + H2 and H + HF reactions according to their energetics (endothermic or exothermic). How does this relate to the bond strength of the chemical species involved?

Answer 1:
In this discussion, atoms F, H, and H are consigned to A, B, and C respectively. A large BC distance means that A and B are bonded, thus the HF + H system is consigned to this axis. An increasing AB distance means that B and C are bonded, thus this axis is consigned to the F + H2 system. As shown in Figure 6, the HF + H system is lower in energy than the F + H2 system.
Thus the reactions:
- HF + H → H2 + F is endothermic. (Products higher in energy than reactants)
- F + H2 → HF + H is exothermic. (Reactants higher in energy than products)
The HF (565 kJ.mol-1) bond is much stronger than the HH bond (436 kJ.mol-1)[3], thus the HF molecule is more stable than the H2 molecule. This is due to the large difference in electronegativity between H and F, resulting in a strongly ionic bond. This is a stronger bonding interaction than the purely covalent one that occurs between the two hydrogen atoms.
Question 2: Locate the approximate position of the transition state.
Answer 2: Hammond's postulate[4] states that the transition state of a given reaction will resemble either the products or the reactants, depending on which one is higher in energy, as the transition state is the maximum energy present in the minimum energy pathway taken from reactants to products. Thus, for an endothermic reaction, the products are higher in energy than the reactants, and so the transition state will resemble the products. Conversely, for an exothermic reaction, the reactants are higher in energy than the products, and so the transition state will resemble the reactants.
The reaction of HF + H → H2 + F is endothermic and thus the transition state will resemble the products in structure. Thus the HH bond distance will be set to around 74.14 pm.[3]
F + H2 → HF + H is exothermic and thus the transition state will resemble the reactants in structure. Hence, the HH bond distance will be set around 74.14 pm, as above.
The value of the HF bond distance is expected to be much greater than its 91.68 pm[3] bond distance as there is limited association between the two atoms.
The transition state was found when r1 (BC) = 74.485 and pm r2 (AB) = 181.200 pm. At this position there are no forces acting along either AB or BC.
 |
 |
Figure 7 above shows that there is no trajectory of motion at right angles to the point of the transition state (red cross). The plot of 'Internuclear Distances vs Time' in Figure 8 shows the distances of A-B, B-C, and A-C constant with time, consolidating that this is the transition state position. These lines are straight and have no oscillatory character, indicating no intermolecular vibrations are occurring.
Question 3: Report the activation energy for both reactions.
Answer 3: The kinetic energy of the transition state is -433.981 kJ.mol-1. The activation energy can be found through running an MEP calculation of a structure slightly offset from that of the transition state. The initial positions were set so that:
For the exothermic reaction, where F + H2 → HF + H:
- r1 (BC) = 74.485 pm = rts
- r2 (AB) = 182.200 pm = rts + 1 pm
- p1 = p2 = 0 g.mol-1.pm.fs-1
For the endothermic reaction, where HF + H → H2 + F:
- r1 (BC) = 74.485 pm = rts
- r2 (AB) = 180.200 pm = rts - 1 pm
- p1 = p2 = 0 g.mol-1.pm.fs-1
Good. Pu12 (talk) 21:23, 11 June 2020 (BST)
Reaction dynamics
Question 4: In light of the fact that energy is conserved, discuss the mechanism of release of the reaction energy. Explain how this could be confirmed experimentally.
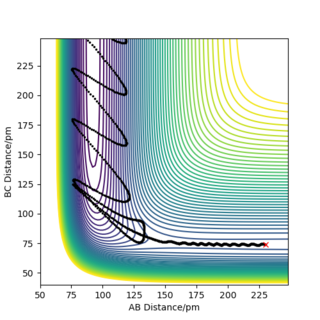
Answer 4: The set of initial conditions that results in a reactive trajectory for the reaction F + H2 → HF + H is given as follows:
- r1 (BC) = 74 pm
- r2 (AB) = 230 pm
- p1 (BC) = -0.75 g.mol-1.pm.fs-1
- p2 (AB) = -2.00 0 g.mol-1.pm.fs-1
- 2000 steps at 0.1 fs
This reactive trajectory is show in Figure 9:
The reaction F + H2 → HF + H is exothermic, meaning that the products possess a lower energy than the reactants. The energy discrepancy between reactants and products is released as heat to the surroundings. Figure 10 shows a plot of momenta vs time for this system. The H2 molecule approaches the F atom with low oscillatory momenta. The HH bond is broken and a new HF bond is formed. The energy released upon the HH bond breaking is greater than the energy required to form the HF bond. Upon collision of the molecules, the HF bond now oscillates with a much greater amplitude than possessed by the H2 molecule prior to collision. This is due to the release of excess energy. The unexpected drop in momenta at t = 110 fs is due to recrossing of the transition state, as can be seen in Figure 9. After collision, the H atom moves off with a much slower velocity, as is indicated by the straight line in Figure 10.
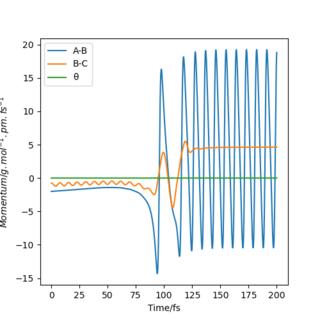
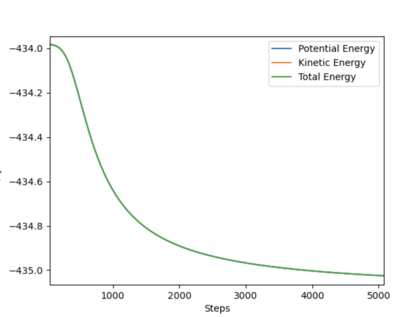
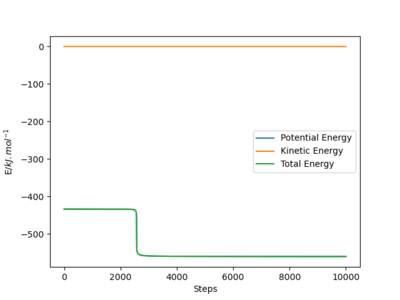
As energy must always be conserved, the increased kinetic energy of the system is compensated for by a decrease in potential energy, as indicated in Figure 11. This plot shows that the total energy of the system remains constant at - 433.372 kJ.mol-1. There is no energy loss but instead, it is converted from one form to another, in line with the law of conservation of energy.
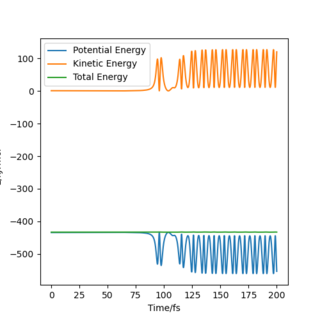
As this reaction is exothermic, energy is released to the surroundings in the form of heat. To confirm experimentally that this reaction has occurred, calorimetry could be used. Calorimetry may be used to identify changes in enthalpy of a reaction. However, this method may underestimate the heat energy released by the reaction as heat may be lost to the surrounding environment.
Another method to confirm that the reaction has gone to completion is through analysis of IR data. The vibrational energy of the HF molecule after collision is greatly increased after collision of F with H2. This would produce overtone bands as the HF molecule is excited from a lower vibrational energy to a higher vibrational energy. Good. Pu12 (talk) 21:23, 11 June 2020 (BST)
Question 5: Discuss how the distribution of energy between different modes (translation and vibration) affect the efficiency of the reaction, and how this is influenced by the position of the transition state.
Answer 5: Polanyi's empirical rules[5] explain the dependence of a reaction's success on the way the energy of the reactants is distributed among different modes. For an exothermic reaction, the reactants are higher in energy than the products, thus the reactants resemble the transition state more than the products do. This system is said to have an early transition state. For a reaction to be successful, not only must the reactants have sufficient energy to overcome the activation barrier, they must also possess the right type of energy.
For an exothermic reaction, one possessing an early transition state, Polanyi's rules state that translational energy proves more useful than vibrational energy when overcoming the energy barrier from reactants to products. Conversely, for an endothermic reaction with a late transition state, vibrational energy is more critical than translational energy when overcoming this energy barrier.
It should be noted that overcoming the transition state energy barrier leads to a high reaction success rate, however sometimes the reaction does not go to completion as the energy barrier may be recrossed.
The reaction F + H2 → HF + H is exothermic. The reactants with more translational energy as opposed to vibrational energy should prove effective at overcoming the energy barrier of the transition state. A calculation was set up for this reaction using the initial conditions:
- r1 (BC) = 74 pm
- r2 (AB) = 200 pm
- p2 (AB) = -1.0 g.mol-1.pm.fs-1
- p1 (BC) varied from -6.1 to 6.1 g.mol-1.pm.fs-1
- 5000 steps at 0.1 fs
Observations of these parameters are produced in the table below:
| P1 (BC) / g.mol-1.pm.fs-1 | Contour Plot of Reaction Trajectory | Reaction Success |
|---|---|---|
| -6.1 | 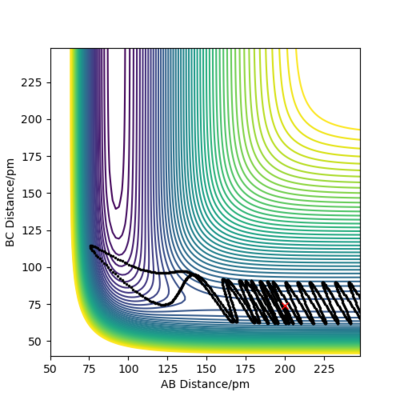
|
No |
| -3.1 | 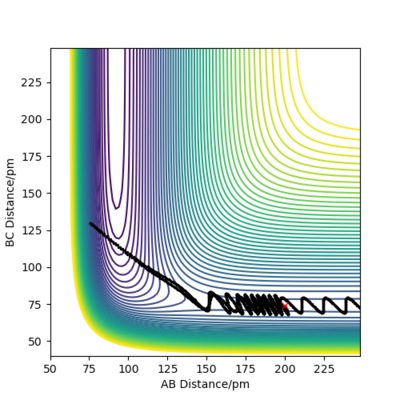
|
No |
| -1.1 | 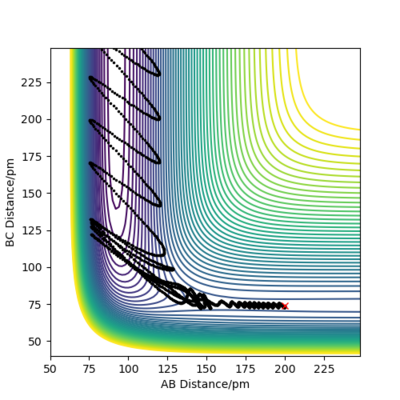
|
Yes |
| -0.5 | 
|
Yes |
| 0.0 | 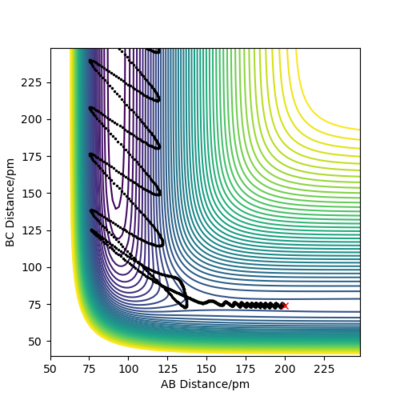
|
Yes |
| +0.5 | 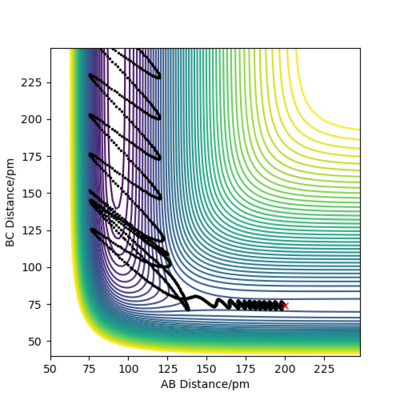
|
Yes |
| +1.1 | 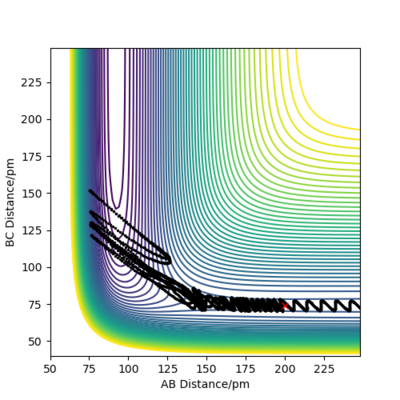
|
No |
| +3.1 | 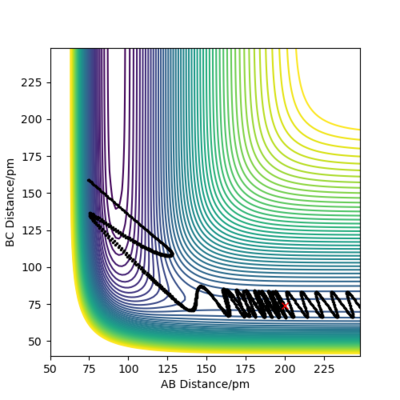
|
No |
| +6.1 | 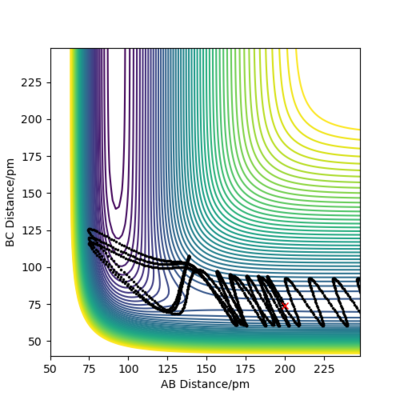
|
No |
Demonstrated by the conditions in the table above, a low absolute value (<1.1) for p1 is crucial for reaction success. Reactant molecules may pass through a transition state multiple times before either regressing back to being reactants or continuing onto becoming products. The result of these configurations may sometimes be due to dependence on more than just the type of energy possessed by the reactant molecules. To conclude, increasing the absolute value of p1 correlates to an increase in vibrational energy of the H2 molecule. In accordance with Polanyi's empirical rules, an exothermic reaction's success in crossing the energy barrier is more dependent on translational energy than it is on vibrational energy. This is demonstrated in the table above, where large absolute values of p1 do not invoke a successful reaction.

The reverse reaction: HF + H → H2 + F is endothermic, which incurs a late transition state and a preference for the reactants to possess vibrational energy over translational energy when overcoming the energy barrier.
A calculation was set up for this reaction using the initial conditions:
- r1 (BC) = 200 pm
- r2 (AB) = 74 pm
- p2 (AB) = 6 g.mol-1.pm.fs-1
- p1 (BC) = -3 g.mol-1.pm.fs-1
- 5000 steps at 0.1 fs
A high value of p2 corresponds to a high vibrational energy of the HF molecule. These initial conditions yield the successful reaction trajectory shown in Figure 12 below. Changing the initial reaction conditions so that p2 is lowered to 4 g.mol-1.pm.fs-1 (HF molecule has a lower vibrational energy) yields an unsuccessful reaction. This complements Polanyi's empirical rules of the dependence of a reactant to possess high vibrational energy (and low translational energy) to overcome a late transitions state.
To conclude, Polanyi's rule as a set of rough guidelines that can be used to measure if a reaction will proceed or not. However, sometimes small tweaks to initial conditions incur a successful reaction that may not have been deemed possible by the rules. Good report with clear explanations, well done. Pu12 (talk) 21:23, 11 June 2020 (BST)
References
- ↑ J. I. Steinfeld, J. S. Francisco, W. L. Hase, Chemical Kinetic and Dynamics 2nd ed., Prentice-Hall, Upper Saddle River, 1998.
- ↑ K. J. Laidler, Chemical Kinetics 3rd ed., Harper-Collins, Upper Saddle River, 1987.
- ↑ 3.0 3.1 3.2 P. Atkins, J. de Paula, J. Keeler, Physical Chemistry 11th ed., OUP, Oxford, 2018.
- ↑ J. Clayden, N. Greeves, S. Warren, Organic Chemistry 2nd ed., OUP, New York, 2012.
- ↑ K. J. Laidler, Chemical Kinetics 3rd ed., Harper & Row, London, 1987.

