MRD:EBR
H + H2 - Exercise 1
Question 1
What value do the different components of the gradient of the potential energy surface have at a minimum and at a transition structure? Briefly explain how minima and transition structures can be distinguished using the curvature of the potential energy surface.
At both the minimum of the potential energy surface, and the transition state, the gradient is 0. The key difference between the minimum and the transition state is that for the minimum, the potential energy is at a global minimum whereas at the transition state; the minimum energy path is at a maximum which is a saddle point of the potential energy surface. Minima and transition states can be distinguished by differentiating again and the minimum will have a differentiated output above 0 whereas the transition state, will have an second derivative of 0.
For saddle point, a second derivative of 0, are you sure? Have a look at this video. See if this makes sense to you. link--Sw2711 (talk) 17:06, 17 May 2018 (BST)
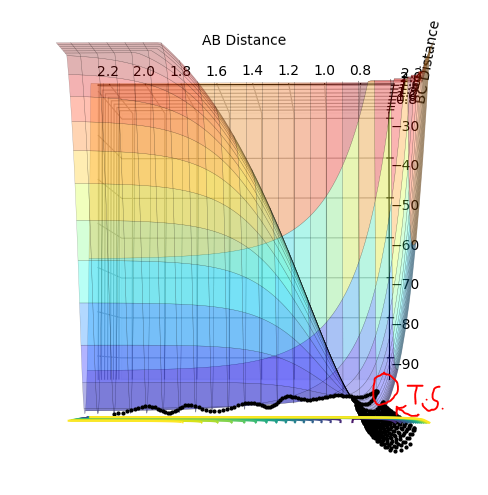
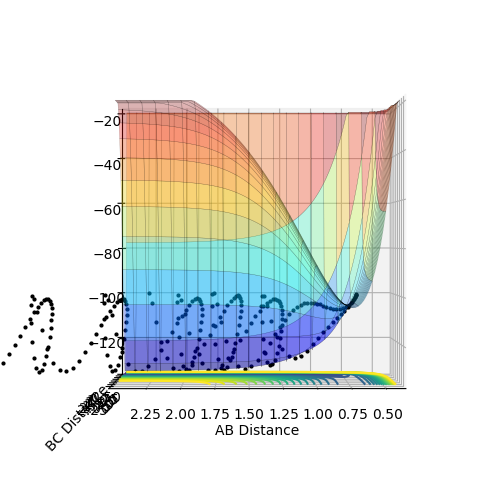
Figure 1: Contour plot of potential energy surface
Question 2
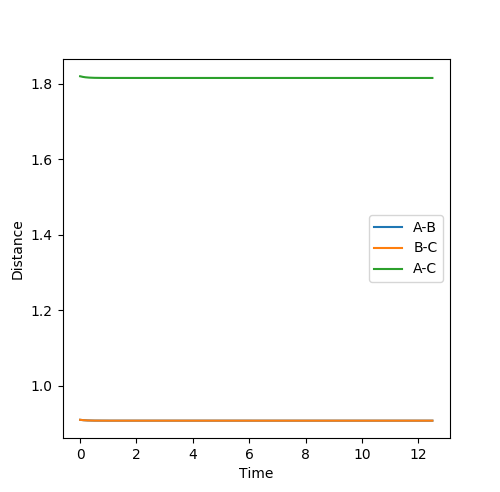
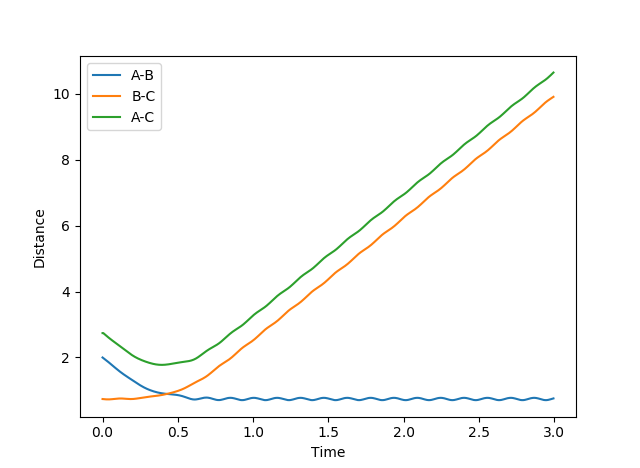
Report your best estimate of the transition state position (rts) and explain your reasoning illustrating it with a “Internuclear Distances vs Time” plot for a relevant trajectory.
The transition state can be located due to the fact that the H + H2 surface is symmetrical so at the TS, the AB and BC distances will be equal and as no forces are acting on the atoms, p1 and p2 are set to 0.
rts = 0.91 (2 dp) A
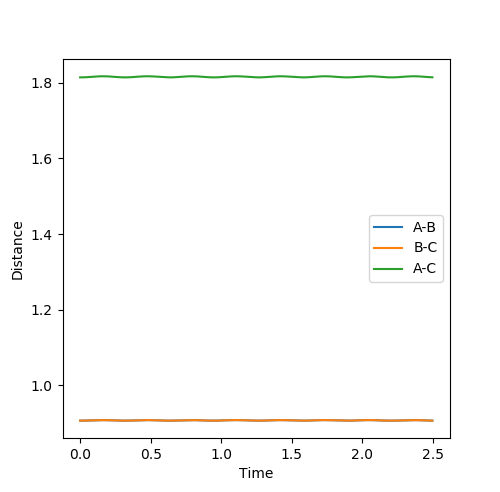
Figure 2: Plot of TS internuclear distance vs. time
The flat line represents the internuclear distance at which the transition state is at where momenta is 0 and thus the system is at the saddle point.
Good--Sw2711 (talk) 17:08, 17 May 2018 (BST)
Question 3
Comment on how the mep and the trajectory you just calculated differ.
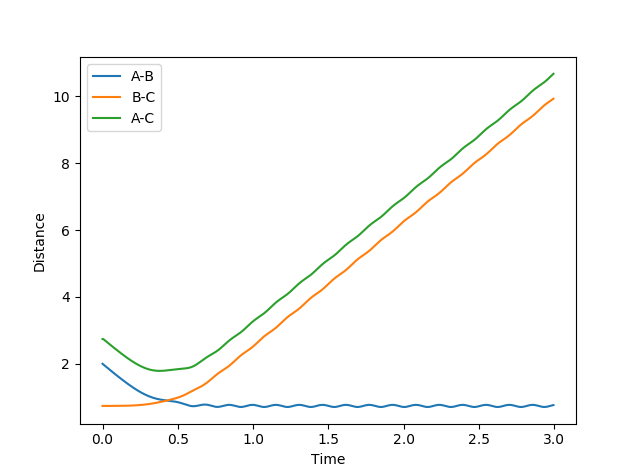
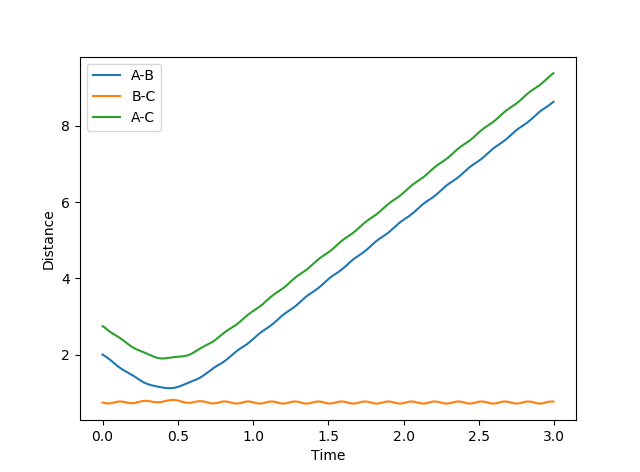
Figure 3: Plot of minimum energy path & Figure 4: Plot of dynamic trajectory
The minimum energy path (MEP) graph (figure 3) shows the distance between atoms when the velocity is set to 0 whereas the dynamic graph (figure 4) shows the oscillations of the bonded atoms vibrating by taking into account the systems momentum.
Good, just double check that you do understand. Try the first example (r1 = 0.74, r2 = 2.3, p1 = 0, p2 = -2.7) and compare using MEP and dynamics. What do you think you will get?--Sw2711 (talk) 17:12, 17 May 2018 (BST)
Question 4
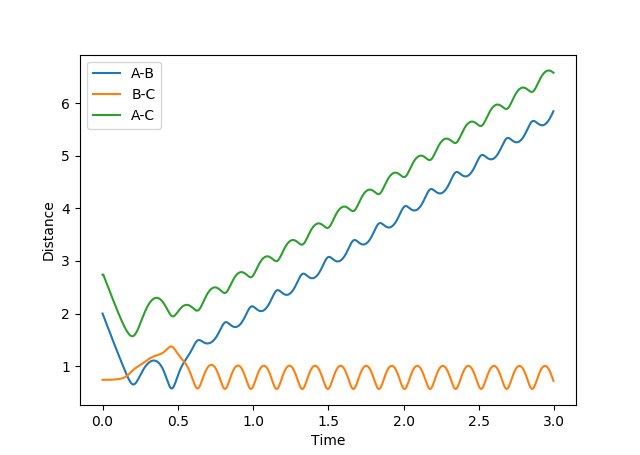
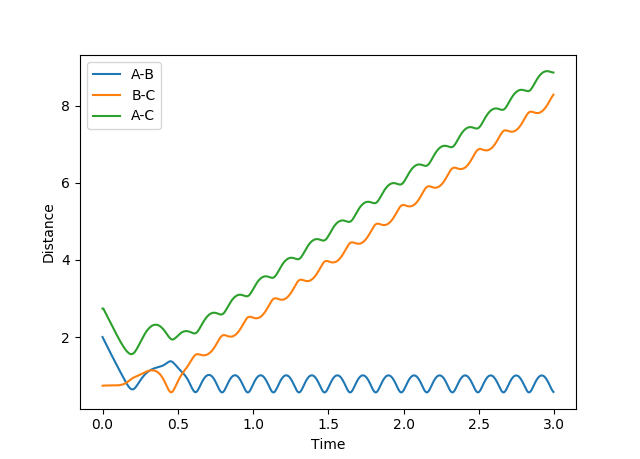
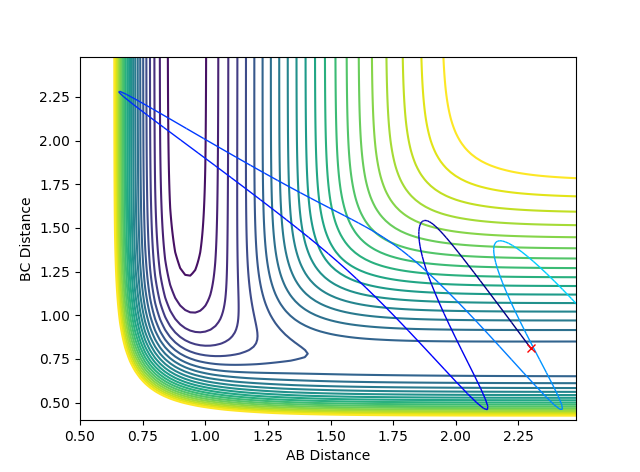
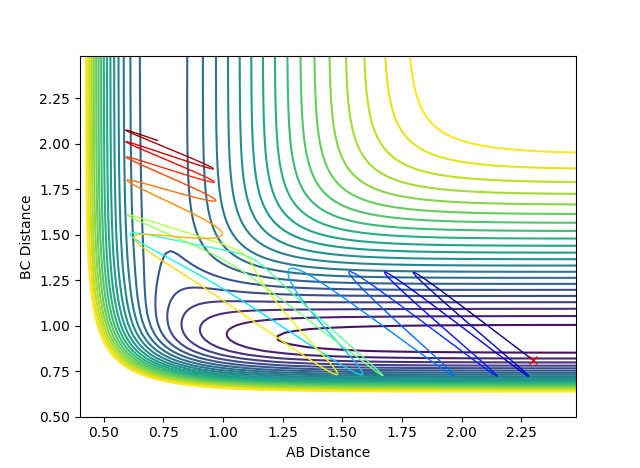
Complete the table by adding a column with the total energy, and another column reporting if the trajectory is reactive or unreactive. For each set of initial conditions, provide a plot of the trajectory and a small description for what happens along the trajectory. I think I need some more descriptive comments. What do you notice about the energy? What do you notice about the trajectories and the transition state?--Sw2711 (talk) 17:14, 17 May 2018 (BST)
For trajectories 1, 3 and 5, the AB distance decreases showing that the reaction has occurred whereas for the unreactive ones (2 and 4) the AB distance increases; showing no bonding has happened.
Question 5
State what are the main assumptions of Transition State Theory. Given the results you have obtained, how will Transition State Theory predictions for reaction rate values compare with experimental values?
Transition state theory assumes that[1];
- The motion of the electrons is separate from the motion of the nuclei (Born-Oppenheimer Approximation).
- The reactant molecules are distributed among their states in accordance with the Maxwell-Boltzmann distribution.
- Molecular systems that have crossed the transition state in the direction of products cannot turn around and reform reactants.
- In the transition state, motion along the reaction co-ordinates may be separated from the other motions and treated classically as a translation.
- Even in the absence of an equilibrium between the reactant and product molecules, the transition state that is becoming products are distributed among their states according to the Maxwell-Boltzmann distribution laws.
These assumptions do not take into account Quantum theories such as tunnelling which means that Transition State Theory will not predict rates of reaction correctly; it will overestimate them.
What you've said is fair. But what does that relate to your experiments above? I think the term ‘equilibrium’ or 'Boltzmann distribution' is not very applicable here. ‘equilibrium’ is mainly used in statistical thermodynamics. So like…thinking about a reaction A+B<=>C. Statistically speaking there is 80% molecules in this system reacts from the left to the right and 20% the other way around. (about obviously you should think about more like a Boltzmann distribution ). This reaction has reached an equilibrium. But in terms of your system, there are only 3 atoms. So, it is either one way or the other. So you need to think about what TST means to your system. You haven’t really answered how will TST predictions compare with experimental results. --Sw2711 (talk) 17:16, 17 May 2018 (BST)
F + H2 and H + HF Exercise 2
Question 6
Classify the F + H2 and H + HF reactions according to their energetics (endothermic or exothermic). How does this relate to the bond strength of the chemical species involved?
This part is good--Sw2711 (talk) 17:17, 17 May 2018 (BST)
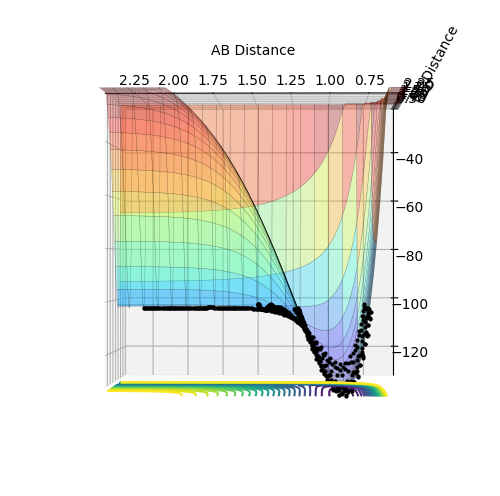
F + H2 is an exothermic reaction, as the products are lower in energy than the reactants; as shown in the graph below (Figure 10). The reaction occurs, meaning that more energy is given out as the H-F bond forms than is needed to break apart the H-H bond.
Figure 10: Surface plot showing exothermic process F + H2
H + HF is an endothermic reaction, as the products are lower in energy than the reactants. The reaction does not take place in this instance, which shows that the energy from the formation of the H-H bond isn't large enough to compensate for the breaking of the H-F bond.
Figure 11: Surface plot showing endothermic process HF + H
Thus we can conclude that the bond strength of H-F is larger than the bond strength of H-H.
Question 7
Locate the approximate position of the transition state.
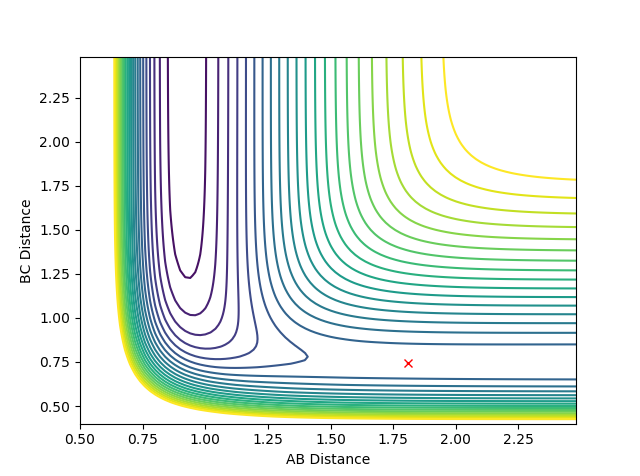
The position of the TS is at AB distance (HF) of 1.810 A and BC distance (HH) of 0.746 A.
Figure 12: Contour plot of minimum energy path (TS)
The graph above confirms that this is a transition state as no movement is seen by the trajectory.
This part is good. But I would like to see a distance vs time plot. The energy surface might not be that accurate--Sw2711 (talk) 17:19, 17 May 2018 (BST)
Question 8
Report the activation energy for both reactions.
The activation energy for the exothermic reaction of F + H2 is:
- Energy of reactants: -103.75 kcal/mol
- Energy of TS: -104.02 kcal/mol
- Activation Energy = 0.27 kcal/mol
The activation energy for the endothermic reaction of H + HF is:
- Energy of reactants: -101.78 kcal/mol
- Energy of TS: -134.03 kcal/ mol
- Activation Energy = 32.25 kcal/mol
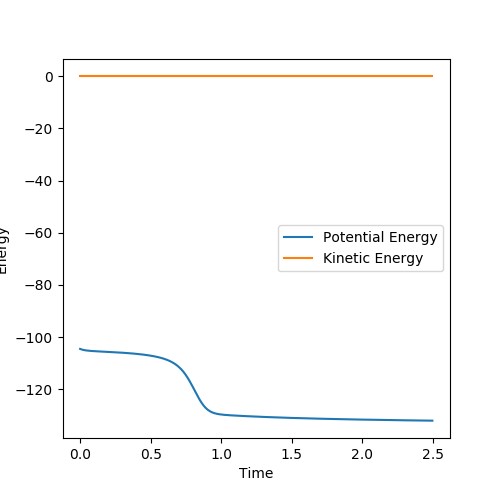
This can be shown in the graph below with the differences in potential energies being the activation energy.
This part is good, but where is your energy plot for the first part?--Sw2711 (talk) 17:20, 17 May 2018 (BST)
Figure 13: Energy vs. Time plot
Question 9
In light of the fact that energy is conserved, discuss the mechanism of release of the reaction energy. How could this be confirmed experimentally?
Seeing as F + H2 is and exothermic reaction, this means that excess energy is expected to be released. Considering the principle of the conservation of energy (i.e. energy cannot be created nor destroyed) then this means that the excess energy must be converted from potential energy stored within bonds of the molecules, into kinetic energy in the system. In the momentum graph, the product being formed is represented by the AB (blue) line and the reactant hydrogen molecule by the BC (orange line). If the line is at a plateau, this indicates that there is only potential energy present whereas the oscillation shows the kinetic energy in the system. The blue line is originally at a plateau and then begins to oscillate; showing us the gain of kinetic energy by the product molecule, HF. The orange line is steadily oscillating in the beginning before reaching a plateau suggesting a loss of kinetic energy in the reactant molecule of H2 to just potential. It can also be noted that the oscillation of HF (blue line) has a much larger amplitude, which confirms the excess energy is released as kinetic.
Figure 13: Graph of internuclear momenta vs. time
Experimentally, calorimetry allows this to be seems as the release of energy through heat is measured to determine how exothermic a reaction is.
This part is good--Sw2711 (talk) 17:21, 17 May 2018 (BST)
Question 10
Discuss how the distribution of energy between different modes (translation and vibration) affect the efficiency of the reaction, and how this is influenced by the position of the transition state.
Polanyi's rules[2] state that vibrational energy is better at promoting a reaction with a late-TS (i.e. F + H2) than translational energy, whereas the reverse is true for an early-TS reaction (i.e. H + HF).
For the exothermic reaction F + H2, it would be expected that, according to Hammond's postulate[3]; the transition state resembles the reactants closer than the products (early-TS). By applying Polanyi's rules, this means that we would thus expect that a system with a high translational energy in comparison to the vibrational energy; would result in a reactive trajectory.
Up to here is good--Sw2711 (talk) 17:26, 17 May 2018 (BST)
In the program, AB corresponds to the translational energy of the system and BC to the vibrational. Really? I am not so sure. If you think one momentum is equivalent to vibrational energy and the other momentum is equivalent to translational energy, this is not true. When you add the momentum into the system, you are just adding the kinetic energy. But whether this kinetic energy goes to translational or vibrational energy, you have some control, but not all of them. The best way to read the vibrational energy is to see how many contour lines the trajectory has passed (i.e. how far away it is from the minimum energy path). Therefore, changing the momentum of the molecule is not the only way to change the vibrational energy, you can also change your starting point (i.e. the molecule bond length). --Sw2711 (talk) 17:26, 17 May 2018 (BST)
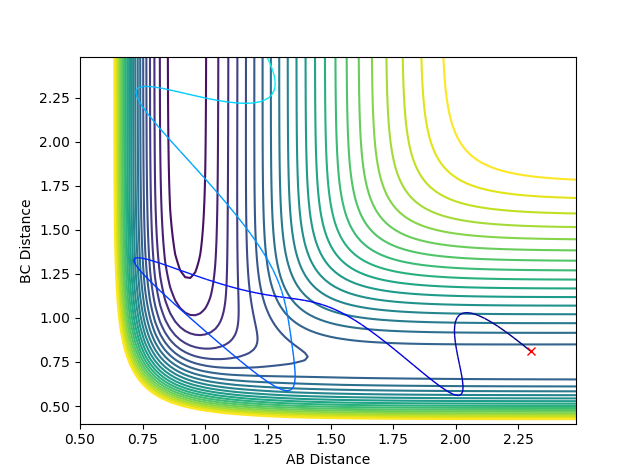
Below shows the trajectory of two situations; the first with a high translational and low vibrational and the second with the reverse.
So here, I need to see your initial conditions--Sw2711 (talk) 17:26, 17 May 2018 (BST)
Figure 14: Reactive trajectory & Figure 15: Unreactive trajectory
As confirmed in the graphs above, for this reaction (F + H2), the high translational and low vibrational situation results in a reactive trajectory whereas the low translational and high vibrational is unreactive.
In the case of the endothermic reaction H + HF, the transition state is now late; it resembles the products more than the reactants. Again, according to Polanyi's rules, this means that a high vibrational and low translational energy will now be more efficient at promoting reaction. Two situations below were again shown; the first with a high translational and low vibrational and the second with the reverse.
Figure 16: Unreactive trajectory & Figure 17: Reactive trajectory This time around, the high translational and low vibrational situation results in a unreactive trajectory whereas the low translational and high vibrational results in a reaction. This shows that the systems obey Polanyi's rules. This part is good--Sw2711 (talk) 17:51, 17 May 2018 (BST)
Reference
- ↑ J. I. Steinfeld, J. S. Francisco, W. L. Hase Chemical Kinetic and Dynamics
- ↑ Zhang, Z; Zhou, Y; Zhang, D.H; Czako, G; Bowman, J.M. Theoretical Study of the Validity of the Polanyi Rules for the Late-Barrier Cl + CHD3 Reaction. (2012) J. Phys. Chem. Lett.
- ↑ Sola, M; Torro-Labbe, A. The Hammond Postulate and the Principle of Maximum Hardness in Some Intramolecular Rearrangement Reactions. (1999) J. Phys. Chem.

