MRD:DPC18
Molecular and Reaction Dynamics Lab - David Coogan CID: 01507872
In this report we probe two different reactions and investigate their minimum energy pathways, from the reactants, through the transition site, to the products. Factors affecting whether a reaction produces the expected products such as the vibrational and translational energy were also investigated.
Exercise 1: H + H2 System
Question 1.1 and 1.2 - The Transition State
The transition state is defined as the energy maximum of the surface plot. It occurs at a stationary point where the derivative of the potential energy with respect to bond distance = 0 i.e. . This occurs at an energy minima in the surface profile diagram.
The derivative of the potential energy gives force and so the transition state can be found at the bond distance which gives a force of 0. Hammond's postulate states that "the transition state of a reaction resembles either the reactants or the products, to whichever it is closer in energy". Because H2 is a symmetrical molecule and the incoming atom is the same as outgoing atom the transition state is of equal energy from the reactants as it is to the products and is thus not exothermic or endothermic. This also means that at the transition state the bond distance between all three H atoms will be equal i.e. rAB = rBC. For the H2 + H system this bond distance at which the force is closest to 0 is found to be at 90.8 pm corresponding to a force of -0.004 kJ mol-1 pm-1 in both the AB and BC directions. This was determined by looking at the Internuclear Distances vs Time plot (shown in Figure 3a) and estimating that the transition state, where the AB and BC distances cross, occurs at around 95 pm. Trial and error was then used to determine the exact value, which is confirmed by the plots below.
However, as Figure 1a shows, there is more than one point that gives a local minimum in the plot; there is a minimum well, and so to validate that bond distance corresponds to the transition state eigenvectors are plotted. The two eigenvectors have opposite signs i.e. one eigenvector has a positive value for ω2 Define what omega is please. Pu12 (talk) 01:33, 27 June 2020 (BST) and the other has a negative value for ω2, indicating that this saddle point corresponds to the transition state.
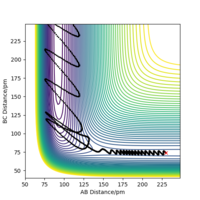
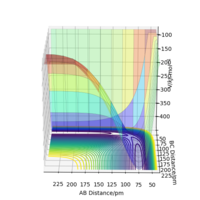
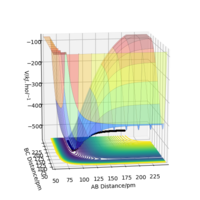
Different plots can confirm we are at the transition state. Some examples are shown here. Figures 1a and 1b show two orientations of the Surface Plot along with Figure 2 showing the Contour Plot for the H2 + H transition state. Figure 3b shows no change in the AB or BC bond distance at this distance, confirming that this is a transition state and that 90.8 pm is the transition state bond length.




Question 1.3 - MEP vs Trajectory and Displacement from the Transition State
If we displace the bond distance between two atoms by a small amount, e.g. in this example we decrease the AB bond distance by 0.8 pm, and increase the steps in the calculation to 3000, the contour plot (shown in figure 4a) shows a trajectory, in this case along the BC axis indicating that as the BC distance increases the AB bond distance remains constant (allowing for vibrations in the molecule).
When the calculation type is changed from Dynamics to MEP the same trajectory can be seen, however the trajectory does not show any vibration (shown in figure 4b). It is effectively the mean energy of the dynamics trajectory and is useful for identifying what happens in the reaction but not the motion of atoms.
Reverting to the dynamic calculation method and using 1000 steps, the Internuclear Distances vs Time as well as Momenta vs Time were plotted for the small displacement in the AB bond length as well as a displacement in the BC bond length and the results compared.
Figures 5a and 5b show the internuclear distance vs time for a displacement of 0.8 pm in either AB or BC respectively. The composition of the graphs are identical, with the only difference being which line follows which trajectory. When AB is displaced from the transition state bond length, the change in energy is no longer 0 and the energy effectively 'rolls' to a new energy minimum, found at the equilibrium bond length for the products. When AB is displaced we observe a small decrease in the AB bond distance followed by a consistent (allowing for vibrational motion) equilibrium bond length at approximately 73 nm. The BC bond length, as well as the AC bond length, increases, after which 20 seconds the increase is linear, as atom C moves away from the new H2 molecule. Because the AB bond length is slightly smaller than the BC bond length to begin with it is the AB atoms that make the H2 molecule. When the converse is explored, with the BC bond length being set slightly smaller than AB, we see the same trend, only for the BC atoms being the new H2 molecule and reaching an equilibrium bond length.
Figures 6a and 6b show the momenta vs time plots for the same conditions. Again, both graphs have the same structure, only differing by which bonds follow which lines trajectory. For AB being displaced from the transition state bond length we observe oscillation of AB momentum after 30 seconds indicating bond vibration with the BC momentum rising sharply (corresponding to translational movement) and then plateauing with no oscillation, suggesting it is not bonded to another atom. When the conditions are reversed we see the same pattern but for the opposite atoms.


The values of rAB, rBC, pAB and pBC were at t = 60 fs were extracted for AB displacement, although BC values could also be used since all atoms are identical. At this time the AB bond distance has reached is equilibrium length and is oscillating in both graphs, with the BC bond length increases linearly and not having reached a plateau in the momenta plot. The values were found to be as follows: rAB = 75.20 pm, rBC = 421.4 pm, pAB = 2.315 g mol-1 pm fs-1, pBC = 5.092 g mol-1 pm fs-1. These values were then used as the initial values for another calculation. When this calculation was run the Internuclear Distance vs Time and Momenta vs Time plots (shown in Figures 7a and 7b) were analysed and found to give the same result as the previous plots, only this time without the optimisation seen in the first few femtoseconds; the graphs are consistent across the whole time range and there is no interaction between molecule AB and atom C. This confirms AB is the product of the reaction and that the reaction has finished.

Question 1.4 - Reactive and Unreactive Trajectories
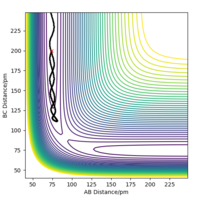
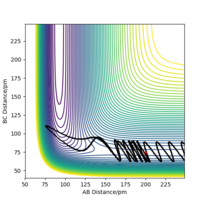
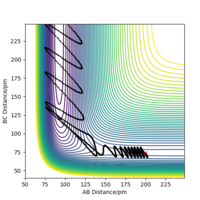
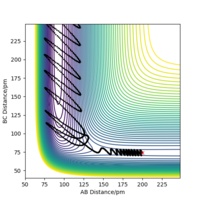
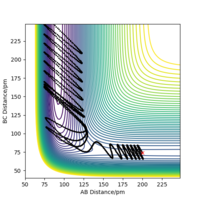
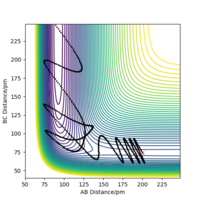
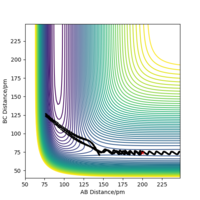
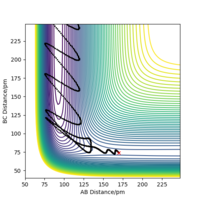
Here we explore the trajectories taken by the reactants under different momentum conditions but with set bond lengths of rAB = 74 pm and rBC = 200 pm.
Throughout each of the different conditions the potential energy remained constant, showing that the trajectory flows through the potential energy 'well' of lowest potential energy. The results also suggest that the kinetic activation energy for this reaction is in the range of +13.710 kJ mol-1 < Ea < +19.508 kJ mol-1. The BC momentum required for a reaction to happen and to give the activation energy lies between -5.1 g mol-1 pm fs-1 < p < -4.1 g mol-1 pm fs-1.
Question 1.5 - Transition State Theory
Transition state theory makes a number of assumptions in a bid to link the reactants and products via a transition state of maximum energy.[1][2]
- Assumption 1 - Nuclear motion is separate and constant compared to electronic motion aka the Born-Oppenheimer approximation.
- Assumption 2 - Reactant molecules are distributed according to the Maxwell-Boltzmann distribution.
- Assumption 3 - Once the transition state has been crossed molecules cannot return to reactants.
- Assumption 4 - Motion along the reaction coordinate in the transition state treated classically, as translational motion only i.e. we ignore any quantum tunnelling effect.
- Assumption 5 - Even if the reaction is not in equilibrium, the concentration of activated products in the transition state is in a quasi-equilibrium with the reactants. This means that not all reactants become transition states in one go; this processes is determined by a rate constant and an equilibrium. The more reactant we have the faster the transition state will form, and thus the faster the rate of reaction.
The effectiveness of these assumptions i.e. how closely the theory links to the calculated classical values, and thus how relevant TST is to these calculations, can be determined by seeing how the assumptions compare to the results in the table above.
- Assumption 3 is shown not to be completely true in reality. It stands true for reactions 1, 3, and 5 where the reactants travel through the transition state to the products however, in reaction 4, the transition state energy is reached, yet the products do not form and so the assumption that once the molecule is activated in the transition state it forms products does not hold true. Assumption 3 thus presents an overestimation of the reaction rate's true value.
- Assumption 4 would underestimate the true rate of reaction. This is because if quantum tunnelling occurs, reactants become products faster because they do not have to reach the transition state. The assumption says that quantum tunnelling does not occur and so the rate would be larger than in reality. Tunnelling only appears to be important in reactions with very light atoms i.e. H and D. However, there appears to be no evidence in the 5 reactions with specified conditions that tunnelling occurs.[2]
The results show that transition state theory does not easily apply to all conditions for a molecule.
Exercise 2: F + H2 System

Question 2.1 - PES Inspection
The PES for this system (shown in figure 9) shows the potential energy across a range of bond distances. AB represents the HF bond distance and BC represents the HH bond distance. The minimum energy 'well', shown in blue, has a higher minimum energy for a constant BC distance i.e. a H2 molecule than for a constant AB distance i.e. a HF molecule. In other words the HF molecule has a lower energy and is more stable, thus the reaction of H2 + F --> HF + H is exothermic as it results in a lower energy molecule. The reverse reaction is thus endothermic.Comment on bond strength? Pu12 (talk) 01:33, 27 June 2020 (BST)
Question 2.2 - F + H2 and H + HF Transition States
Once again trial and error was used to find where the transition state bond distances. This occurs at the point where there is no trajectory in the PES, at which the forces on the bonds are close enough to 0, and where the two values for ω2 were of opposite signs.

For the F + H2 system we know, from question 2.1, that the reaction is exothermic, and thus using Hammonds postulate it can be inferred that the transition state is early and resembles the reactants. This means that the H2 bond distance will be smaller than the HF bond distance. After trialling different combinations the closest values to the transition state were found to be rHH = 74.5 pm and rHF = 180.9 pm. These values gave forces along the AB bond = -0.000 kJ mol-1 and along the BC bond = -0.003 kJ mol-1 as well ω2 values of -0.002 and +0.332 kJ mol-1 pm-2. These values gave a singular point on the PES and 2D Contour Diagram (shown in figures 9 and 10 respectively), as well as linear lines on the Internuclear Distances vs Time plot (figure 11) confirming that this is a) a stationary point and b) the transition state.
The HF + H reaction is the same reaction but in the opposite direction. This means it is endothermic and the transition state 'late' and so will resemble the products more than the reactants. This means it occurs at the bond distances as stated for the previous reaction i.e. rHH = 74.5 pm and rHF = 180.9 pm. The only difference is that this transition state occurs later in the reaction coordinate.Good. Pu12 (talk) 01:33, 27 June 2020 (BST)

Question 2.3 - Activation Energies
The activation energy is calculated as the difference between the potential energy of the reactants and the potential energy of the transition state. To calculate the potential energy of both the reactants and products the HF bond distance was set to 400 pm and the molecule bond distance was found in literature[3] and used in the software. This means that the atom and molecule are not interacting and so the potential energy is solely that of the molecule. I.e.:
- To calculate the H2 potential energy rHF was set to 400 pm and rHH was found and set to be 74 pm, giving a potential energy of-435.044 kJ mol-1.
- To calculate the HF potential energy the rHF bond distance for the H that is not part of the molecule was set to 400 pm and the rHF bond distance for the hydrogen in the molecule was found and set to be 92 pm, giving a potential energy of -560.685 kJ mol-1.
These values were compared to those reported in literature and were found to be very similar.[3]

The energy of the transition state at the bond distances stated in question 2.2 was found to be -433.981 kJ mol-1.
- Thus for the H2 + F exothermic reaction the activation energy is -433.981 - -435.044 = 1.063 kJ mol-1.
- For the HF + H endothermic reaction the activation energy is -433.981 - -560.685 = 126.704 kJ mol-1.
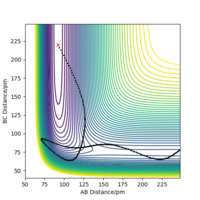
This value was also confirmed by carrying out a MEP calculation with a bond distance slightly displaced from the transition state with rFH being 179 pm and rHH remaining at 75.5 pm. This was carried out at 3000 steps and both the PES (showing the trajectory in figure 12a) and the Energy vs Time plot (shown in figure 12b) were examined for the H2 + F reaction. At approx. 2400 steps there is a sharp decrease in energy, representing the difference between in energy between the transition state and the products aka the activation energy of the reverse, endothermic reaction, going from HF + F → F + H2. This difference is approximately -126.176 kJ mol-1, which closely matches the value above. The same method can be applied to the endothermic reaction (in order to calculate the exothermic activation energy) but this activation energy is much smaller and so it is incredibly difficult to calculate the value from the plots. This does suggest however that the small value calculated above is in the correct region.
Questions 2.4 & 2.5 - Reaction Dynamics & Polanyi's Empirical Rules
Different initial conditions were trialled in order to obtain a set that gave a reactive trajectory from F + H2 → HF + F. It was found that the time period of the reaction is very important. On a smaller time scale a large momentum is required between F and H in order to break the HH bond and form a new HF bond. One set of conditions that were found to work at 3000 steps were bond distances of rHH = 74 pm and rHF = 175 pm with momenta of pHH = 0.2 g mol-1 pm fs-1 and pHF = -1.6 g mol-1 pm fs-1. The Momenta vs Time graph was plotted and is shown in figure 13. This plot shows after 90 seconds there is no longer any interaction between the H and HF molecule, with pBC plateauing at about 2.6 g mol-1 pm fs-1 and pBC oscillating at a constant rate. The excess energy is used as vibrational motion in the HF molecule, shown as the considerably large oscillation in momenta, and as translational motion as the H atom moves away from the molecule[4]. This could be confirmed experimentally by using spectroscopic techniques such as IR absorption spectroscopyGood. Pu12 (talk) 01:33, 27 June 2020 (BST) . For a molecule in its relaxed state we would expect one IR absorption corresponding to the fundamental vibration of the 0 → 1 transition, because most molecules would be in the ground vibrational state. When the molecule is excited we would see a smaller, overtone peak to the left of the fundamental peak corresponding to transitions between higher vibrational states. It is to the left of the fundamental because the energy gap between the 1st and 2nd excited state is smaller than the gap between the ground and 1st excited states, owing to the anharmonicity of the molecule. Thus, IR can be used to see if we have an excited molecule. On the contrary, emission spectroscopy, specifically fluorimetry can be used to investigate the relaxation of the excited states to the ground state as the molecule moves away and vibrational energy is lost as heat. As molecules in the excited state decay back to the ground state they release a photon of lightNot necessarily light. Pu12 (talk) 01:33, 27 June 2020 (BST)
corresponding to a specific energy, which can be probed using fluorimetry. Molecules in the ground state will not emit any photons. Therefore fluorimetry can also be used to measure the progress of the reaction. The other point to make is the difference in the amplitude of the oscillations between the reactants in the first 20 fs and the products after 90 fs. There is much more vibrational energy in the products than the reactants owing to the fact that this is an exothermic reaction and the potential energy decreases by being converted into excess vibrational energy.

A calculation was set up at 2000 steps to explore the effect of different momenta of HH on the reaction trajectory. In these calculations rHH was kept constant at 74 pm, rHF was kept constant at 200 pm, and, for reactions 1-5, pHF was kept constant at -1.0 g mol-1 pm fs-1, with this value changing to -1.6 g mol-1 pm fs-1 in reaction 6.
The above results can be understood when looking at and applying Polanyi's Empirical Rules. These rules state that translational energy is more effective for an early transition state which, using Hammonds postulate, corresponds to an exothermic reaction, whilst vibrational energy in the reactants is better for a late transition state i.e. an endothermic reaction.[5] In the above reactions we are looking at the exothermic reaction of H2 + F → HF + F. Thus, more translational energy favours the reaction and is more likely to lead to products. Conversely more vibrational energy in the reactants will disfavour the reaction, explaining why reactions 2 occurs but not reaction 1.
If we were to examine the reverse reaction of HF + H → H2 + F a larger translational energy is preferred over vibrational energy. Therefore a large momentum for the incoming H atom and a small momentum for the HF molecule is optimal. One example of conditions that work is a molecular bond distance of 92 pm (the HF molecule bond distance) and a large distance between the molecular F and incoming H atom of 220 pm, with momenta of 0.2 g mol-1 pm fs-1 for the molecule (corresponding to low vibrational energy) and -18 g mol-1 pm fs-1 for the atom (corresponding to a very large amount of translational energy). The Contour Plot for this reaction is shown in Figure 15. As the vibrational energy of the molecule is increased it becomes increasingly difficult to find a reactive trajectory owing to Polanyi's Empirical Rules. Good reference to plots. Pu12 (talk) 01:33, 27 June 2020 (BST)
References
- ↑ K. J. Laidler, in Chemical kinetics, Harper & Row, London, 3rd edn., 1987, pp. 115–123.
- ↑ 2.0 2.1 J. I. Steinfield, J. S. Francisco and W. L. Hase, in Chemical kinetics and dynamics, Prentice-Hall, Upper Saddle River, 2nd edn., 1989, pp. 289–318.
- ↑ 3.0 3.1 C. Chieh, Chemistry LibreTexts, Bond Lengths and Bond Energies, https://chem.libretexts.org/Bookshelves/Physical_and_Theoretical_Chemistry_Textbook_Maps/Supplemental_Modules_(Physical_and_Theoretical_Chemistry)/Chemical_Bonding/Fundamentals_of_Chemical_Bonding/Chemical_Bonds/Bond_Lengths_and_Energies, (accessed 21 May 2020).
- ↑ K. J. Laidler, in Chemical kinetics, Harper & Row, London, 3rd edn., 1987, pp. 460–471.
- ↑ J. I. Steinfield, in Chemical kinetics and dynamics, Prentice-Hall, Upper Saddle River, 2nd edn., 1989, pp. 272–274.


