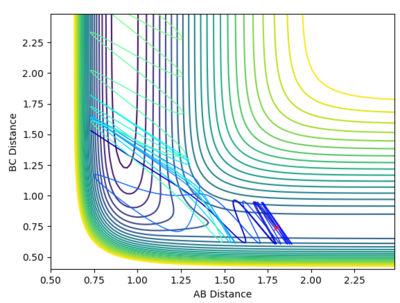
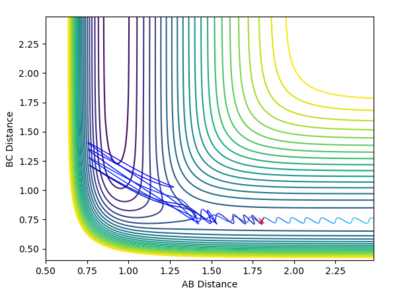
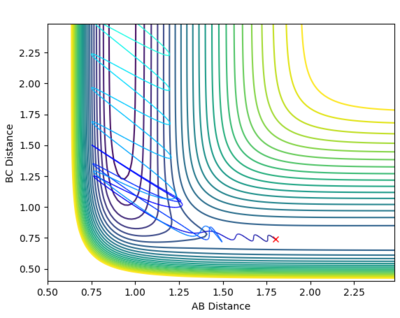
MRD:DJN160518
H + H2 system
Q1
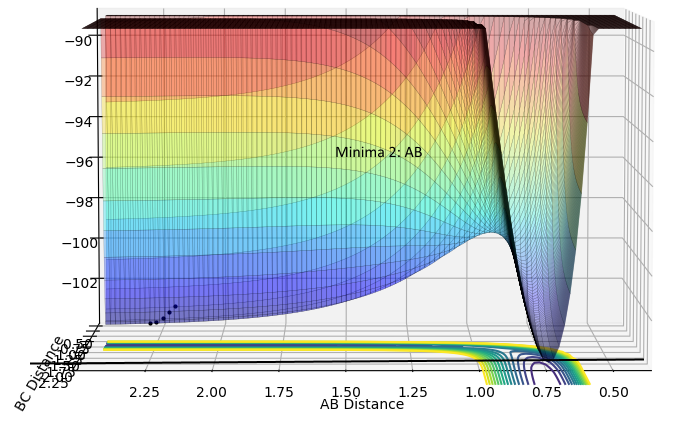
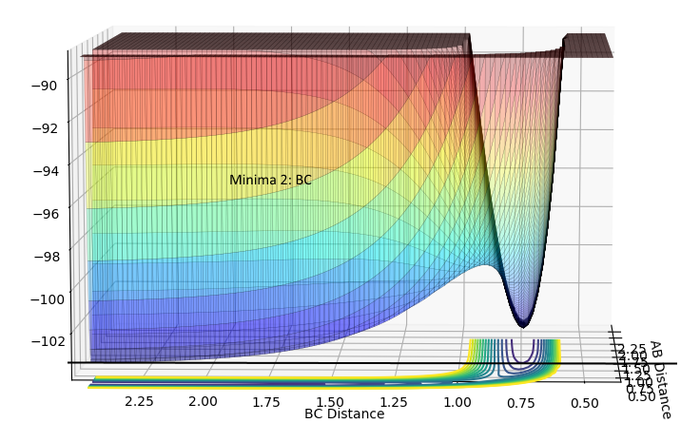
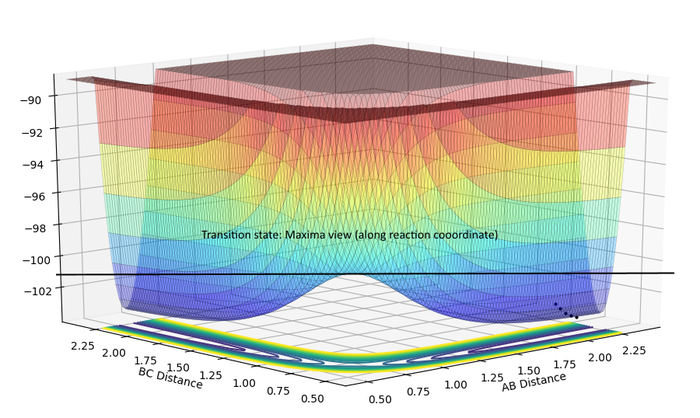
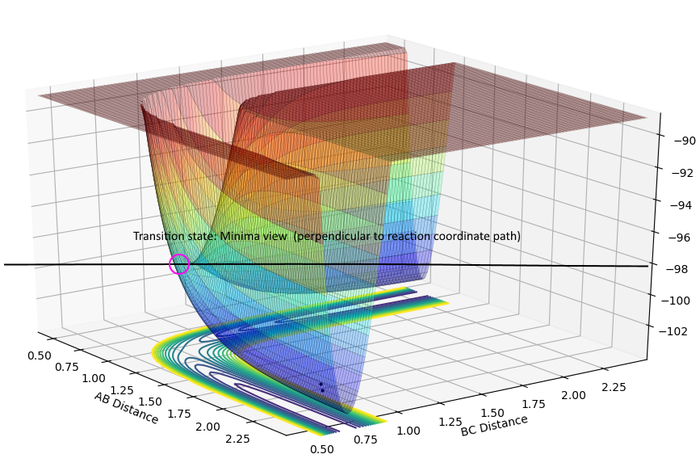
What value do the different components of the gradient of the potential energy surface have at a minimum and at a transition structure?
Briefly explain how minima and transition structures can be distinguished using the curvature of the potential energy surface.
| ∂V(ri)/∂ri | ∂2V(ri)/∂ri2 | |
|---|---|---|
| Minima | 0 | >0 |
| Maxima | 0 | <0 |
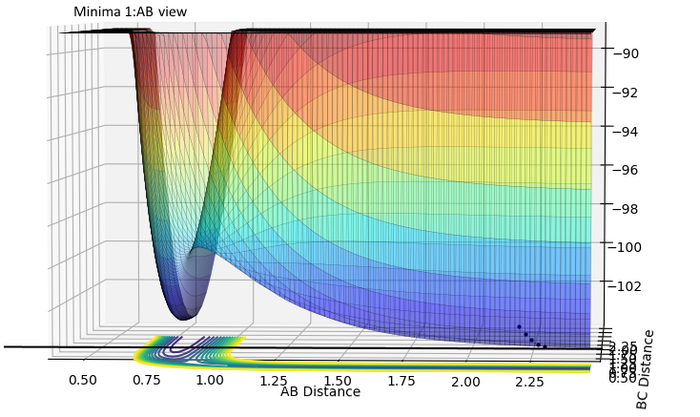
For both the transition state and the minima ∂V(ri)/∂ri=0 in the directions shown in the diagrams above.
To distinguish between the Minima and the Transition state we must take the second derivatives, ∂2V(ri)/∂ri2, in the directions to investigate the curvature.
For the Minima we can see that the curvature (2nd derivative) will always be positive.
The Transition State contains a maxima along the reaction coordinate, and a minimum perpendicular to this direction.
For the Transition State we can see the Maxima along the reaction coordinate direction therefore here ∂2V(ri)/∂ri2>0 Everything is nice and clear up to here. Double check your little table--Sw2711 (talk) 16:39, 31 May 2018 (BST)and a Minima along the direction perpendicular to the reaction coordinate. This means our transition state is a saddle point[1].
Potential energy surfaces: evaluating ∂V(ri)/∂ri at minimum and at a transition structure:
| Minima 1:AB | Minima 1:BC | |
|---|---|---|
 |
 |
| Minima 2:AB | Minima 2:BC |
|---|---|
 |
|
| TS Maxima | TS Minima |
|---|---|
 |
|
Q2
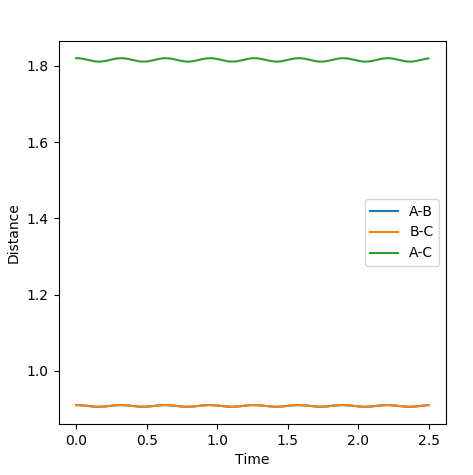
Report your best estimate of the transition state position (rts) and explain your reasoning illustrating it with a “Internuclear Distances vs Time” plot for a relevant trajectory.
At the transition state r1 = r2 (because this molecule is linear and symmetric) and from the surface plot we can see that this happens when rts≈0.85-0.95 Å. We also know that at the transition state the p1 = p2 = 0.0. Be careful about what you are saying here. We don't know p1=p2=0 at TS. In fact, most system passes TS with a speed. But we know TS is a saddle point, which means if we place our system with no momentum at TS, it should not move at all. Can you see the differences in the description here?--Sw2711 (talk) 16:43, 31 May 2018 (BST) Inputting this data into "LEPS GUI" and updating the "Internuclear Distances vs Time" graph with steps of rts +0.01 Å up from 0.85-0.95 Å allowed us to see how the graph below changed. The oscillations decreased up until rts = 0.91 Å indicating this is the internuclear distance r1 = r2 between HA, HB, HC. I think you can do a little better to get a straight line here.--Sw2711 (talk) 16:43, 31 May 2018 (BST)
Finding ri for the transition state
Internuclear Distances vs Time: ri = 0.91
Q3
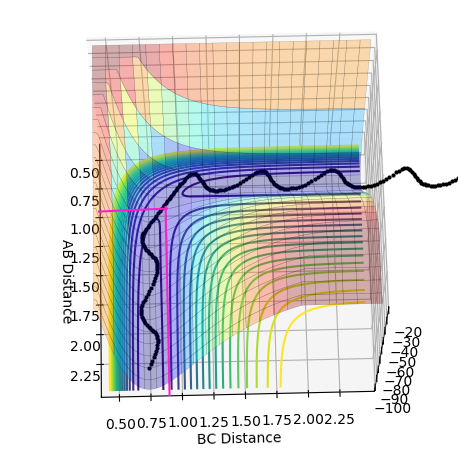
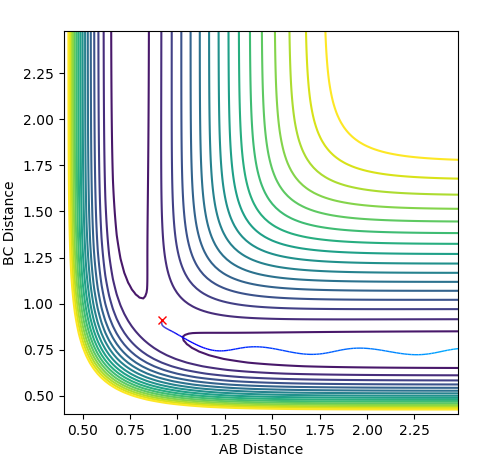
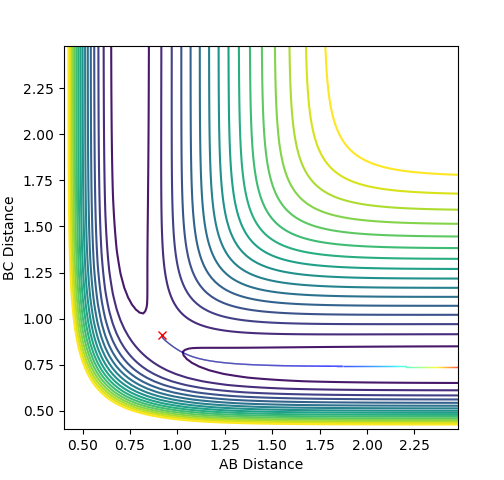
Comment on how the mep and the trajectory you just calculated differ.
Good--Sw2711 (talk) 16:44, 31 May 2018 (BST)
The MEP (minimum energy path) indicates the path of lowest energy for H2 + H, thus the most favorable energy path for the system to take, however in taking an MEP we lose information about the vibrational energy of the system and we see a smooth curve that just traces the minima of the surface. In contrast, The dynamic view however displays the oscillatory behavior (due to the HB-HC vibrations) along the energy path, thus presenting a more realistic description of the energy path taken. The MEP resets velocity to zero at every infinitesimal increase in time along the minima of the surface. The dynamic surface presents us with the sum of the momenta at each infinitesimal increase in time along the surface thus we see oscillatory behavior.
| Dynamics | MEP |
|---|---|
 |
|
Q4
Complete the table by adding a column with the total energy, and another column reporting if the trajectory is reactive or unreactive. For each set of initial conditions, provide a plot of the trajectory and a small description for what happens along the trajectory.
| Trajectory | p1 | p2 | Total Energy/Kcalmol-1 | Reactive or Unreactive? | Trajectory Plot | Trajectory Discussion |
|---|---|---|---|---|---|---|
| 1 | -1.25 | -2.5 | -99.018 | Reactive | 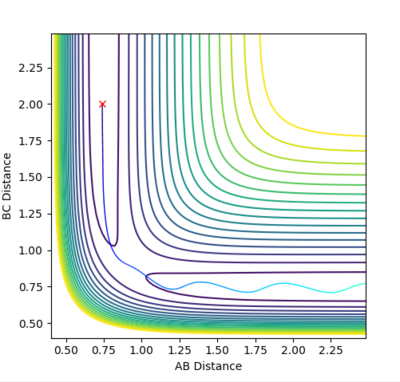 |
We can see from the trajectory that the BC bond is formed. C approaches with enough momenta (overcoming the activation energy), collides with AB and produces A + BC forming the products. We can see in the line AB= 0.75 that there is no oscillation in the curve meaing that there is no vibration between A and B after the collision takes place. |
| 2 | -1.5 | -2.0 | -100.455 | Unreactive | 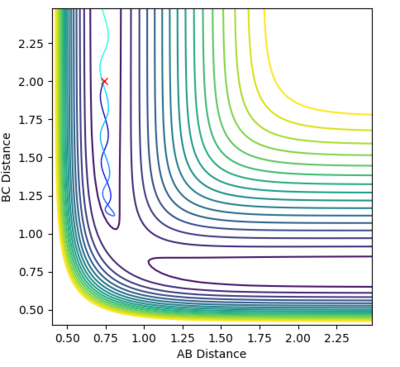 |
No reaction occurs here (as seen in the animation) and the transition state is not overcome. Here the Vibrational energy of the AB bond is greater than in trajectory 1, and is high enough such that C (whose momentum is less than in stage 1), cannot distort the AB bond enough to form the BC bond. |
| 3 | -1.5 | -2.5 | -98.955 | Reactive |  |
BC bond is formed. This trajectory is very similar to trajectory 1 but we can see some vibration of AB at the line AB = 0.75 Å, meaning it must be vibrating whilst C approaches it. |
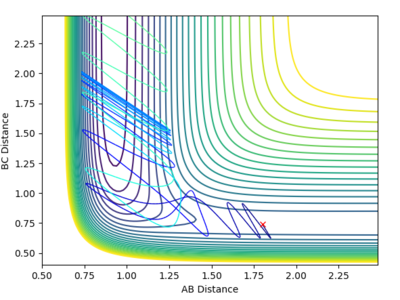
| 4 | -2.5 | -5.0 | -84.954 | Unreactive |  |
The contour plot here describes more complicated behavior than what was seen previously. From the animation we see that A-B + C --> A +BC. Immediately after this we see A + BC --> AB + C and the two species move away from each other in opposite directions. (AB to the right and C to the left. This phenomena is called 'recrossing' in which the system crosses the transition state twice and we can see the odd behavior of B crossing to C then back to A again. REFERENCE:https://pubs.acs.org/doi/abs/10.1021/cr050308e. We can see from the plot of inter-nuclear distances vs time plots two points of intersection between the blue 'A-B' distance and the orange 'B-C' distance which correspond to crossing the transition state twice. |
| 5 | -2.5 | -5.2 | -83.416 | Reactive | 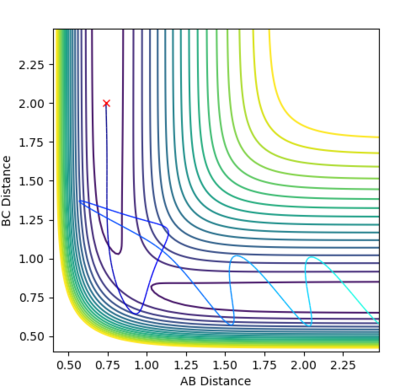 |
The contour plot describes another recrossing process. C approaches AB with a high velocity. B then bounces to C, then back to A and then finally back to C and a BC bond is formed. This means that the transition state has been crossed three times as shown by the three points of intersection in the diagram of "internuclear distance vs time" below |
Q5
State what are the main assumptions of Transition State Theory. Given the results you have obtained, how will Transition State Theory predictions for reaction rate values compare with experimental values?
Transition State theory
Transition State theory is used to predict ideas about the rate of reaction of a system.[2]
Assumptions
1. Molecular systems which cross the transition state to form products can never return to reactants.[2]
2. The lowest energy path is taken[2]
3. Classical mechanics at the transition state[2]
We can see from trajectory 4 that the first rule has been broken, as the transition state is crossed twice and the initial reactants are reformed. Trajectory 5 also breaks this rule as the transition state is crossed three times.
This indicates that transition state theory, whilst applicable to high energy barriers, is not as strict a theory for reactions with small energy barriers.
Both Q4 and Q5 are Good--Sw2711 (talk) 16:45, 31 May 2018 (BST)
H-F-H Section
Q1
Classify the F + H2 and H + HF reactions according to their energetics (endothermic or exothermic). How does this relate to the bond strength of the chemical species involved?
H + HF → H2 + F
The formation of H2 is endothermic (BC = HF). The formation of HF is therefore exothermic (BC = H2). H2 bond enthalpy = 435kJmol-1[3]. HF bond enthalpy = 569 kJmol-1[3].
Good, can you work out which bond is stronger by looking at the PES?--Sw2711 (talk) 16:48, 31 May 2018 (BST)
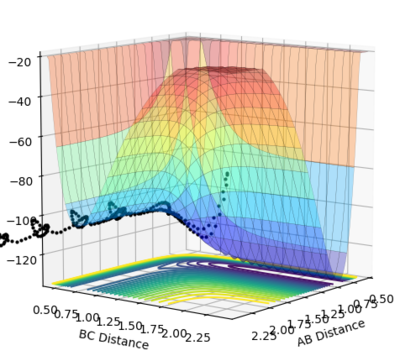
In the graph of H2 + H --> HF + H, the products are lower than reactants, exothermic, if we go in the opposite direction, we would form H2 and the reaction is endothermic. Thus HF has a higher bond enthalpy than H2.
This part is good.--Sw2711 (talk) 16:48, 31 May 2018 (BST)
| Formation of H2 | Formation of HF |
|---|---|
| endothermic | exothermic |
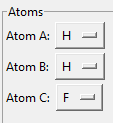 |
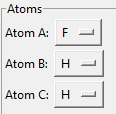
|
 |
|
Locate the approximate position of the transition state.
| Data | Contour plot |
|---|---|
 |
|
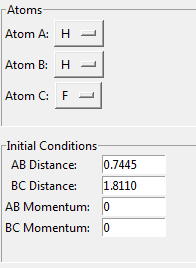
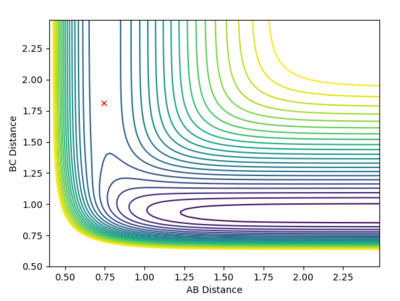
| This is the data for the transition state given to 4 d.p. | Hammonds postulate:"If two states, as, for example, a transition state and an unstable intermediate, occur consecutively during a reaction process and have nearly the same energy content, their interconversion will involve only a small reorganization of the molecular structures." [4]
From Hammond's postulate[4] and by looking at the surface plot for the formation of H2 we can see that for this exothermic reaction our transition state lies close in energy to the products, so plotting distances close to the products starting from AB = 0.75 Å and BC = 1.8 Å, we found our (approximate) transition state transition by finding the smallest "energy trail" from our starting point (marked X)in the direction of formation of H2. At the perfect transition state coordinates there would be an infinitesimally small starting point X and no reaction path as the system remains at rest at the transition state coordinates. For this formation of H2 we make the AB bond distance relatively short, and the BC distance relatively large as this corresponds the the H-F bond which will be broken if we move in the direction of the products on the contour plot. |
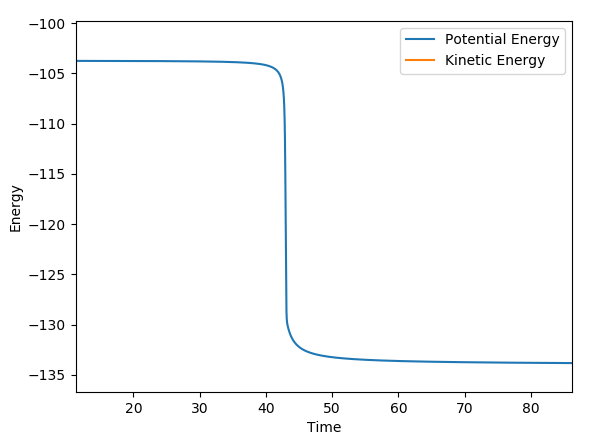
We can see from the plot of internuclear distances with time graph that after approximately 6-8s some small change in energy causes the H2 to be formed and the HF to dissociate
This part is good--Sw2711 (talk) 16:48, 31 May 2018 (BST)
Q2
Report the activation energy for both reactions.
Ea = ETS - Ereactant
1)Formation of H2
-103.76 - (-133.77) = 30.1 kcalmol-1
1)Formation of HF
-103.76 - (-103.91) = 0.15 kcalmol-1 You showed me how to get one sets of numbers. How about the other sets? --Sw2711 (talk) 16:49, 31 May 2018 (BST)
Reaction dynamics
Q3
i
In light of the fact that energy is conserved, discuss the mechanism of release of the reaction energy. How could this be confirmed experimentally?
rFH = 1.8
rH2 = 0.74
Steps = 5000
So overall, what kind of experiments can you do to test your hypothesis?--Sw2711 (talk) 16:53, 31 May 2018 (BST)
ii
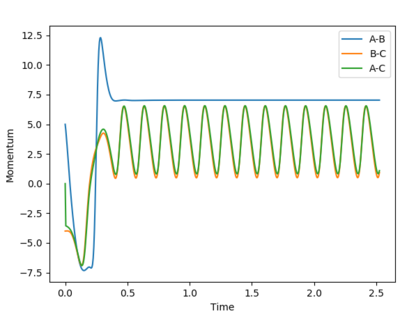
Trajectories to investigate momenta conditions for the formation of H2
rHF = 1.0 Å
rH2 = 1.8 Å
| AB momentum | BC momentum | Contour plot | Internuclear distances vs time | Reactive or Unreactive |
|---|---|---|---|---|
| 5.0 | -4.0 | 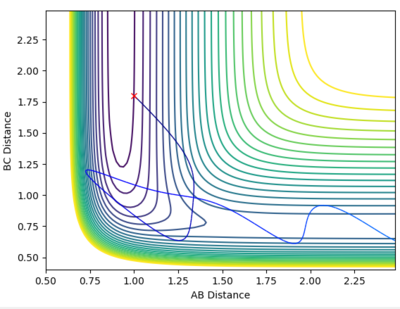 |
 |
Reactive |
| 5.0 | -3.0 |  |
 |
Unreactive |
| 3.0 | -6.0 |  |
 |
Reactive |
| 3 | -7 | 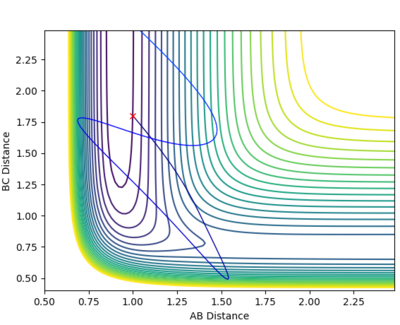 |
 |
Unreactive |
From this we can see that this reaction is very sensitive to changes in the translation momentum of the reacting species.
Q4
Discuss how the distribution of energy between different modes (translation and vibration) affect the efficiency of the reaction, and how this is influenced by the position of the transition state.
Polanyi's rules state that[5]:
1)For an endothermic process, the most effective way to overcome the activation energy is to increase the internal momentum of the nuclei involved in the system. This will increase the vibrational KE of the system.
- this corresponds to forming H2, H + HF --> H2 + F , as seen above. We saw that a small increase in the internal momentum of H-F led to a massive increase in vibrational KE along H-F and the products were formed more easily compared with just increasing the transnational KEs
2) For an exothermic process, the most effective way to overcome the activation energy is to increase the translational momentum of the nuclei involved in the system. This will increase the Translational KE of the system.
- This corresponds to forming HF, these principles are demonstrated in the graphs in the tables above.
Good--Sw2711 (talk) 16:54, 31 May 2018 (BST)
References
- ↑ Anton, H. Calculus Multivariable, 9th ed.; John Wiley & Sons: UK, 2009.
- ↑ 2.0 2.1 2.2 2.3 Laidler, K. J.; King, M. C. The Development of Transition-State Theory. J. Phys. Chem. 1983, 87 (15), 2657–2664.
- ↑ 3.0 3.1 Darwent, B. deB. Bond Dissociation Energies in Simple Molecules, 1st ed.; Stans, M., Ed.; 1913.
- ↑ 4.0 4.1 Hammond, G. S. A Correlation of Reaction Rates. J. Am. Chem. Soc. 1955, 77 (2), 334–338.
- ↑ Jiang, B.; Guo, H. Relative Efficacy of Vibrational vs. Translational Excitation in Promoting Atom-Diatom Reactivity: Rigorous Examination of Polanyi’s Rules and Proposition of Sudden Vector Projection (SVP) Model. J. Chem. Phys. 2013, 138 (23), 234104.

