MRD:Clarachong
Exercise 1ː H + H2 system
Molecular reaction dynamics is the study of the molecular level mechanism of various elementary chemical processes. One such example would be the collision between a hydrogen atom and a H2 molecule. Each atom is assumed to comprise of hard spheres.
Dynamics from the transition state region
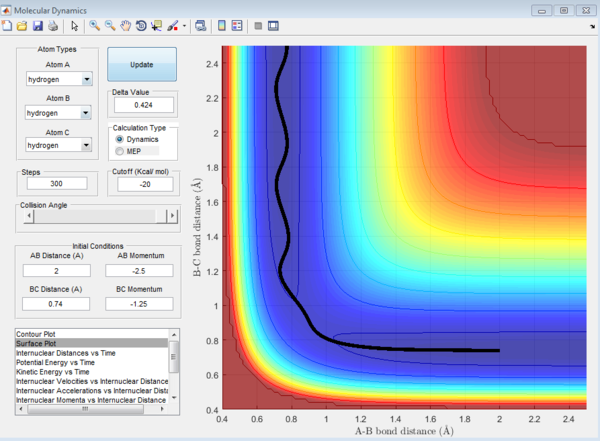
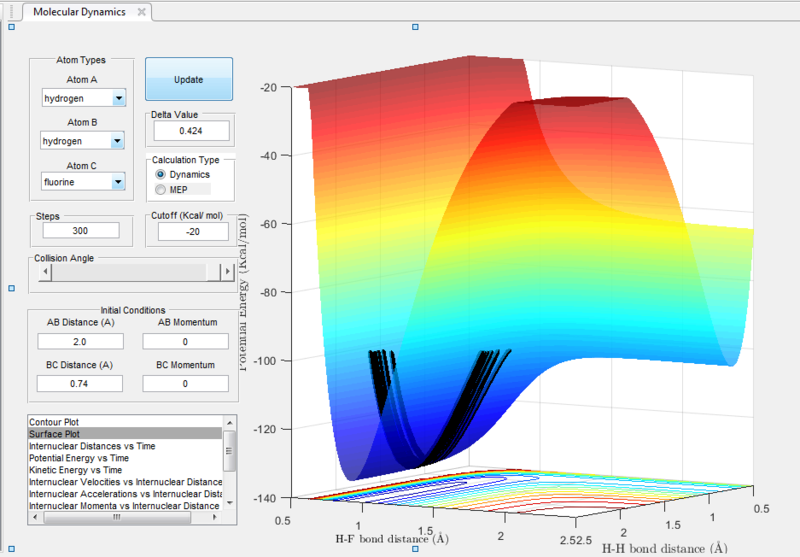
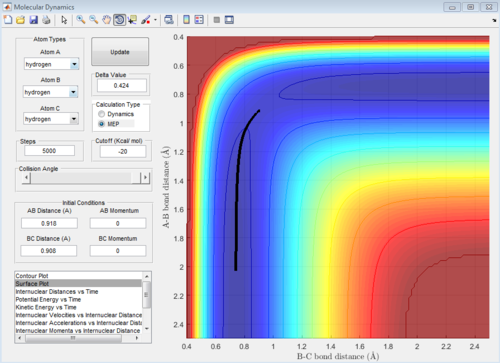
In the H+H2 system, where each H atom is represented by letters A, B and C, atoms B and C were assumed to be bonded with a bond distance set at 0.74A. Hydrogen A was then set at a distance of 2.30A. From these distances, the entrance and exit trajectory can be deduced as shown from the 2D surface plot (Figure 1).
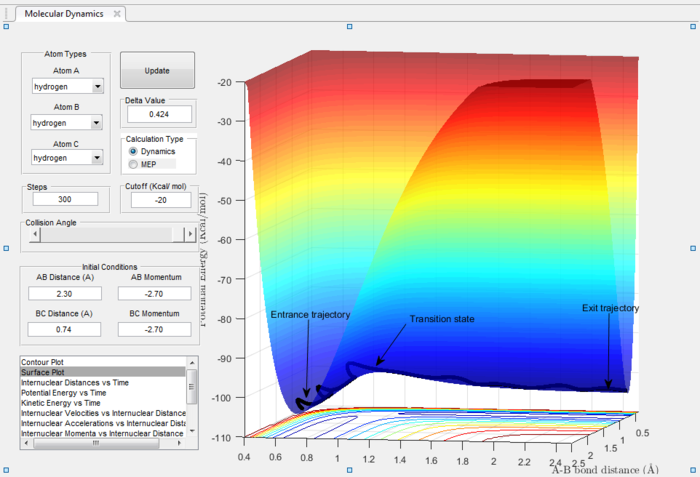
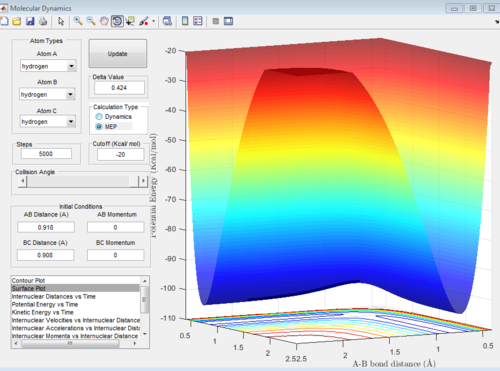
Rotation of the surface plot to obtain a 3D plot (Figure 2) shows the plot against that of potential energy. The reaction can be seen to be taking place in at an energy minimum. The reaction coordinates show the progress of the reaction, allowing the transition state, which has the highest potential energy, to be identified.
The vibrating black line illustrates that the diatomic molecule is not stationary and continuously undergoing vibration.
 |
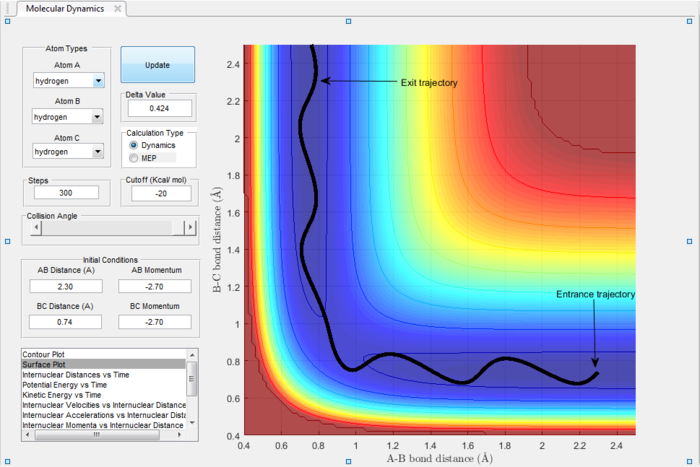 |
| Figure 1: 3D plot | Figure 2: 2D plot |
1. What value does the total gradient of the potential energy surface have at a minimum and at a transition structure? Briefly explain how minima and transition structures can be distinguished using the curvature of the potential energy surface.
The total gradient (first derivative) of PE surface at the minimum and at the TS = 0. The structures can be distinguished by calculating the second derivative. Transition state structures would have a second partial derivative of <0 while minima structures would be >0.
It is also important to note that the transition state is a saddle point unlike the minima.
Locating the transition state
2. Report your best estimate of the transition state position (rts) and explain your reasoning illustrating it with a “Internuclear Distances vs Time” screenshot for a relevant trajectory.
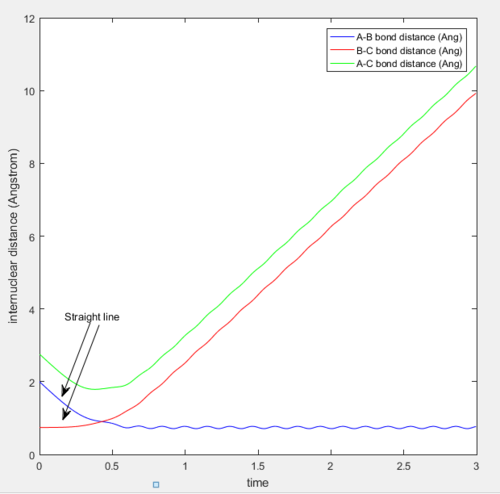
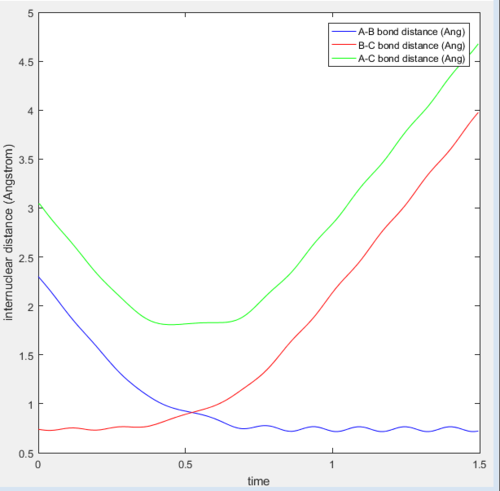
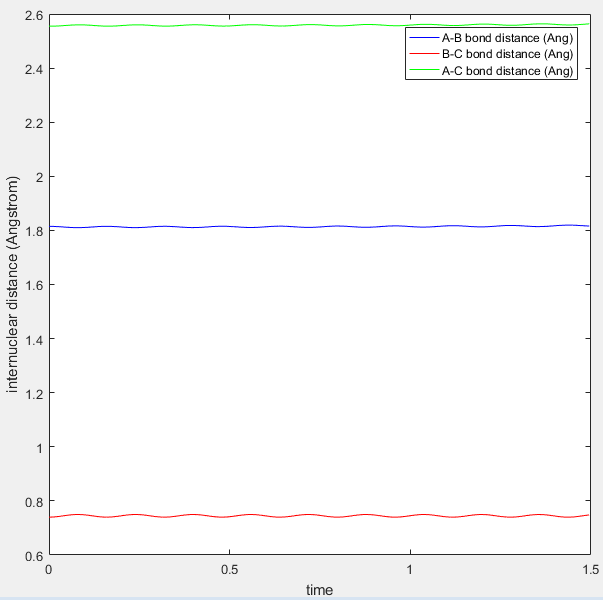
At the transition state position, the potential energy is a saddle point. Momentarily, these atoms are stationary and hence set to zero momenta (Figure 3). It is also known that the distance between the hydrogen A and B as well as B and C are identical. This distance of 0.908A is confirmed to be the transition state position as seen from the internuclear distance versus time graph (Figure 3). At the transition state when momenta is zero, the system would remain stationary regardless of time. Hence, the A-C bond distance (green line) should be a straight line with respect to time.
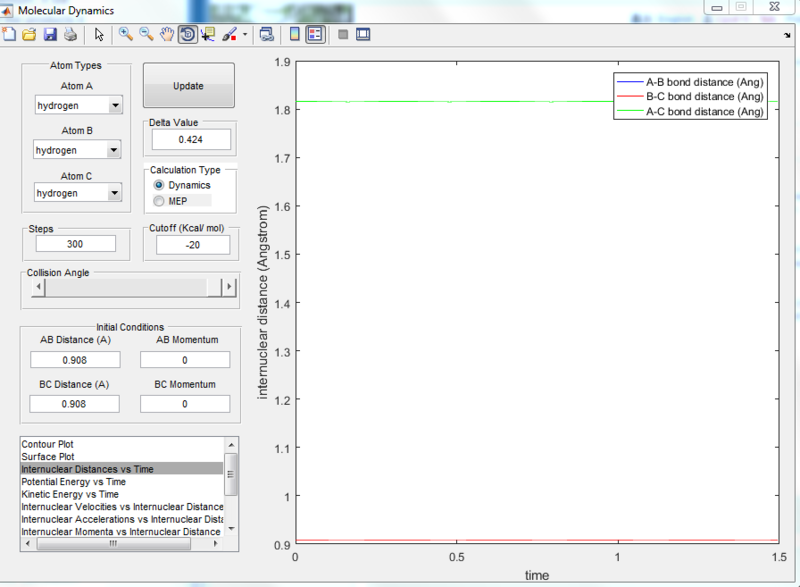 |
| Figure 3: Internuclear distance versus time at the transition state. |
The reaction path
3. Comment on how the MEP and the trajectory calculated differ.
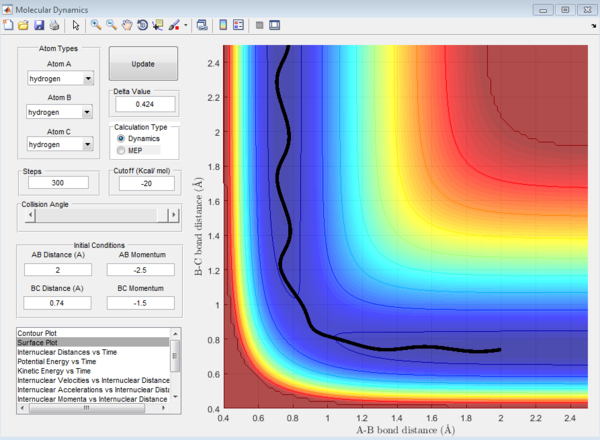
The continuous line connecting the reactants, products and the transition state can be known as the minimum energy path (MEP). This is reflected as a smooth black line (Figure 4 & 5). It is noted that MEP follows the valley floor. The concept of the MEP can be illustrated as follows: as the reaction progresses with time, when a snapshot of the reaction is taken at each time interval, with the velocity set at zero at each time step, points representing the minimum potential energy can be plotted. This gives the reaction pathway (valley floor). It is the path of least resistance which the reactants take to form the products.
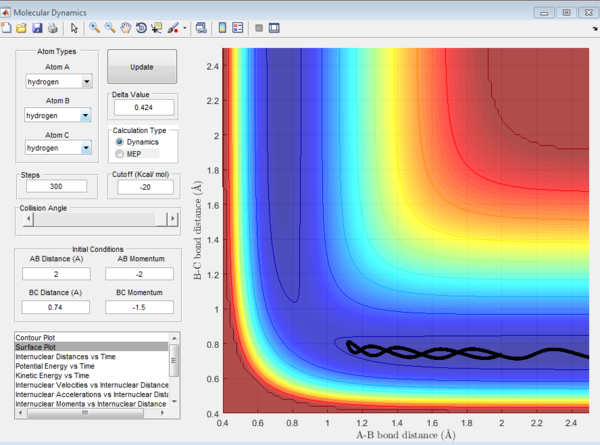
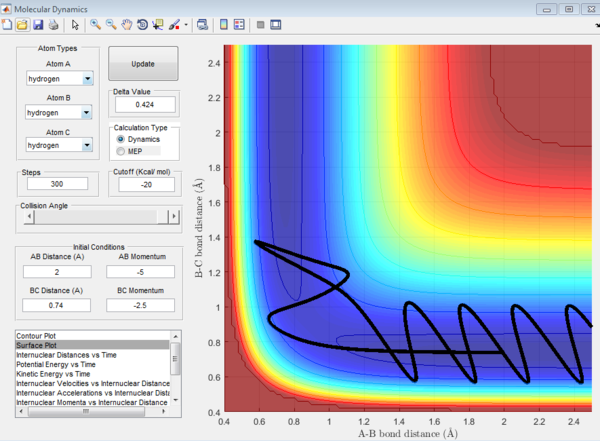
Conversely, when the plot was changed to dynamics with the same initial conditions, a sinusoidal curve was observed (Figure 6). This is due to the vibration of the hydrogen atoms during the reaction.
| MEP | Dynamics | ||
|---|---|---|---|
 |
 |
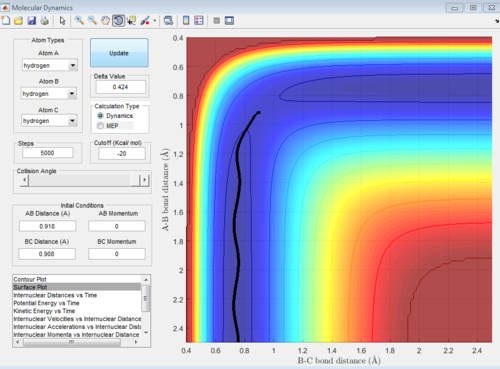 | |
| Figure 4: 3D MEP surface plot | Figure 5: 2D MEP surface plot | Figure 6: 2D dynamics surface plot | |
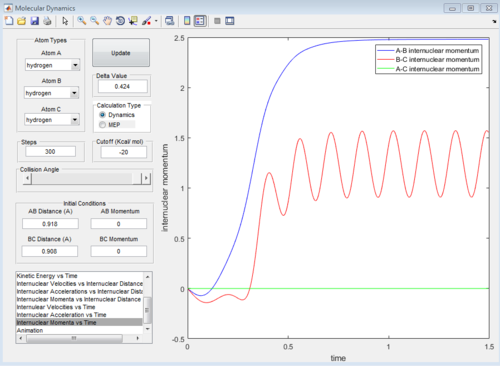
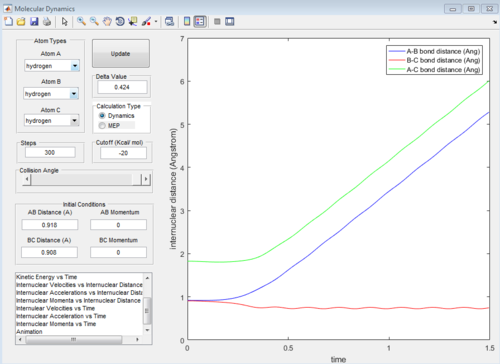
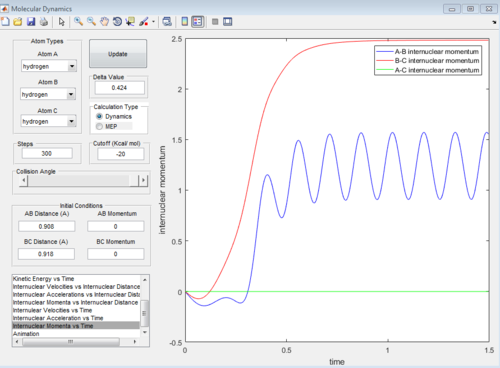
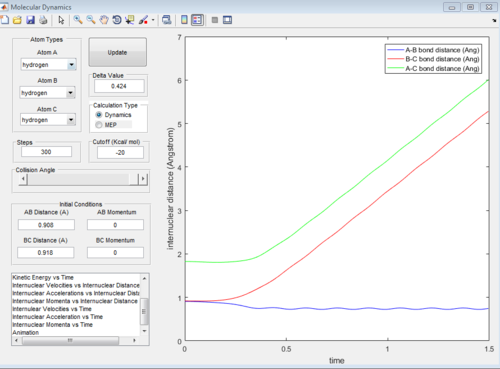
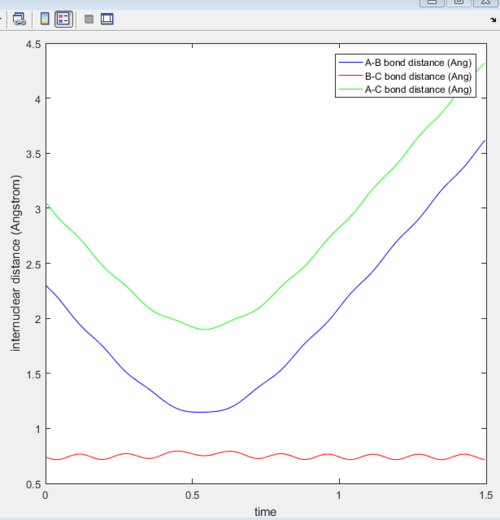
The reaction can also be investigated using the internuclear distance vs time and internuclear momenta vs time graphs under dynamic conditions when r1 = rts+0.01, r2 = rts and when the conditions are reversed to r1 = rts and r2 = rts+0.01.
Reactive and unreactive trajectories
4. For the initial positions r1 = 0.74 and r2 = 2.0, trajectories were ran with the following momenta combination:
5. State what are the main assumptions of Transition State Theory. Given the results you have obtained, how will Transition State Theory predictions for reaction rate values compare with experimental values?
The transition state theory is used to explain qualitatively how chemical reactions take place. The theory assumes that when an activated complex is in equilibrium with the reactants, the rate of formation of products depends on the rate at which the activated complex passes through TS and every trajectory that passes through the TS is reactive.
From the first three cases above, the amount of kinetic energy present in the system was the main determining factor to if the reaction was reactive as the momenta of these three cases were relatively low. Whether the reactants proceed to form products depends on the amount of KE they posses and should they have sufficient KE to overcome the activation energy, products will be formed. Hence, in these three cases, the transition state theory is largely valid and has been obeyed.
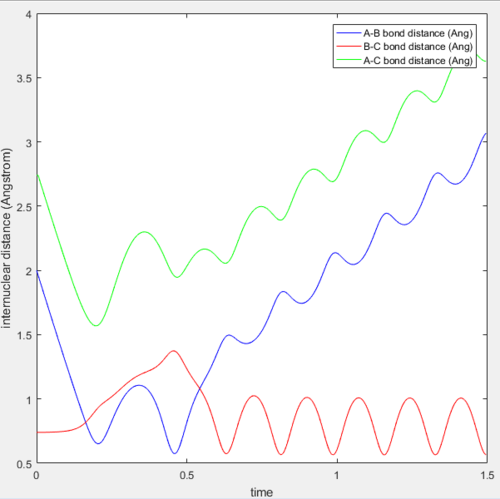
However, when the momenta of the reactions are significantly increased and should posses sufficient KE to overcome the activation energy and form products. This was not observed as the 4th trajectory was unreactive while the last trajectory was reactive. This suggest that there is a possibility of reactants crossing the transition state but instead of forming products, revert back to form the reactants. This is because the transition state theory does not consider the orientation and direction of approach of the reactants, as well as their vibrational and rotational states. Should the orientation of collision be non ideal, despite having sufficient KE, the reaction will not be successful. Hence, predictions using the transition state theory will always be higher than that of experimental values.
Exercise 2ː F - H - H system
PES inspection
1. Classify the F + H2 and H + HF reactions according to their energetics (endothermic or exothermic). How does this relate to the bond strength of the chemical species involved?
This relates to the bond strength of the products formed. The H-F bond is comparatively stronger than H-H (569KJ/mol vs 435KJ/mol), hence the formation of products HF would be more stable and at a lower potential energy than the reactants H2. The energy released during bond formation of H and F is larger than the energy required during bond breaking of H and H, resulting in an exothermic reaction. The converse is true for the reaction of H and HF.
2. Locate the approximate position of the transition state.
3. Report the activation energy for both reactions.
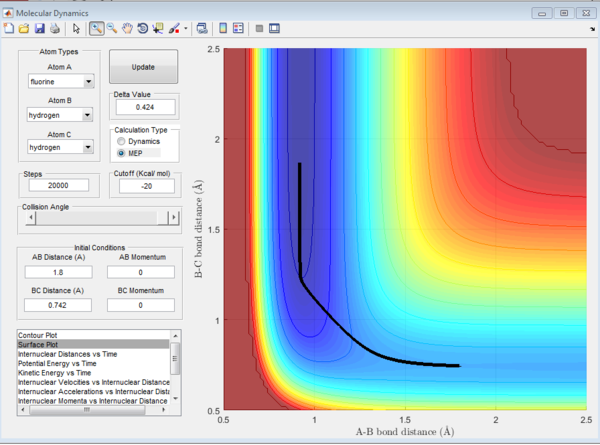
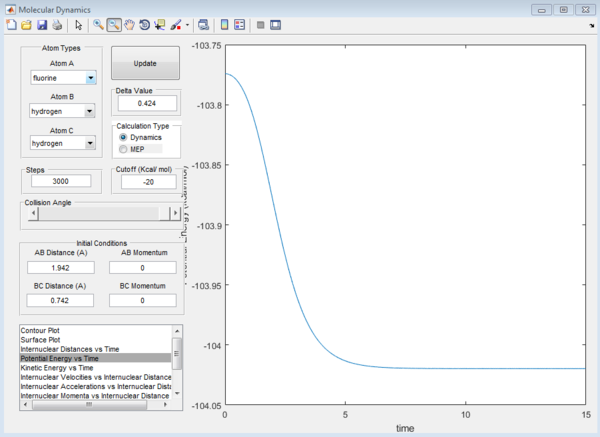
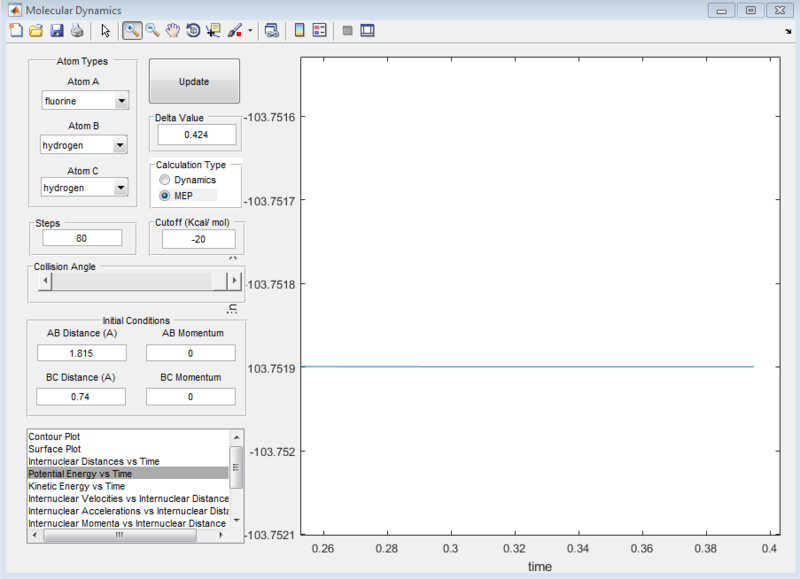
To determine the activation energy, the maximum point on the minimum energy path (energy of the transition state) was first determined. The energy of the transition state was determined to be -103.7519kcal/mol as shown from the zero gradient in screenshot below.
Subsequently, the energy of the reactants and products were determined. This has to be done by displacing the transition state slightly towards the reactants/products and running it as a MEP. The MEP will not run all the way to the reactants as that would require too many steps. Hence, in order to get to the energy of the reactants, we rerun using the dynamics path using the coordinates at the end point on the MEP as this would minimize oscillations compared if a MEP was not originally ran. Even though very small oscillations can be observed upon zooming in, the error is negligible.
Reaction Dynamics
4. For the F + H2 reaction, in light of the fact that energy is conserved, discuss the mechanism of release of the reaction energy. How could this be confirmed experimentally?
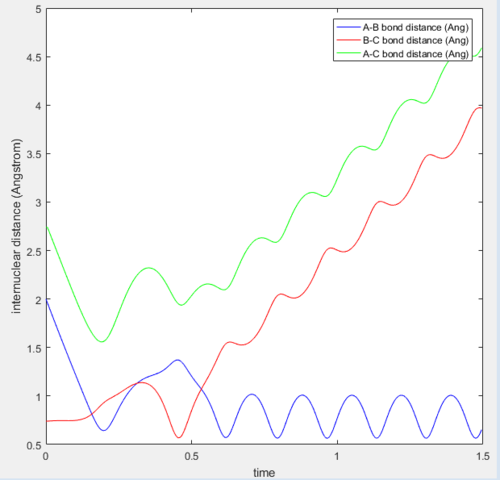
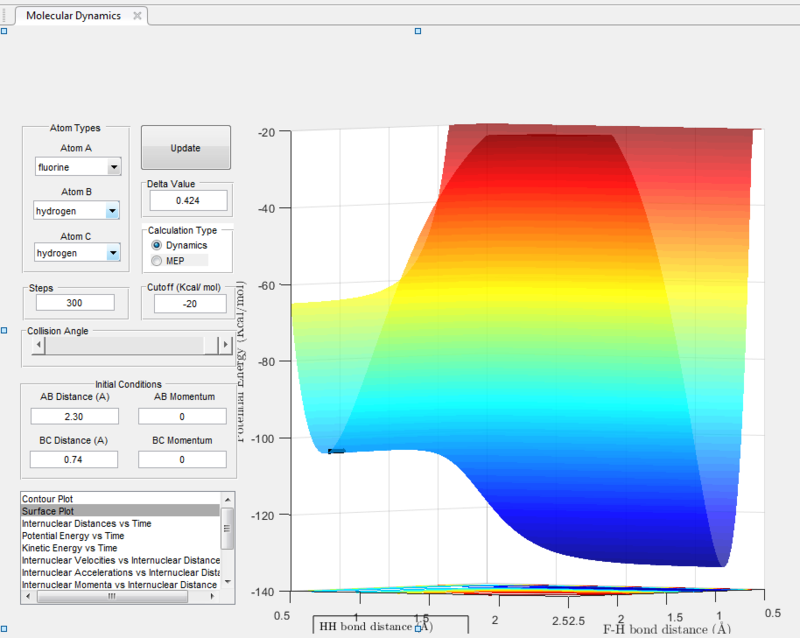
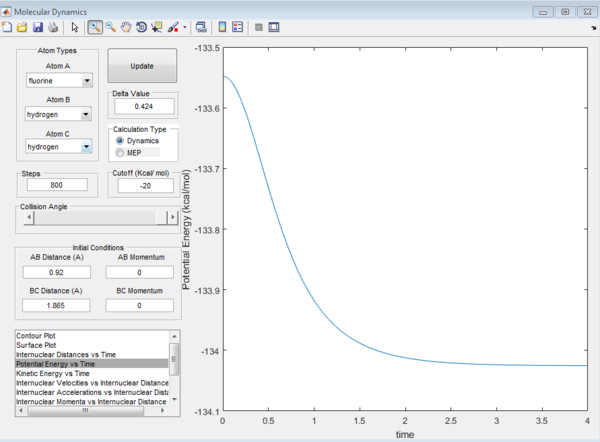
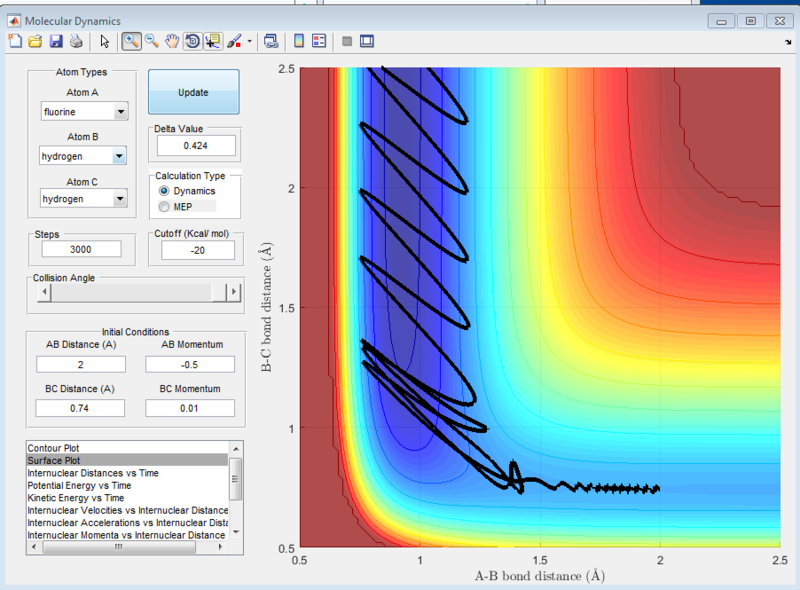
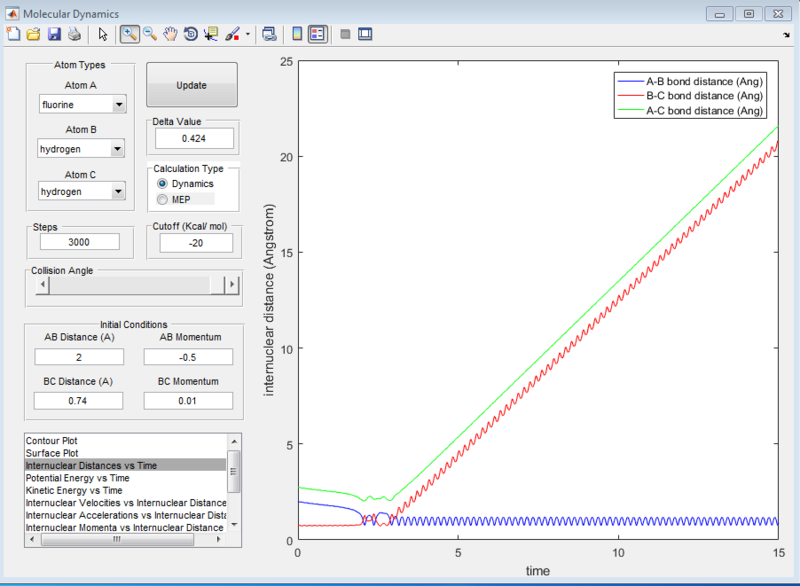
It can be seen from the surface plot that the at the conditions shown in the screenshot below, the it was a reactive reaction. As seen from the surface plot, the main mode of energy release is that of vibrational energy as the oscillations of the products are very large. From the internuclear distance plot, it can be observed that it took a total of 15seconds for the hydrogen atom to travel around 20 angstroms away from the HF molecule. (compare this subsequently for the reverse reaction)
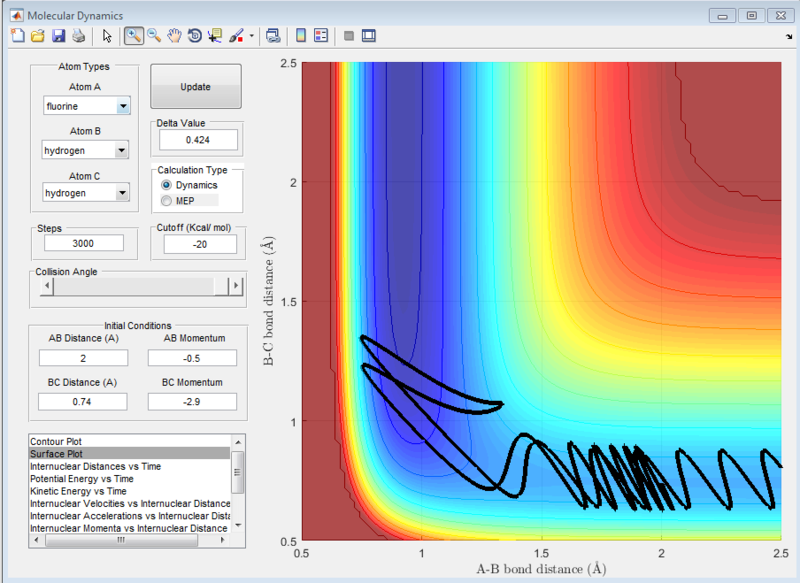
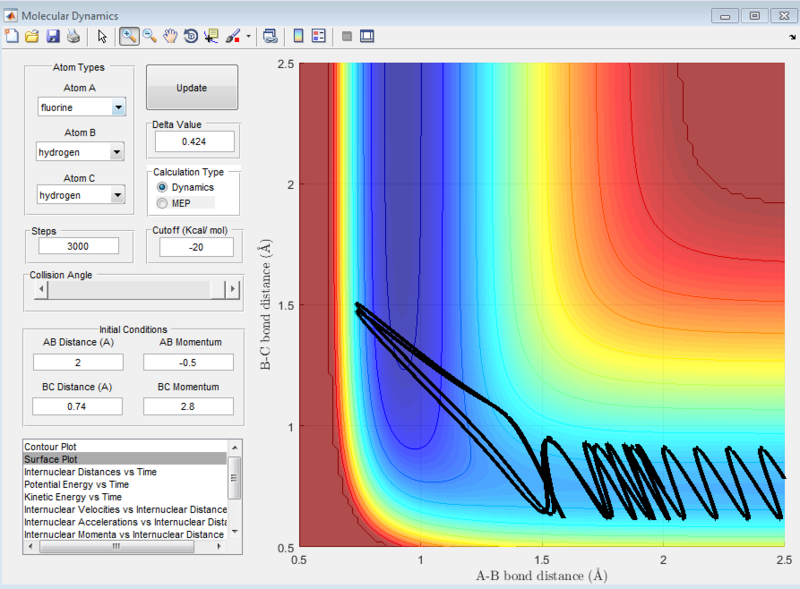
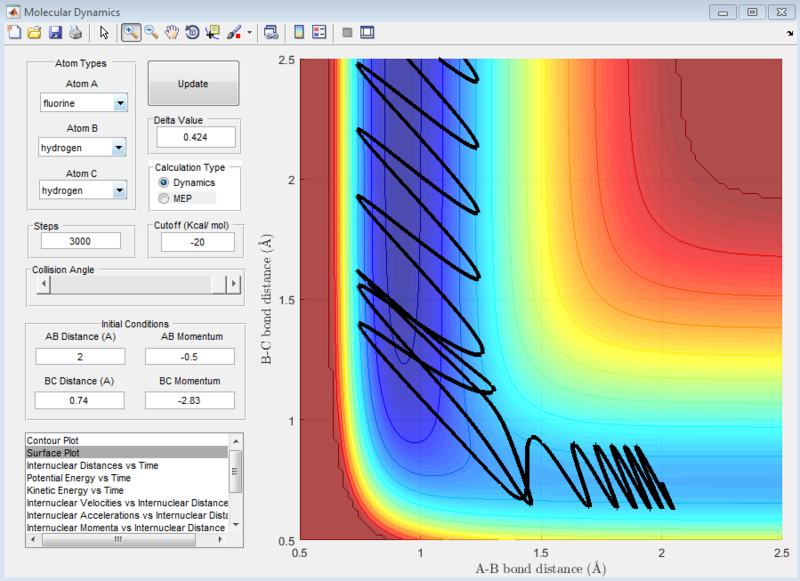
At the settings where rHH = 0.74, with a momentum pFH = -0.5, and pHH was varied in the range -3 to 3, it was observed that when pHH values are near to limits of 3 and -3, the reaction was not predictable, with some values providing reactive reactions while other similar values causing the reaction to be unreactive. These can be seen in the screenshots of the surface plots as shown.
| When pHH is near the -3 limit | When pHH is near the 3 limit |
|---|---|
 |
 |
 |
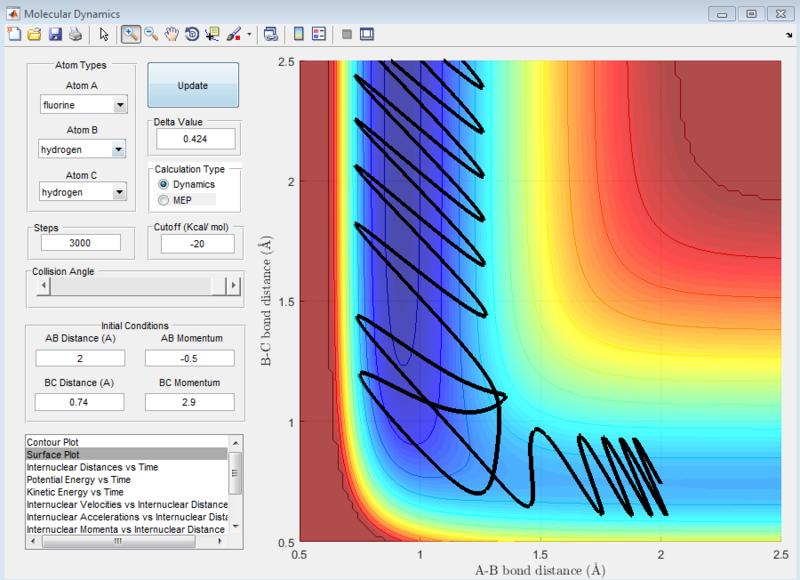 |
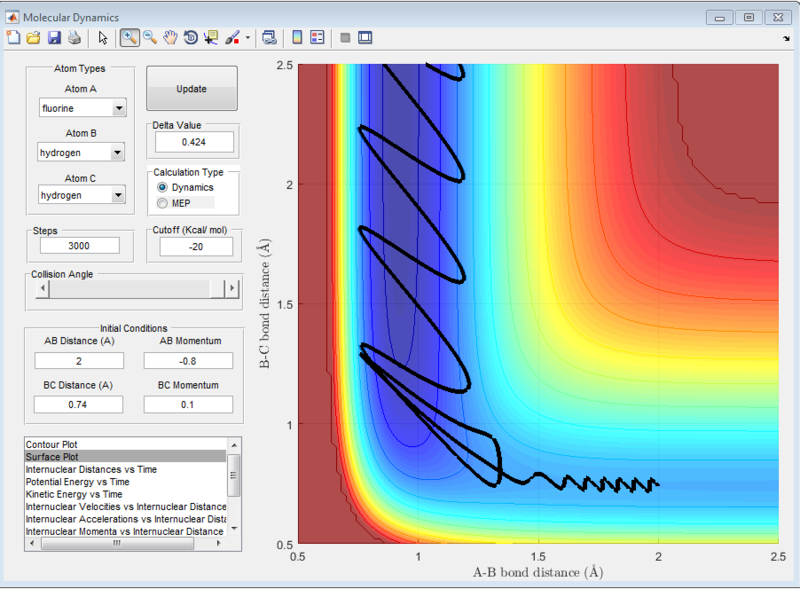
When the same distance conditions were used but pFH = -0.8 and pHH was decreased to 0.1, the reaction was reactive as shown below. Upon further investigation at the kinetic energy vs time plot, the initial kinetic energy which the system starts off with when pHH = 0.1 is around 0.3kcal/mol. However, when pHH was set near the limits, the initial kinetic energy was starting off much higher from 7kcal/mol to 12kcal/mol.
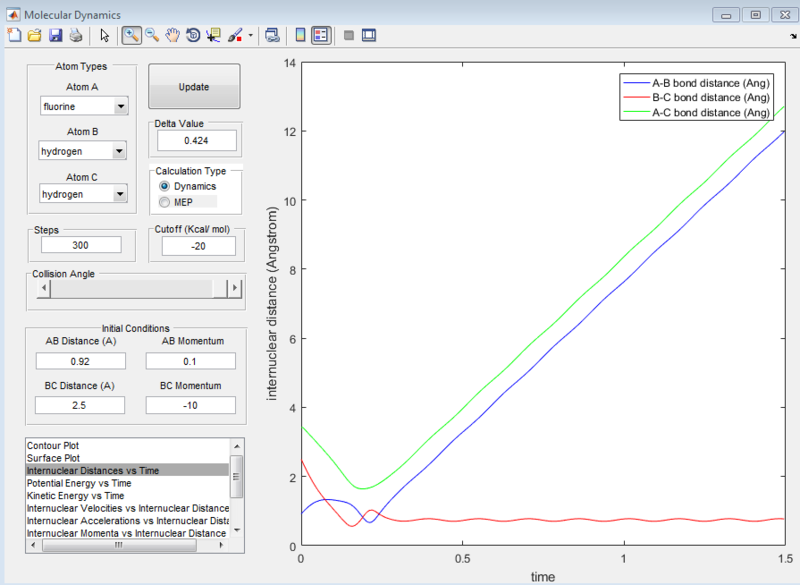
For the reverse reaction of HF + H, when an arbitrarily high value of pHH was set above the activation energy and a very low vibrational motion on on the H - F bond, it can be observed that the main mode of energy release is via translation. This can be seen from the surface plot below where there are not much oscillations. From the internuclear distance vs time plot, it can be observed that it only took 1.5seconds for the fluorine atom to travel more than 12 angstroms - much faster compared to the H2 + F reaction.
5. Discuss how the distribution of energy between different modes (translation and vibration) affect the efficiency of the reaction, and how this is influenced by the position of the transition state.
The Polanyi rules state that vibrational energy is more efficient in promoting a late barrier reaction (late transition state) that translational energy. Conversely, translational energy is more efficient in promoting a early barrier reaction (early transition state) compared to vibrational energy. This implies that when there are a large set of trajectories for a reaction with a late TS, some with low vibrational energies and high translational energies while others with low translational energies and high vibrational energies, the trajectories that have a high vibrational energy are more likely to be reactive.

